


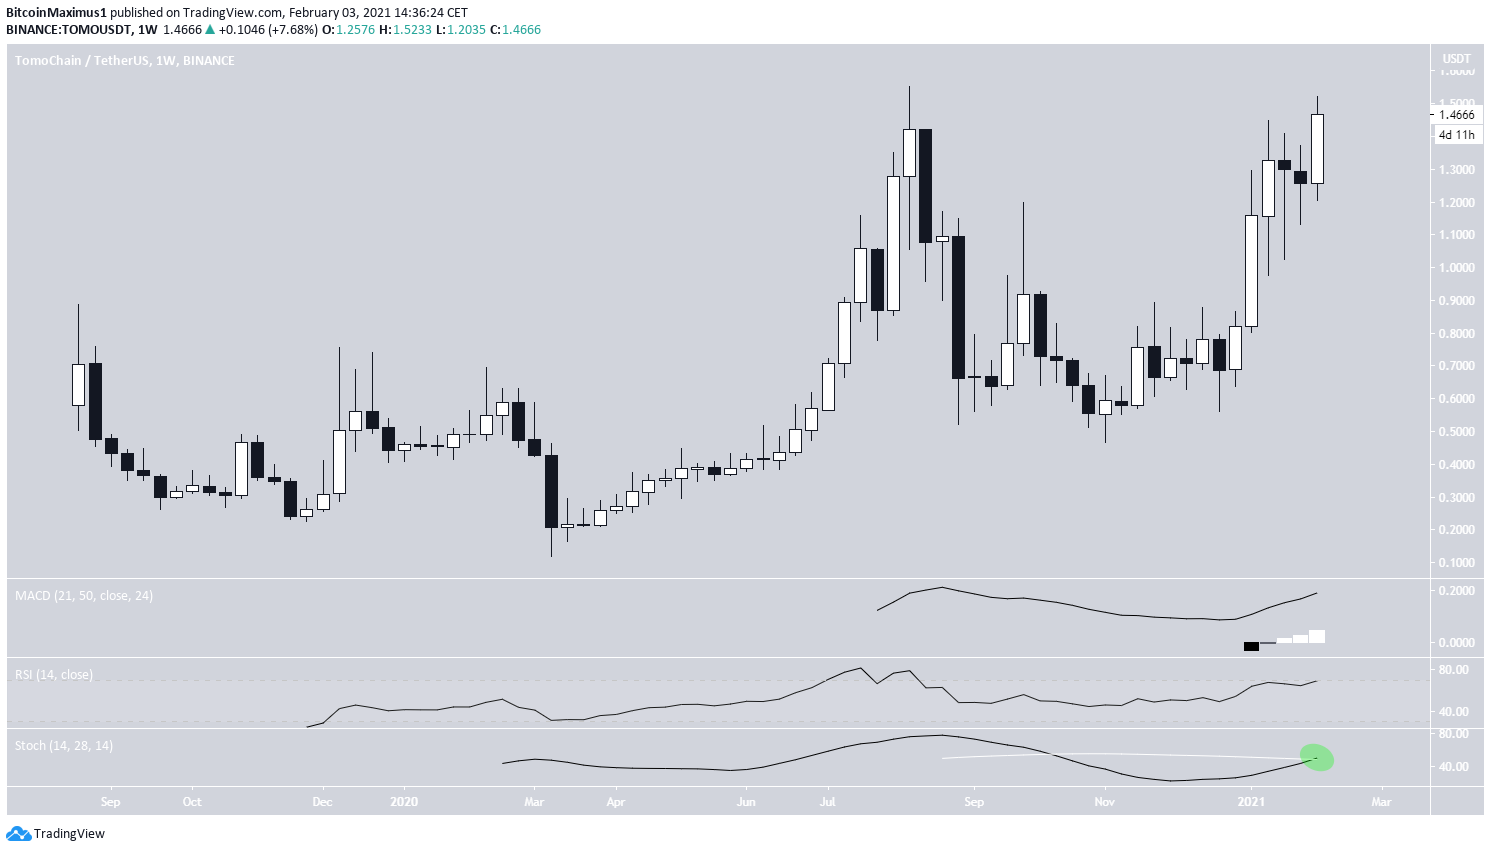
The Tomochain (TOMO) price is very close to breaking the previous all-time high price of $1.55, which it reached on Aug. 13, 2020.
Both technical indicators and the wave count support the possibility that TOMO will continue increasing and eventually break out, reaching a new all-time high price in the process.
Similarly, the trend for the BTC pair is also bullish.
TOMO Approaches All-Time High
TOMO has been moving upwards since it reached a low of $0.46 on Nov. 2020. So far, it traded at a high of $1.52, slightly below the all-time high price of $1.55, which it reached on Aug. 13, 2020.
Technical indicators are bullish and support a continuation of the upward move. Once it reaches a new all-time high, it should enter price discovery, and the rally could quickly turn parabolic.
Future Movement
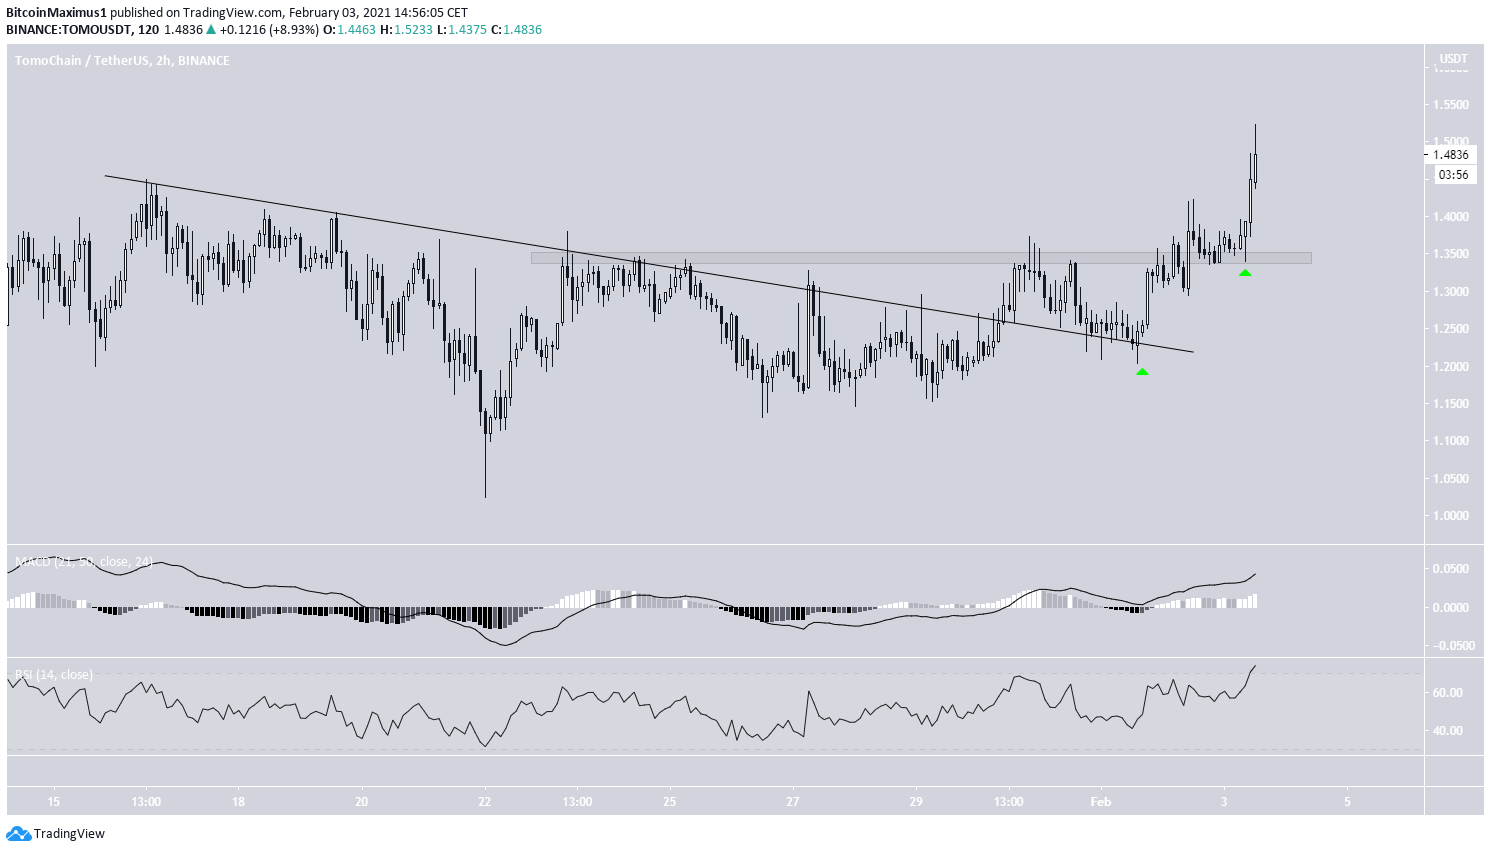
The shorter-term two-hour chart shows that TOMO has broken out from a descending resistance line and validated it as support afterward. Furthermore, it has reclaimed the $1.35 horizontal resistance area, which is now likely to act as support.
Technical indicators are also bullish, supporting the possibility that it will continue increasing with a potential new all-time high price.
Wave Count
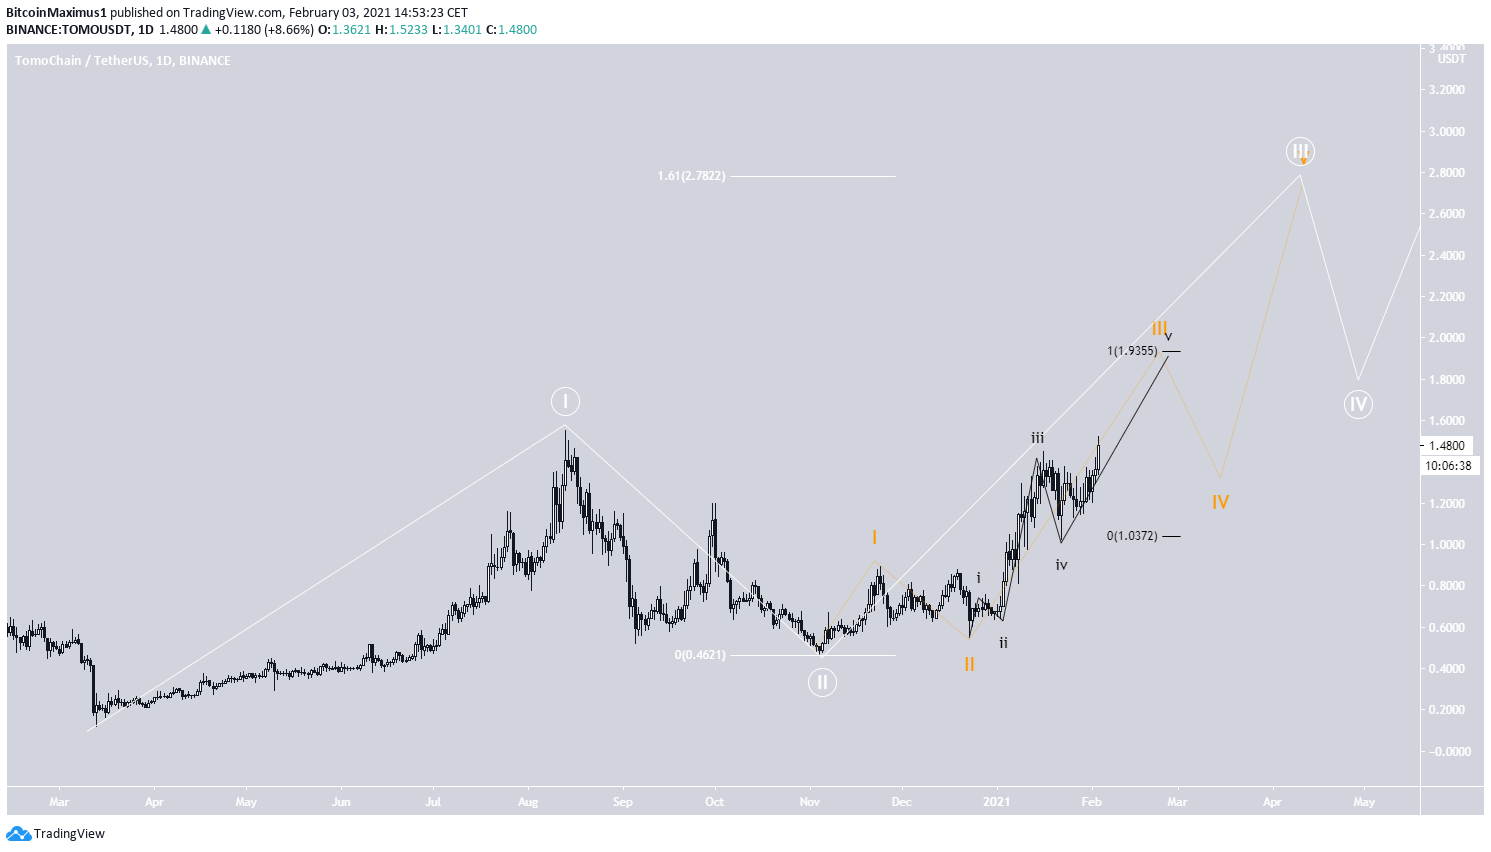
The most likely wave count suggests that TOMO is in wave 3 of a long-term bullish impulse, which began with the March 2020 lows. A likely target for the top of wave 3 is at $2.78, which would give waves 1:3 a 1:1.61 ratio.
The sub-wave count is in orange, indicating that the pair is in sub-wave 3, which will most likely target $1.93. The minor sub-wave count is shown in black.
TOMO/BTC
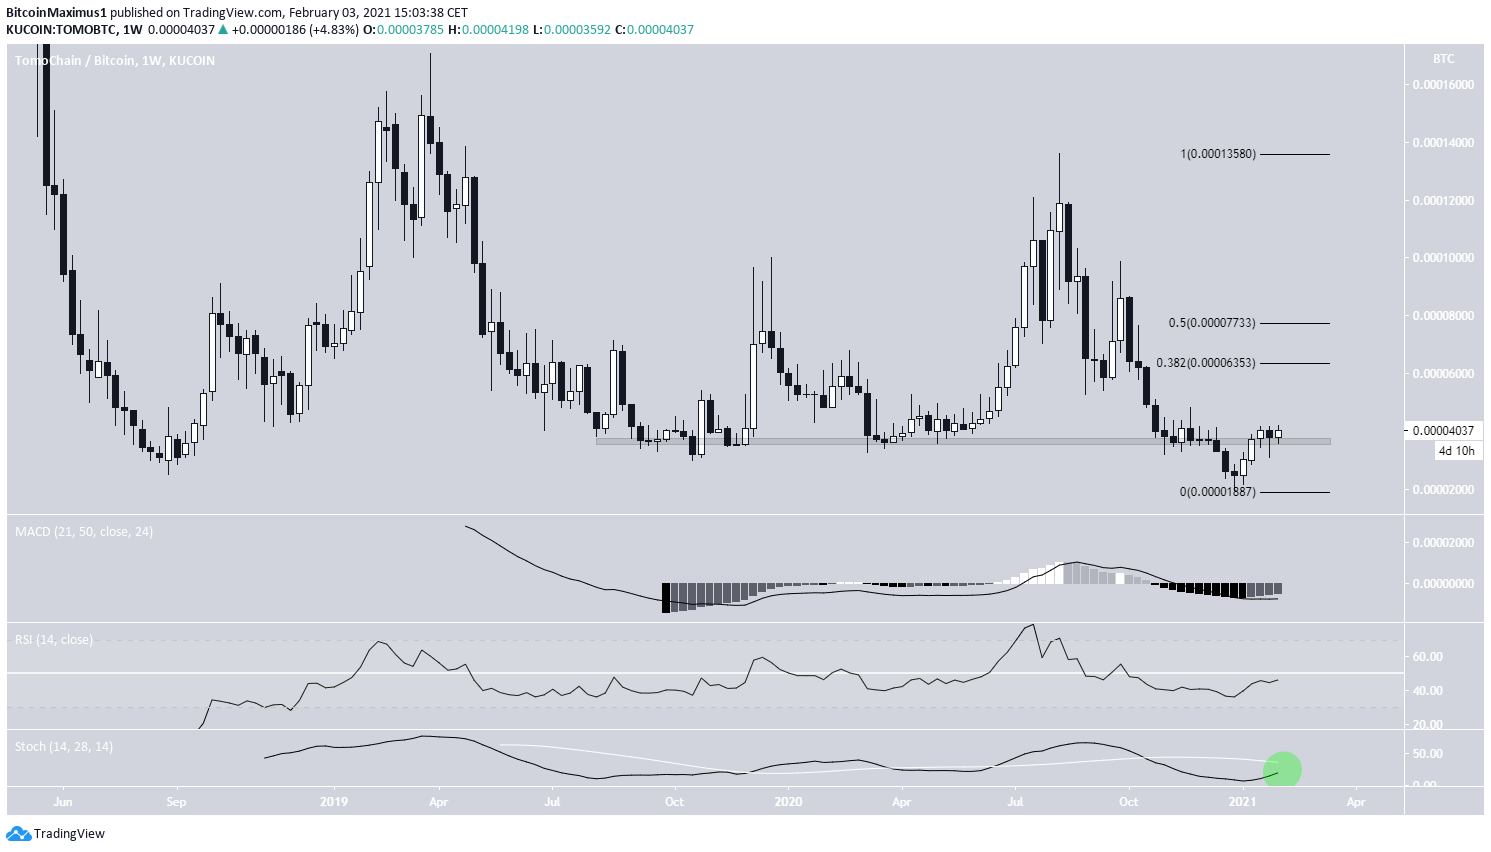
Cryptocurrency trader @JJJCycles outlined a TOMO/BTC chart, stating that price action is still at the beginning of an upward cycle.
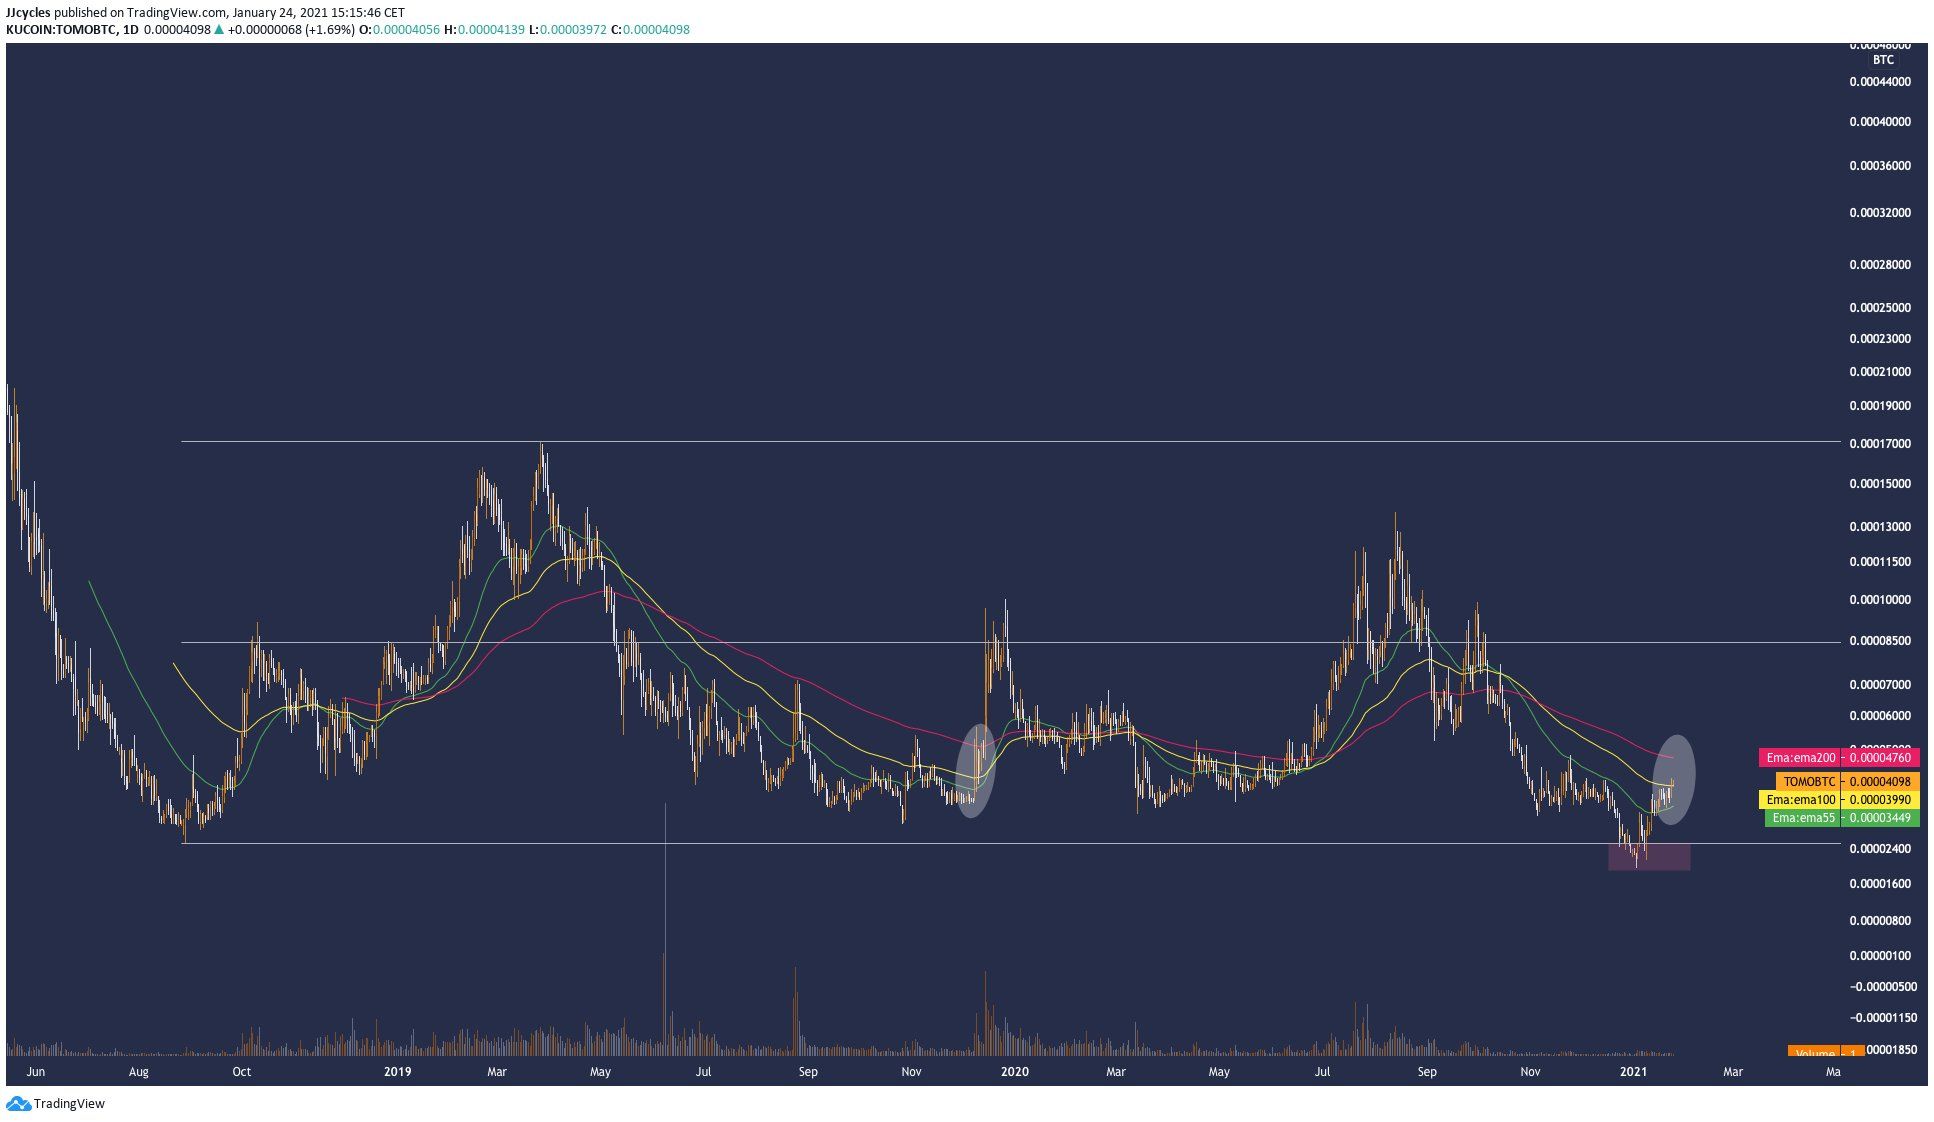
The weekly chart shows that after initially breaking down below the 3,600 satoshi resistance area, TOMO has now reclaimed it and is moving upwards.
This is a bullish sign that suggests that an upward move is likely. Technical indicators are also bullish, further supporting this possibility. If it continues to rally, the next closest resistance areas would be at 6,350 and 7,750 satoshis, respectively.
Conclusion
To conclude, TOMO/USD should continue increasing and break out, reaching a new all-time high price in the process.
The reclaim of the 3,600 satoshi area also suggests a bullish trend for TOMO/BTC, indicating that further increases are likely in store.
For BeInCrypto’s latest Bitcoin (BTC) analysis, click here


