The Ontology price is making an attempt at breaking out above a descending resistance line. Due to a bullish pattern and a similar previous fractal, it looks like it could be successful and move towards the next resistance area this time around.
Ontology Highlights
- The ONT price is following a descending resistance line.
- Long-term indicators suggest a reversal is likely.
- The price has broken out from an inverse head-and-shoulders pattern.
- There is support at 710 satoshis.
- There is resistance at 1,100 and 1,500 satoshis.
The Ontology price has been decreasing since Oct 27, 2019. Blockchain and cryptocurrency enthusiast @CryptoCaj believes that this decrease is coming to an end. He tweeted a chart for the Ontology (ONT) price and noted that it could soon break out above the current descending resistance line.
Looks like $ONT is about to go too! Send it! pic.twitter.com/lFPv5JYUTL
— ᏟΛᎫ (@Yo_CAJ) January 27, 2020
Descending Resistance Line
The ONT price has been following a descending resistance line for 94 days, since Oct 27, 2019. Its significance is increased by the presence of the 200-day moving average (MA), which coincides with this line.
The main support area is found at 710 satoshis. While the price has respected this area the majority of the time, it decreased below it twice prior to a breakout.
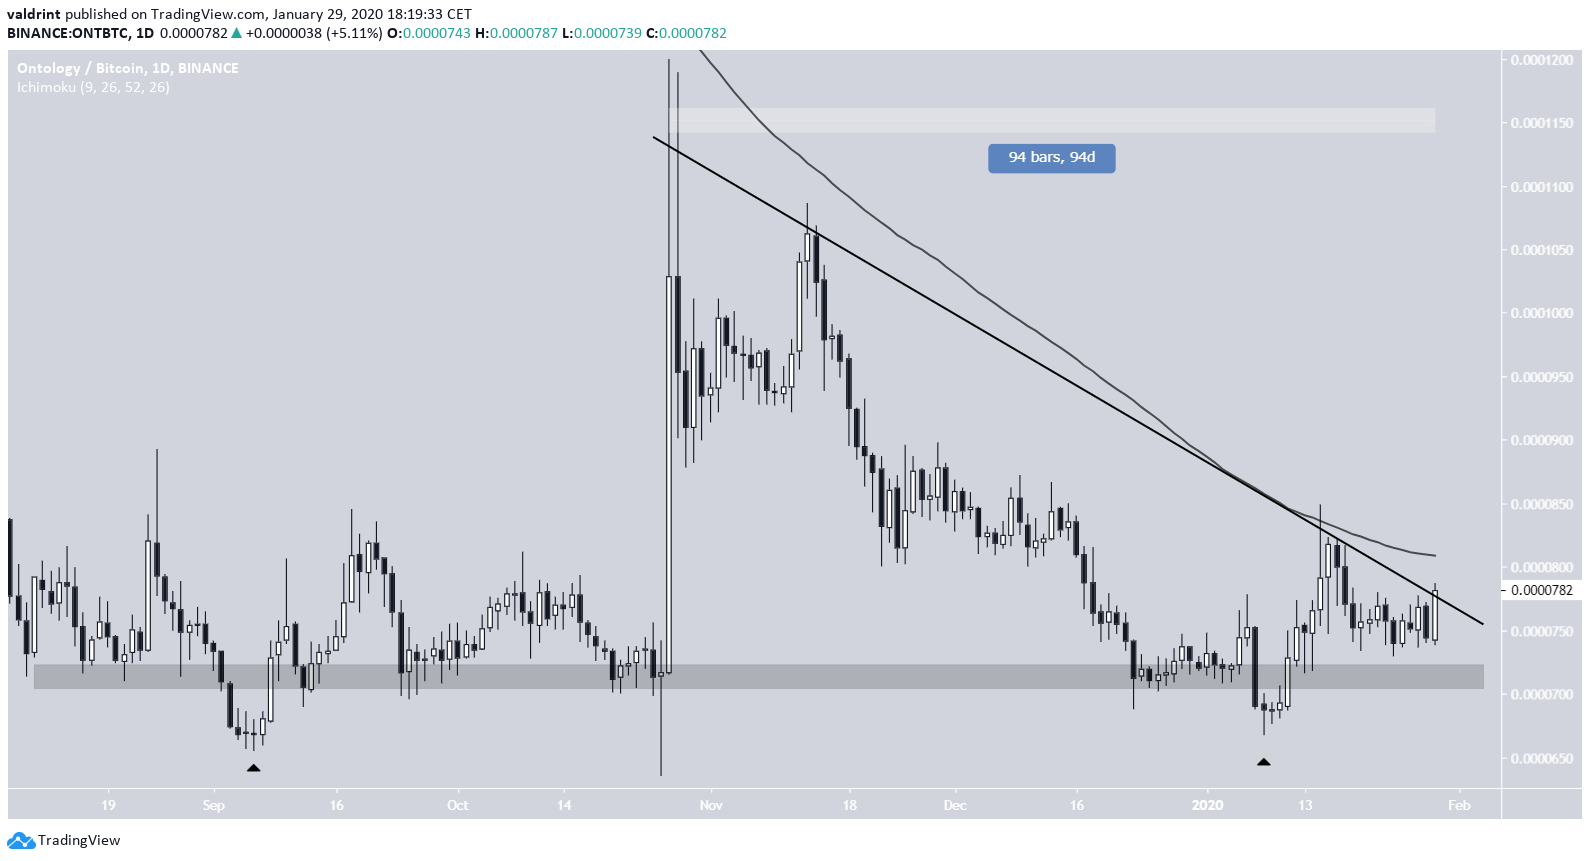
In September 2019, the price decreased below this area only to reclaim it and break out shortly after.
The price initiated a similar decrease on Jan 9, only to reclaim the support area once more and is currently making an attempt at breaking out.
Double-Bottom
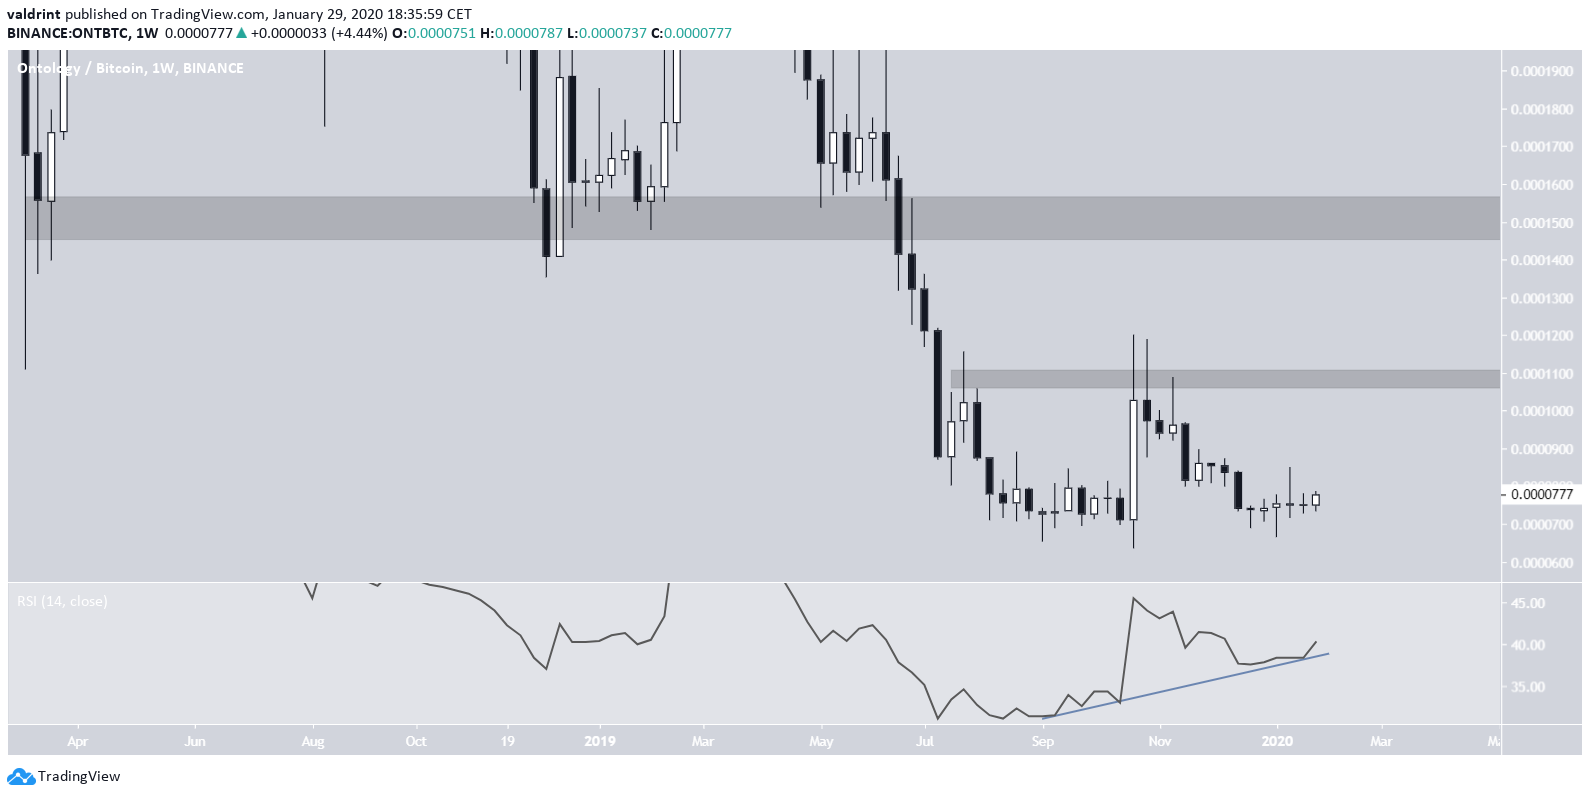
The weekly chart reveals that the price has made a double bottom in the period between September and January that was combined with a bullish divergence in the weekly RSI. This is a very strong sign that often leads to a price reversal.
If the price does so, the closest resistance areas are found at 1,100 and 1,500 satoshis. The latter also serves as the previous breakdown level, so a price increase above it would confirm that ONT is in a bullish market cycle.
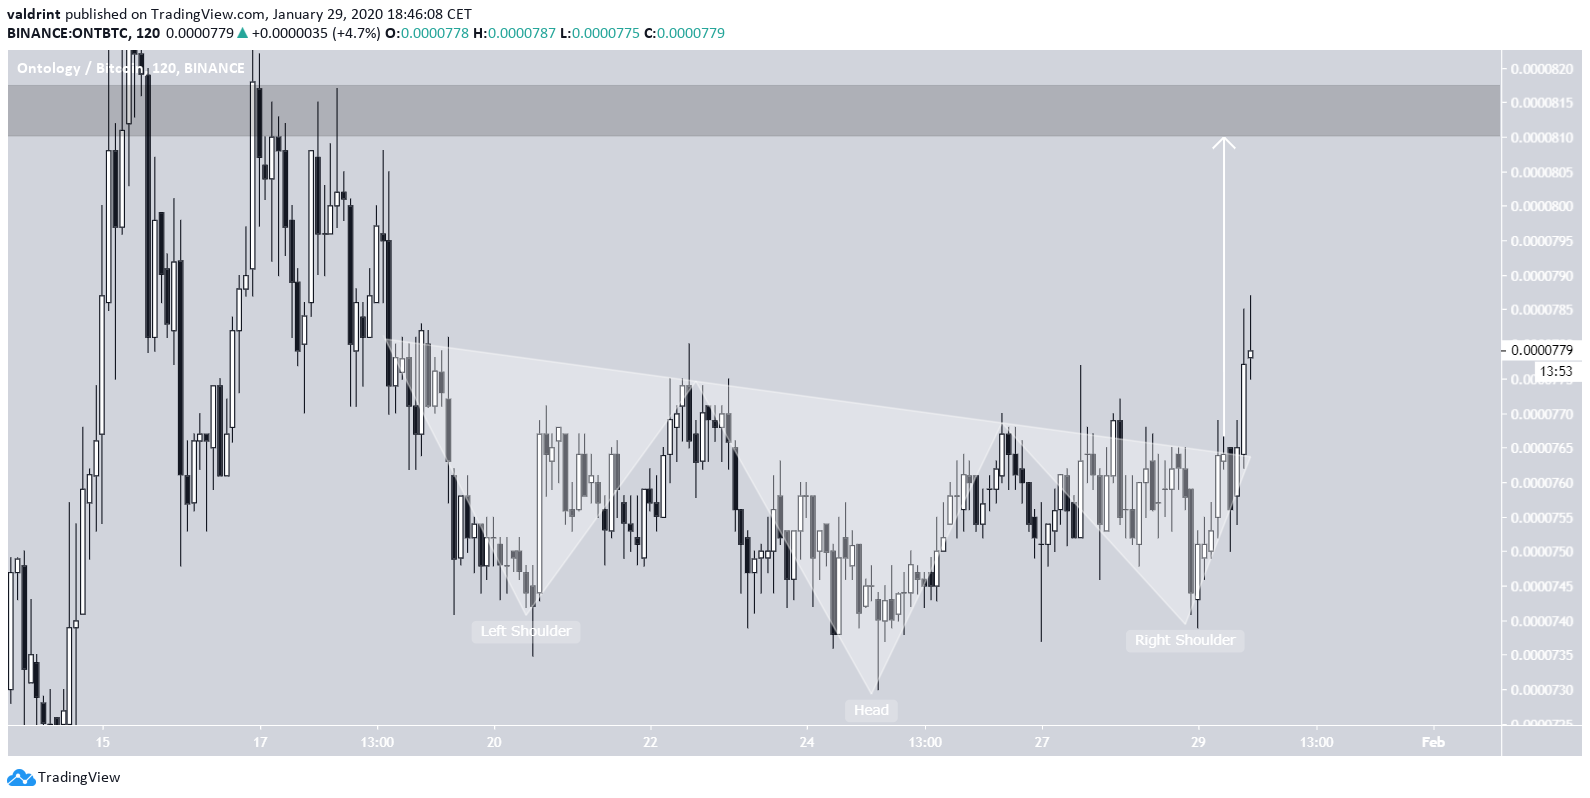
 Inverse Head-and-Shoulders
The short-term movement reveals an inverse head and shoulders pattern, out of which the price has just broken out.
A breakout that travels the entire height of the pattern would take the price to the minor resistance area at 815 satoshis, which would also be the beginning of the descending resistance line.
This movement appears to be most likely, and would also constitute a breakout above the descending resistance line.