


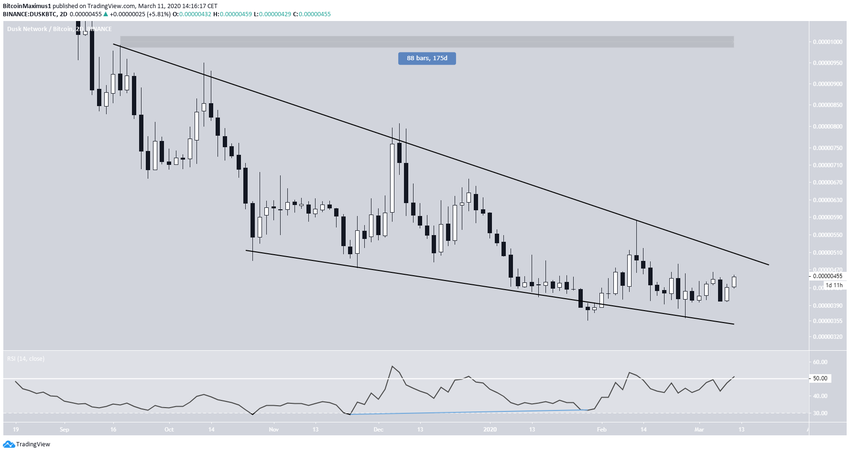
The DUSK price has been trading inside a descending wedge for the past 175 days. It reached a low on Jan. 29 and has been increasing ever since.
Dusk Network (DUSK) Price Highlights
- DUSK is trading inside a long-term descending wedge.
- The RSI has generated significant bullish divergence.
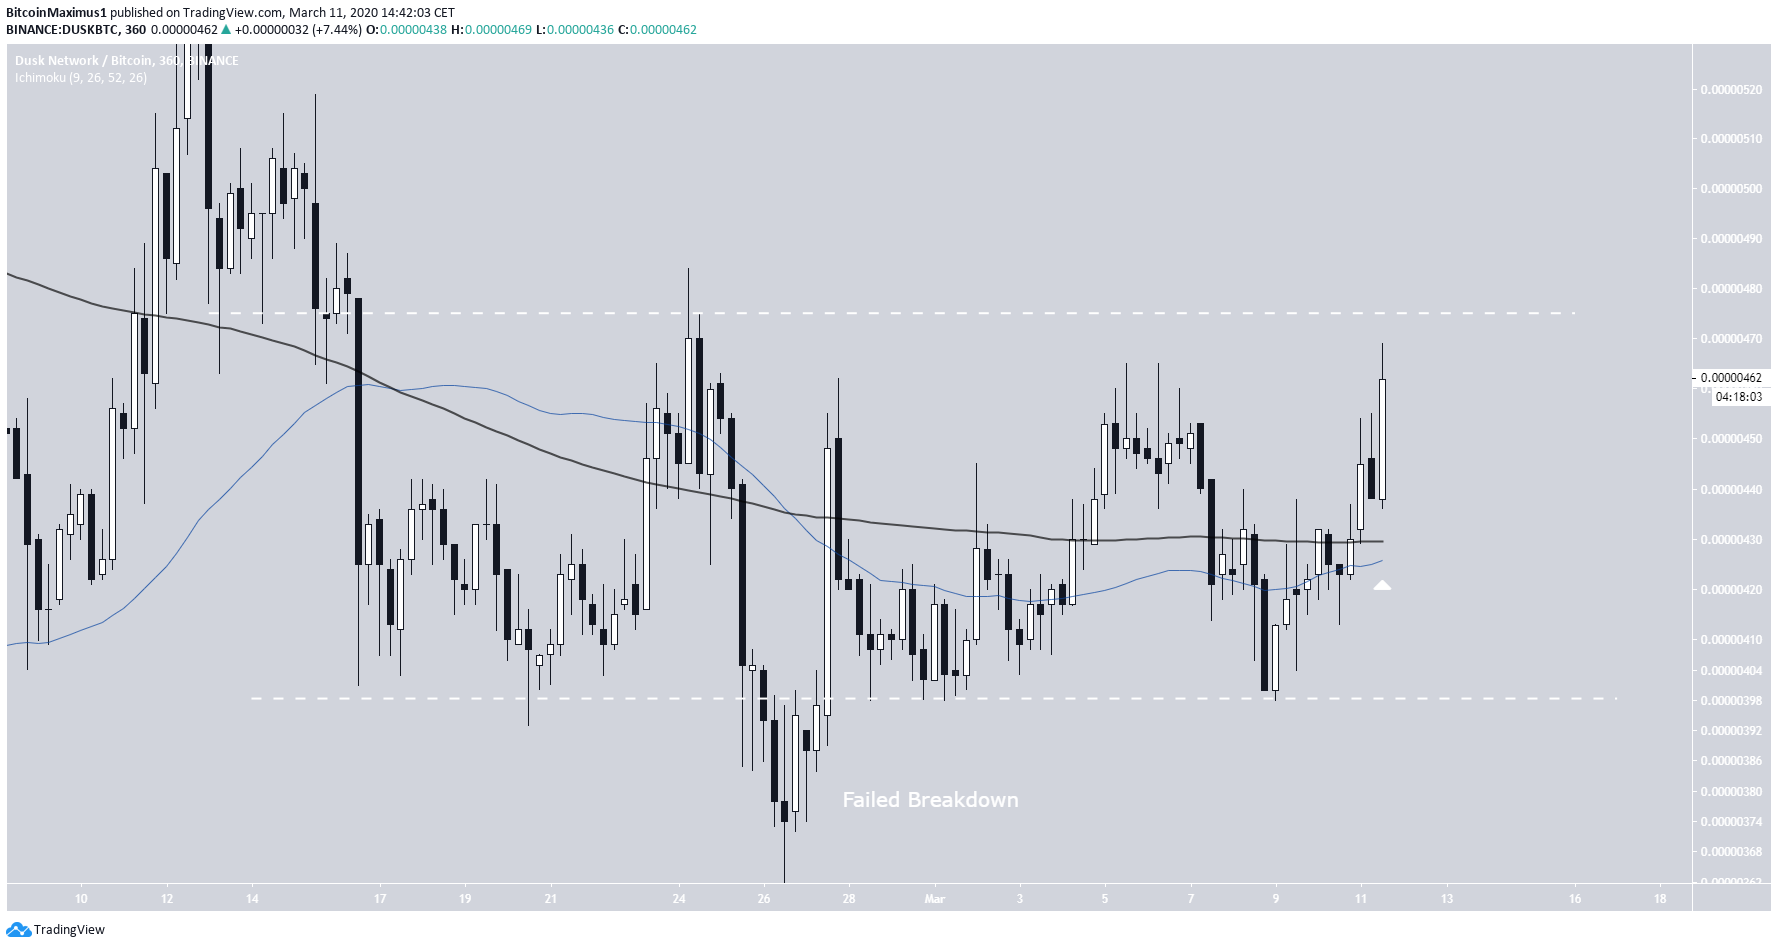
- The price is trading inside a range of between 400-480 satoshis.
- Medium-term moving averages are close to making a bullish cross.
Cryptocurrency trader and investor @Anbessa100 tweeted a DUSK price chart and stated that she believes this coin could perform well, since new listings have been posting gains recently.
New listings performed really well lately
What you think about $DUSK pic.twitter.com/msgdI9mEZE
— ANBESSA (@Anbessa100) March 11, 2020
Let’s take a closer look at the DUSK price movement and determine where it is heading to next.
Descending Wedge
The DUSK price has been trading inside a descending wedge for the past 175 days. A breakout seems likely for two reasons:
- The descending wedge is considered a bullish pattern
- The RSI has generated considerable bullish divergence.
Furthermore, it is in the process of moving above 50, which would indicate that the price is in a bullish trend. A breakout would likely cause the RSI to decisively move above 50.
The descending resistance line is currently near 500 satoshis, slightly more than 10% above the current price.
Trading Range
In the short-term, the price has been trading inside a range of between 400-480 satoshis. It initially broke down from this range on Feb. 26 but failed to sustain the lower prices and reclaimed the support level shortly after. This is a bullish sign that often precedes an upward move toward the range high.
A breakout above this range would likely mean a breakout above the long-term descending wedge.
The 50- and 200-period moving averages (MA) are very close to making a bullish cross, supporting the possibility of a breakout.
Future Movement
If the price breaks out, there are two main targets, found at 680 and 860 satoshis. The first target would be a 47% increase from the current price, while the second one an 85% price increase.
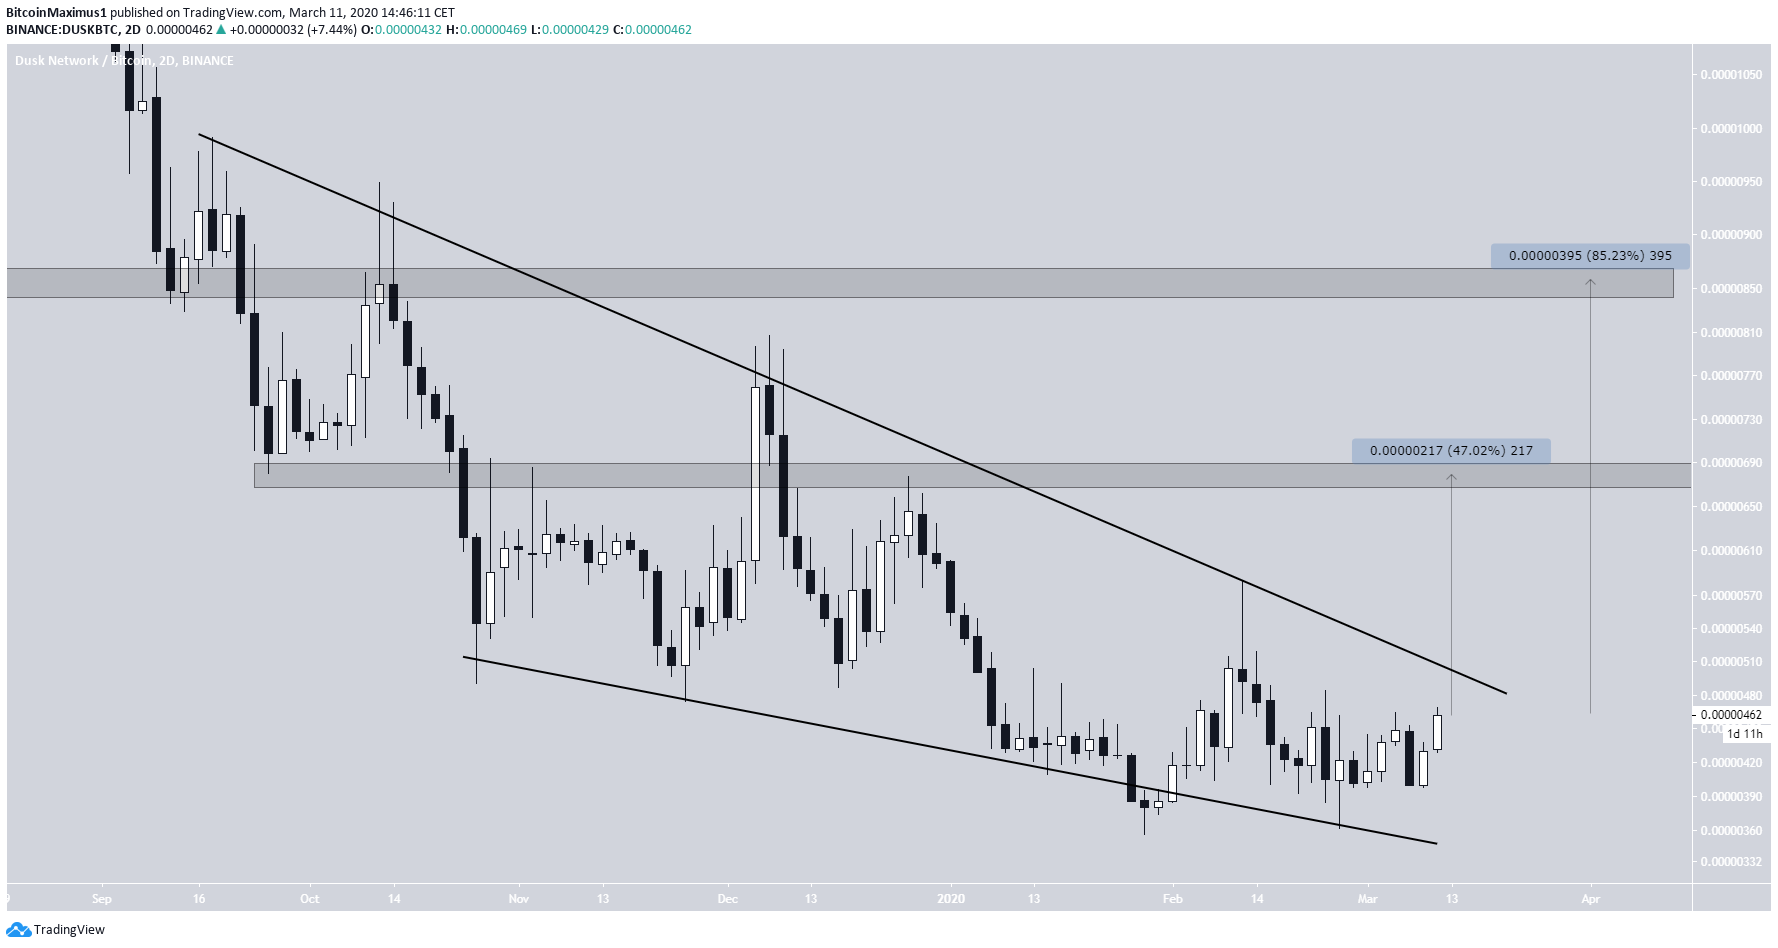
To conclude, the DUSK price has been trading inside a long-term bullish reversal pattern. A breakout could take the price as high as 860 satoshis.


