


The Augur (REP) price is retracing after a strong upward move, validating an important area as support.
If successful, it is expected to increase towards ₿0.0031-₿0.0036.
Augur Long-Term Outlook
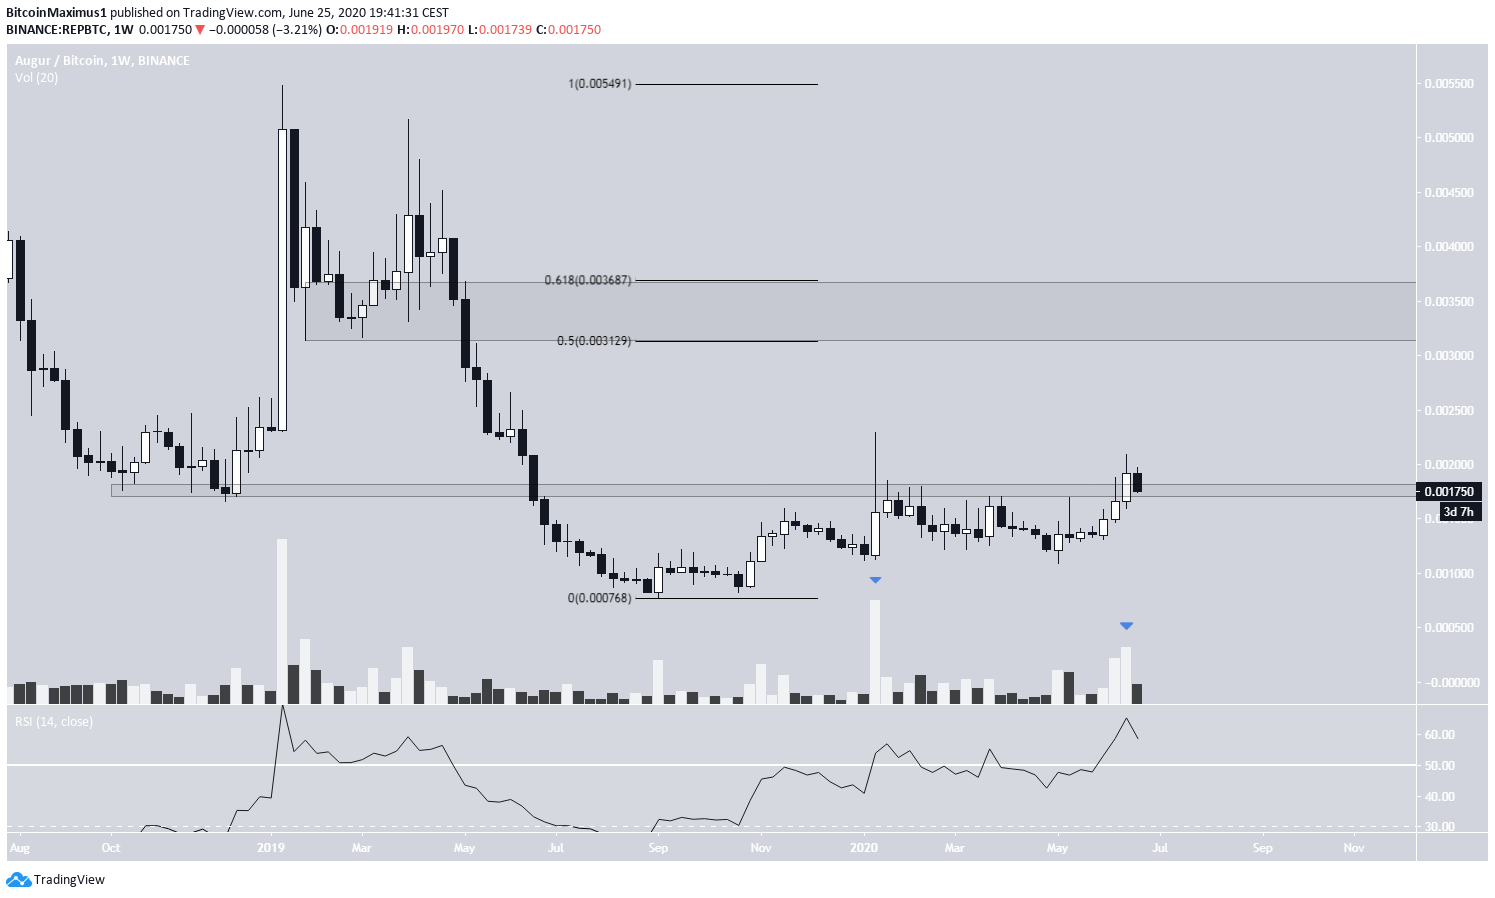
The Augur (REP) price has been gradually increasing since September 2019, when the price was trading at a low of ₿0.000767. The first attempt at initiating a bullish trend was made between Jan 13-20, 2020, when the price created a bullish candle with high volume. The price was pushed back down, however, creating a long upper-wick in the process. This also served to validate the ₿0.00178 resistance area, since the price failed to reach a close above it during the four weeks that followed, and began to decrease.
Last week, the price finally reached a close above this level, doing so with above-average volume. Furthermore, the weekly RSI has moved above 50, a sign that the price has already begun a bullish trend. If it continues moving upwards, the next resistance area will be found between the 0.5-0.618 Fib levels of the entire decrease, at ₿0.0031-₿0.0036.
The price is currently trading inside the aforementioned resistance area, which could now turn to support. We will take a look at a lower time-frame in order to find out.
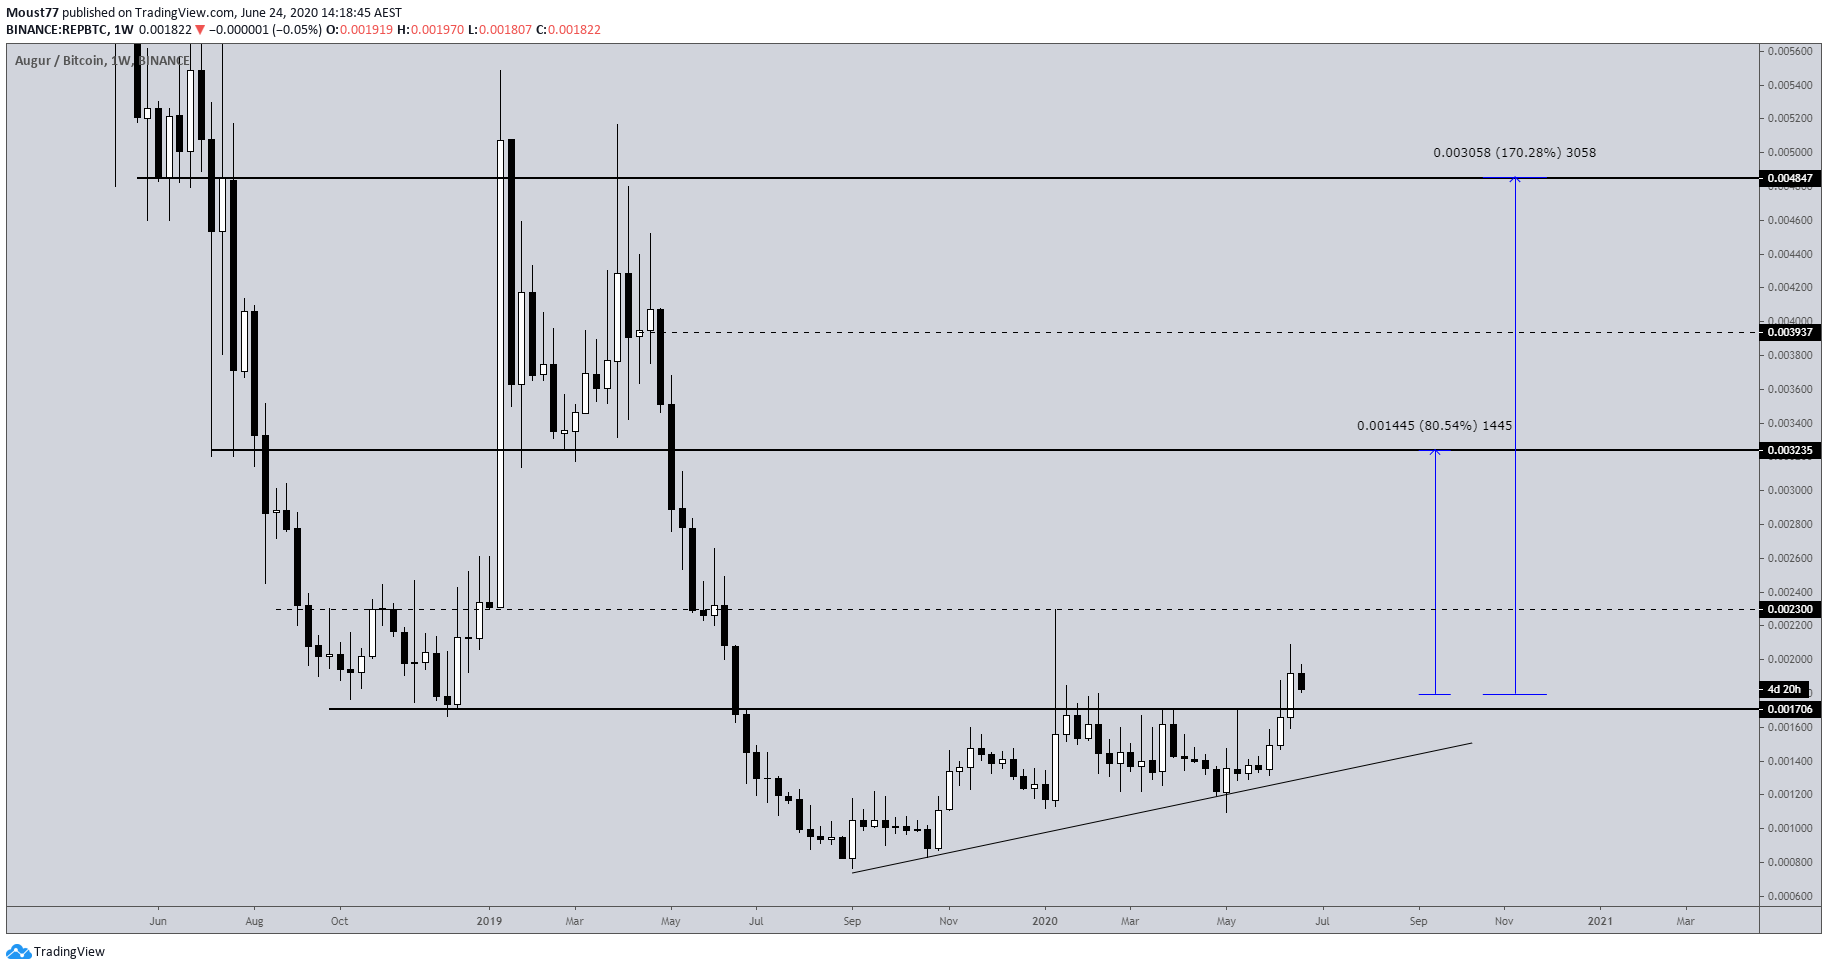
Cryptocurrency trader @BillGK_Crypto stated that the Augur (REP) price may soon begin to move upwards, giving targets of 80% and 170% above the current price.
While the first target is found right at the bottom of our resistance area, the second one is much higher, and a full retracement would be required for the price to reach it.
Ascending Channel
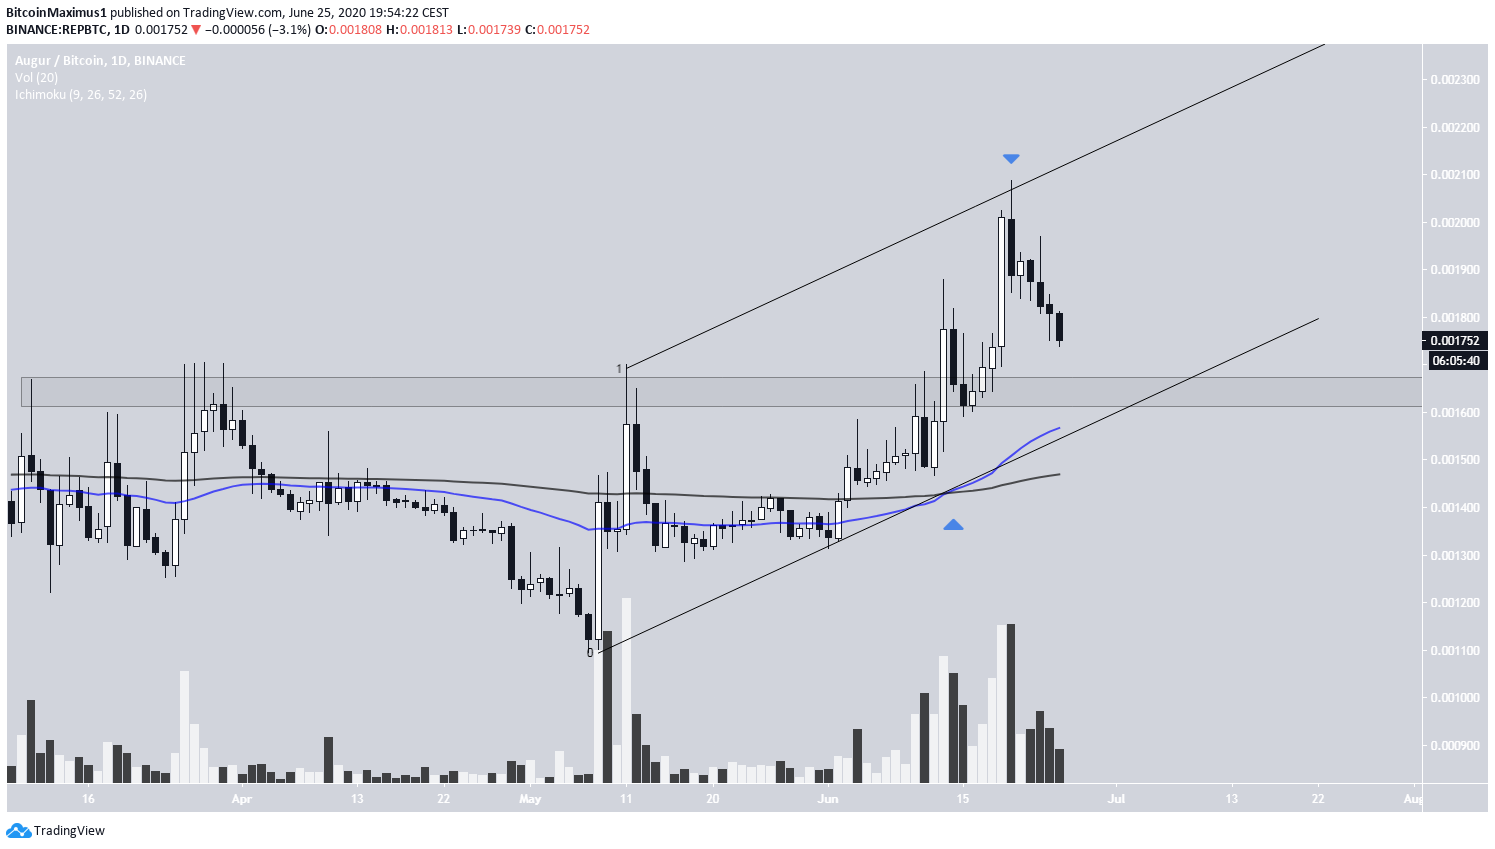
The daily chart shows that REP has been trading inside a parallel ascending channel since the rate of increase accelerated for the upward move on May 8. It was rejected by the resistance line on June 20 and has been decreasing since, approaching the minor support area at ₿0.00163.
Also, a bullish cross has transpired between the 50 and 200-day moving averages (MA), another sign that a bullish trend has begun.
The ₿0.00163 area is currently a confluence of support levels, created by the support line of the channel, 50-day MA, and a minor support area. Therefore, the most likely scenario is a bounce in this area, followed by a continuation of the upward move towards the resistance areas previously outlined.
To conclude, the REP price is expected to retrace towards the support area at ₿0.00163 before resuming its upward movement.


