The Quarkchain (QKC) price has been decreasing since June 22. However, it has reached an important support area and has shown numerous reversal signs, suggesting that the price might soon begin to move upwards.
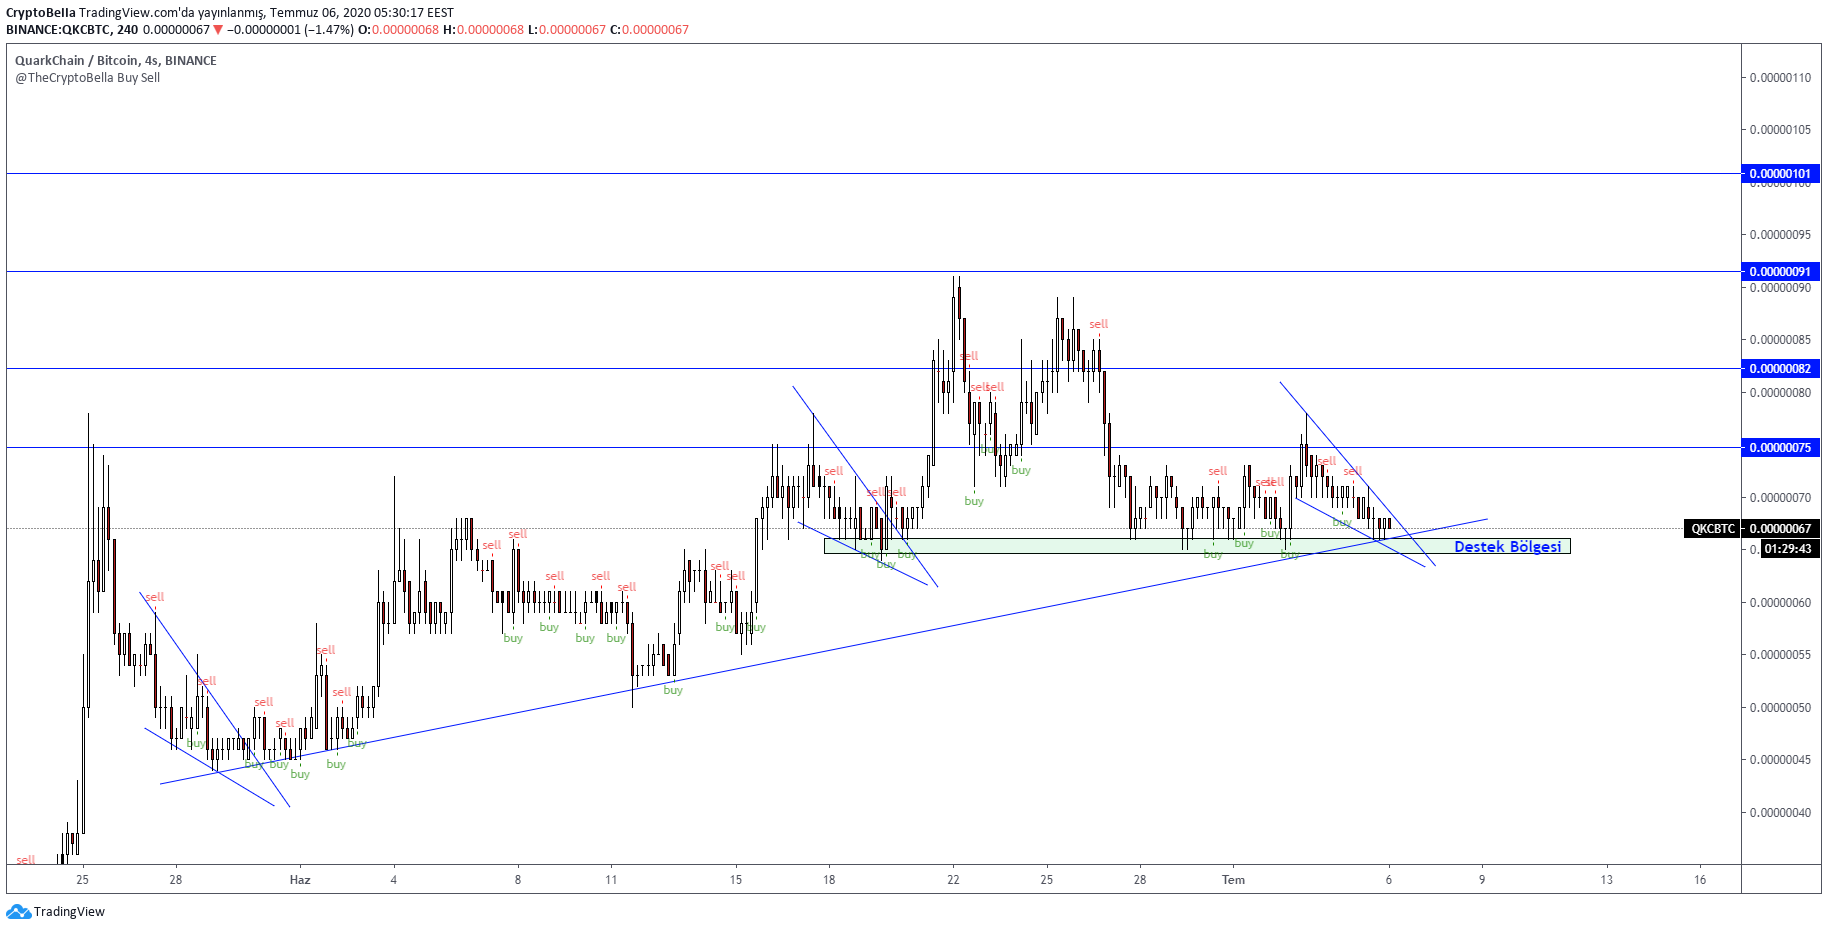
Cryptocurrency trader @TheCryptoBella posted a QKC chart, which shows the price following an ascending support line and possibly trading inside a descending wedge.
Quarkchain (QKC) Reaches Strong Supports
Indeed, the price has been following an ascending support line since May 27. At the time of press, the price was trading at a confluence of support levels, namely the ascending support line, 67 satoshi support area, and the 600-hour moving average (MA).
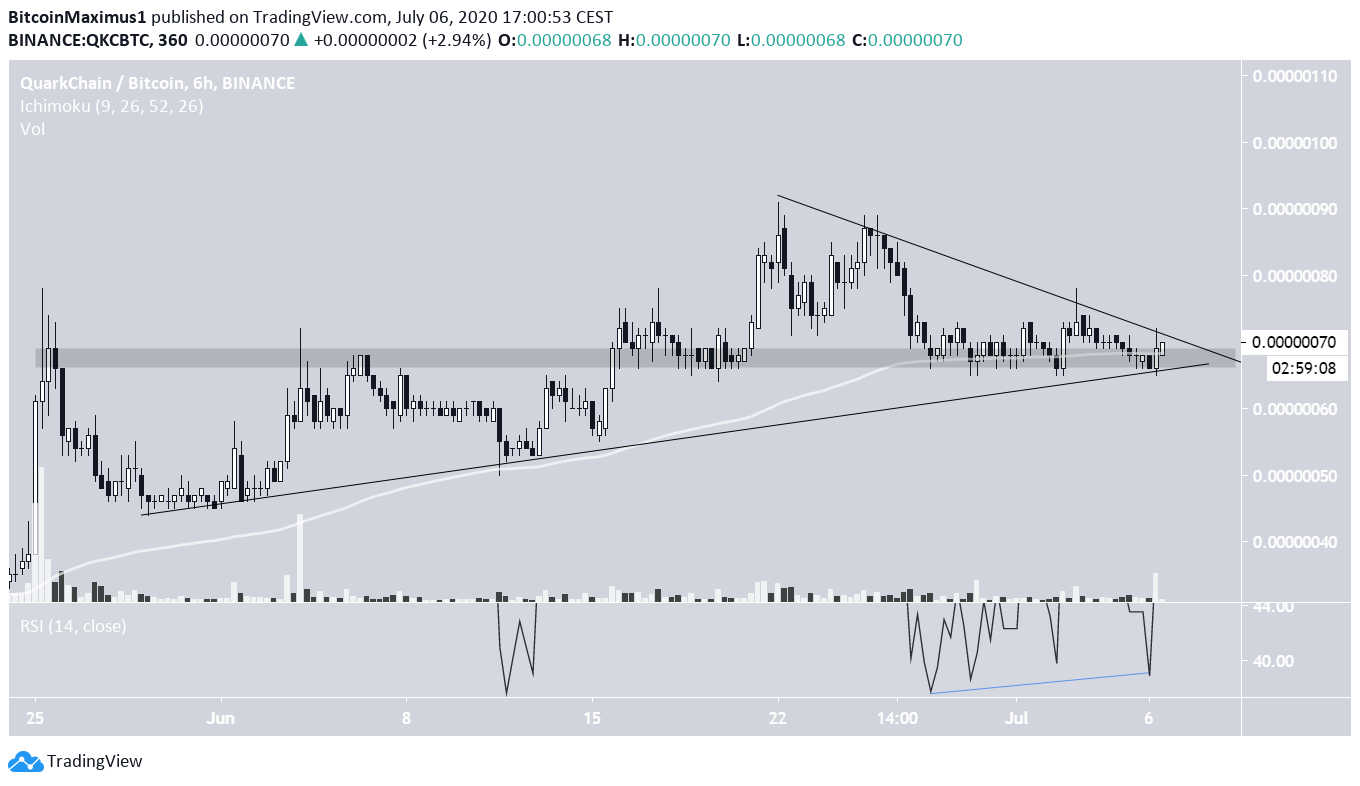
However, the descending wedge is not completely clear. It looks more like the price is following a descending resistance line, which combined with the aforementioned support line creates a symmetrical triangle. The end of the triangle is projected to occur after a few days, so a decisive movement in one or the other direction is expected.
Due to the confluence of support and the fact that the RSI has been generating bullish divergence, a breakout seems more likely.
Future Movement
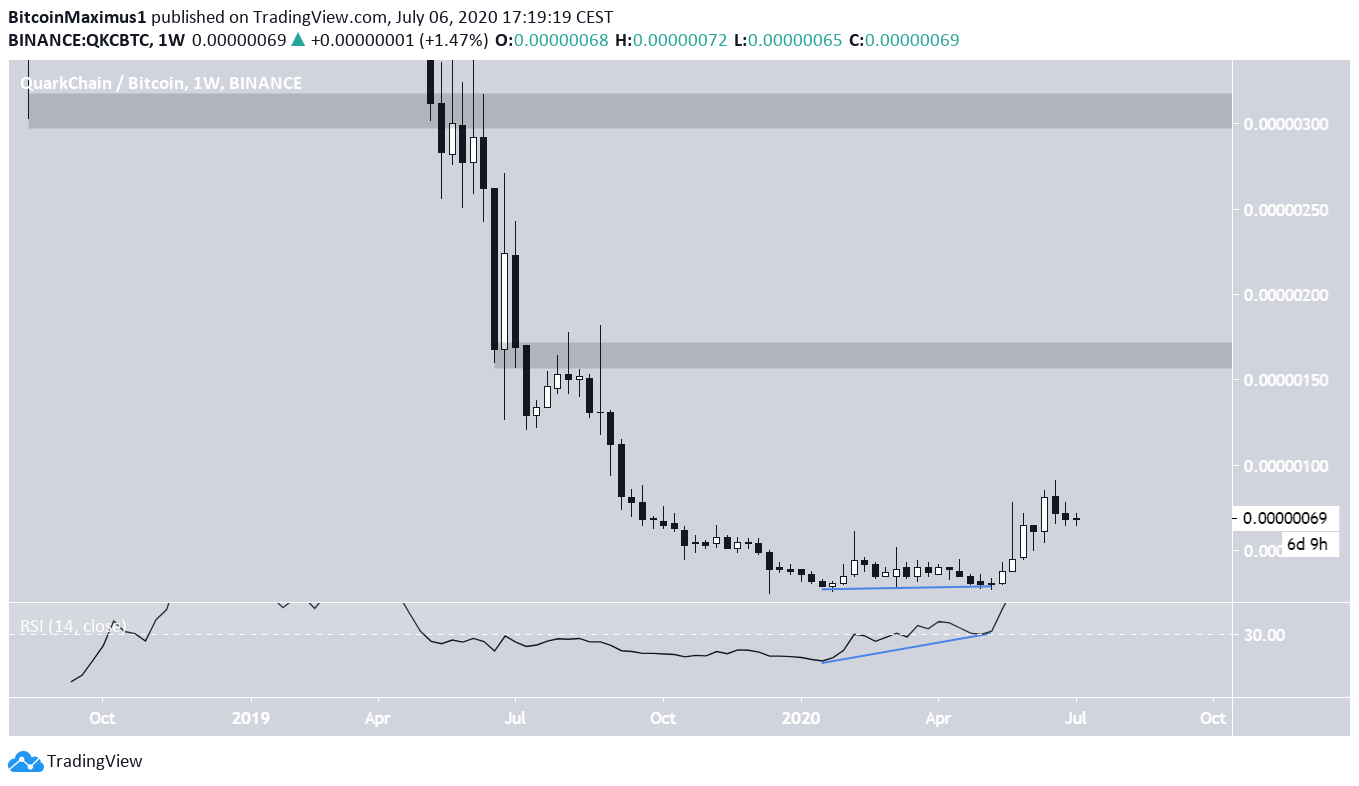
The long-term chart paints a similar, bullish picture. First, there is the double-bottom near 27 satoshis during a five-month period between January-May, which was also combined with a strong bullish divergence in the weekly RSI. This is a bullish reversal pattern that is often followed by price increases, which was the case for QKC.
However, such a long-term divergence often leads to a long-term move, so it is likely that the current move will continue, especially since its supported by lower time-frame readings.
Furthermore, there is a lack of resistance above the current price, with the closest resistance areas being found at 165 and 300 satoshis. Therefore, the price would be expected to increase at least until it reaches one of these areas.