The TROY (TROY) price has created a bullish reversal pattern inside a support area, indicating that it is likely to move upwards towards the current range high.
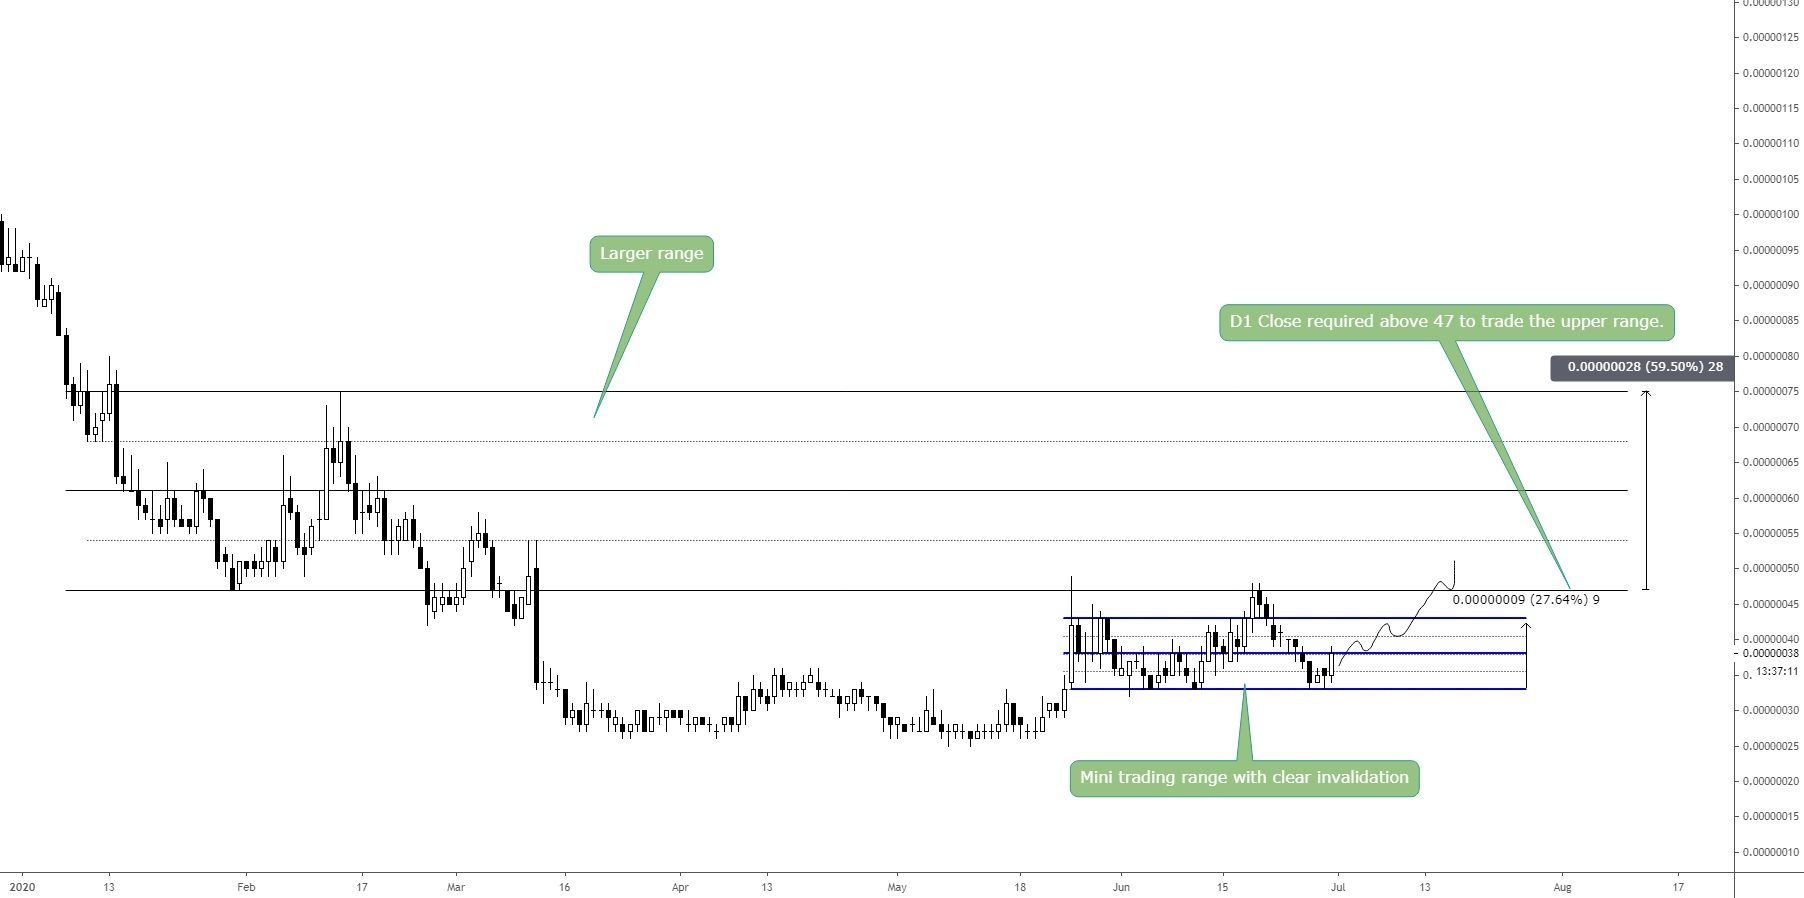
Cryptocurrency trader @TheEuroSniper outlined a TROY chart, in which a short-term range between 30-47 satoshis is outlined. He believes that a daily close above the latter would take the price all the way to 75 satoshis, which is 60% above the range high.
TROY Double-Top
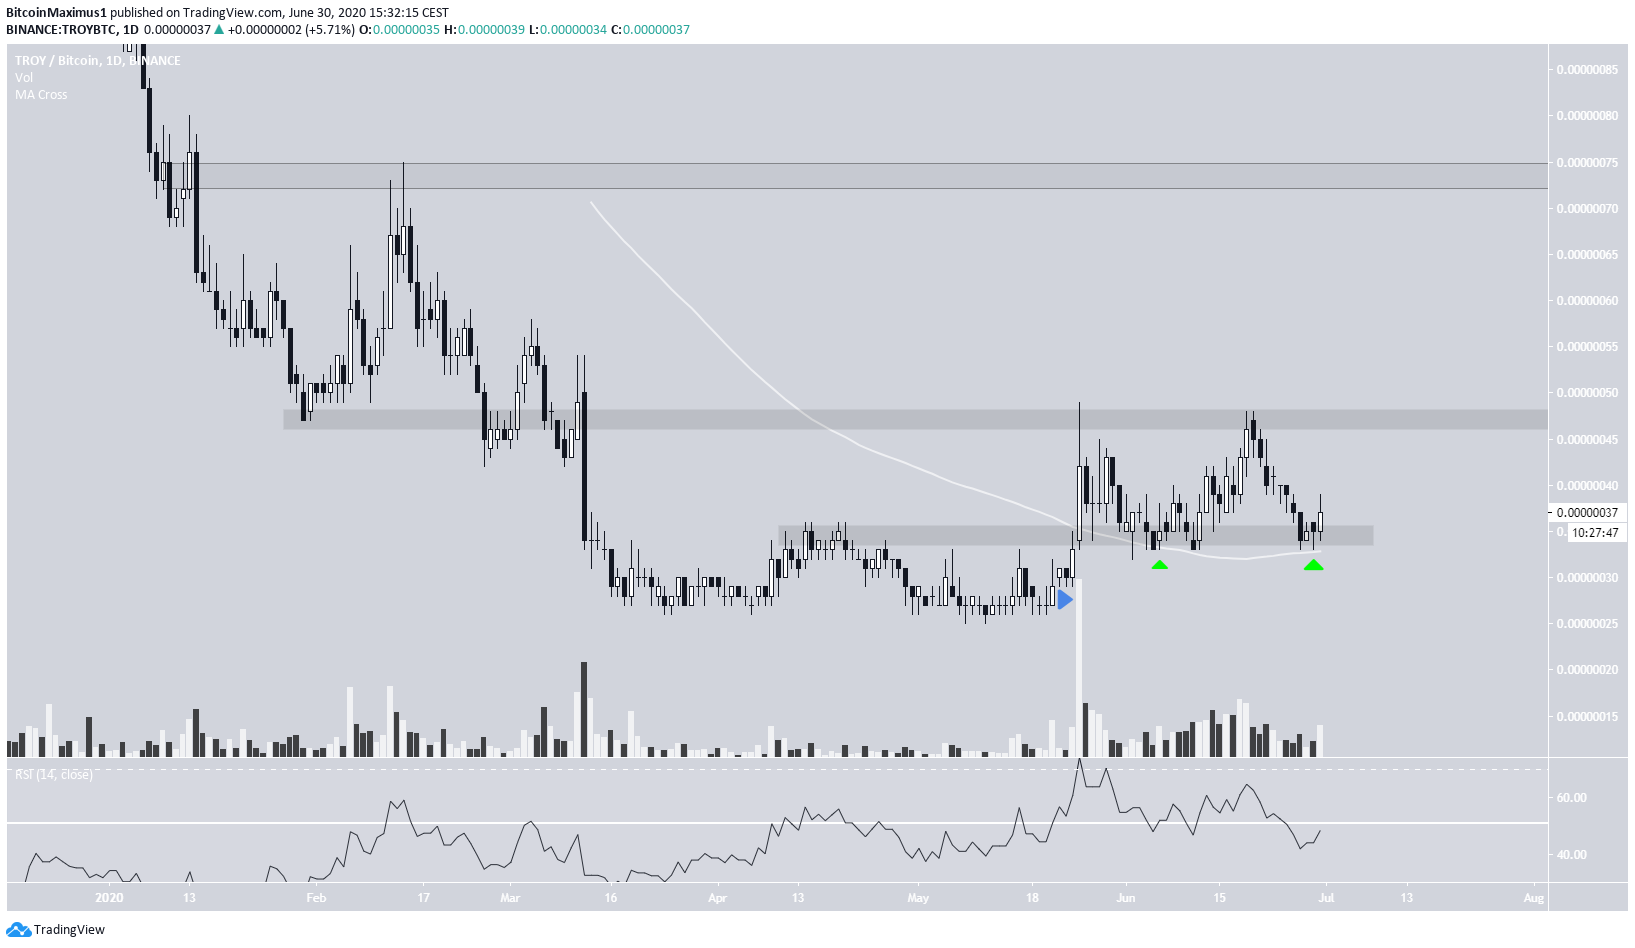
In the period between March and May 2020, the TROY price created a double-bottom at 25 satoshis. It followed this bullish reversal pattern with a strong breakout that showed considerable volume on May 25, reaching a high of 49 satoshis.
This movement validated the 49 satoshi area as resistance. The price revisited this same area on June 20, created a double-top, and has been decreasing since.
At the time of writing, the price was trading inside the 34 satoshi support area, which also coincides with the 100-day moving average (MA).
However, there are no signs of reversal yet, and the daily RSI is below 50, so it is not certain that TROY will bounce from the current level. If the price does break out, however, the closest resistance area would be found at 75 satoshis, fitting with that given in the tweet.
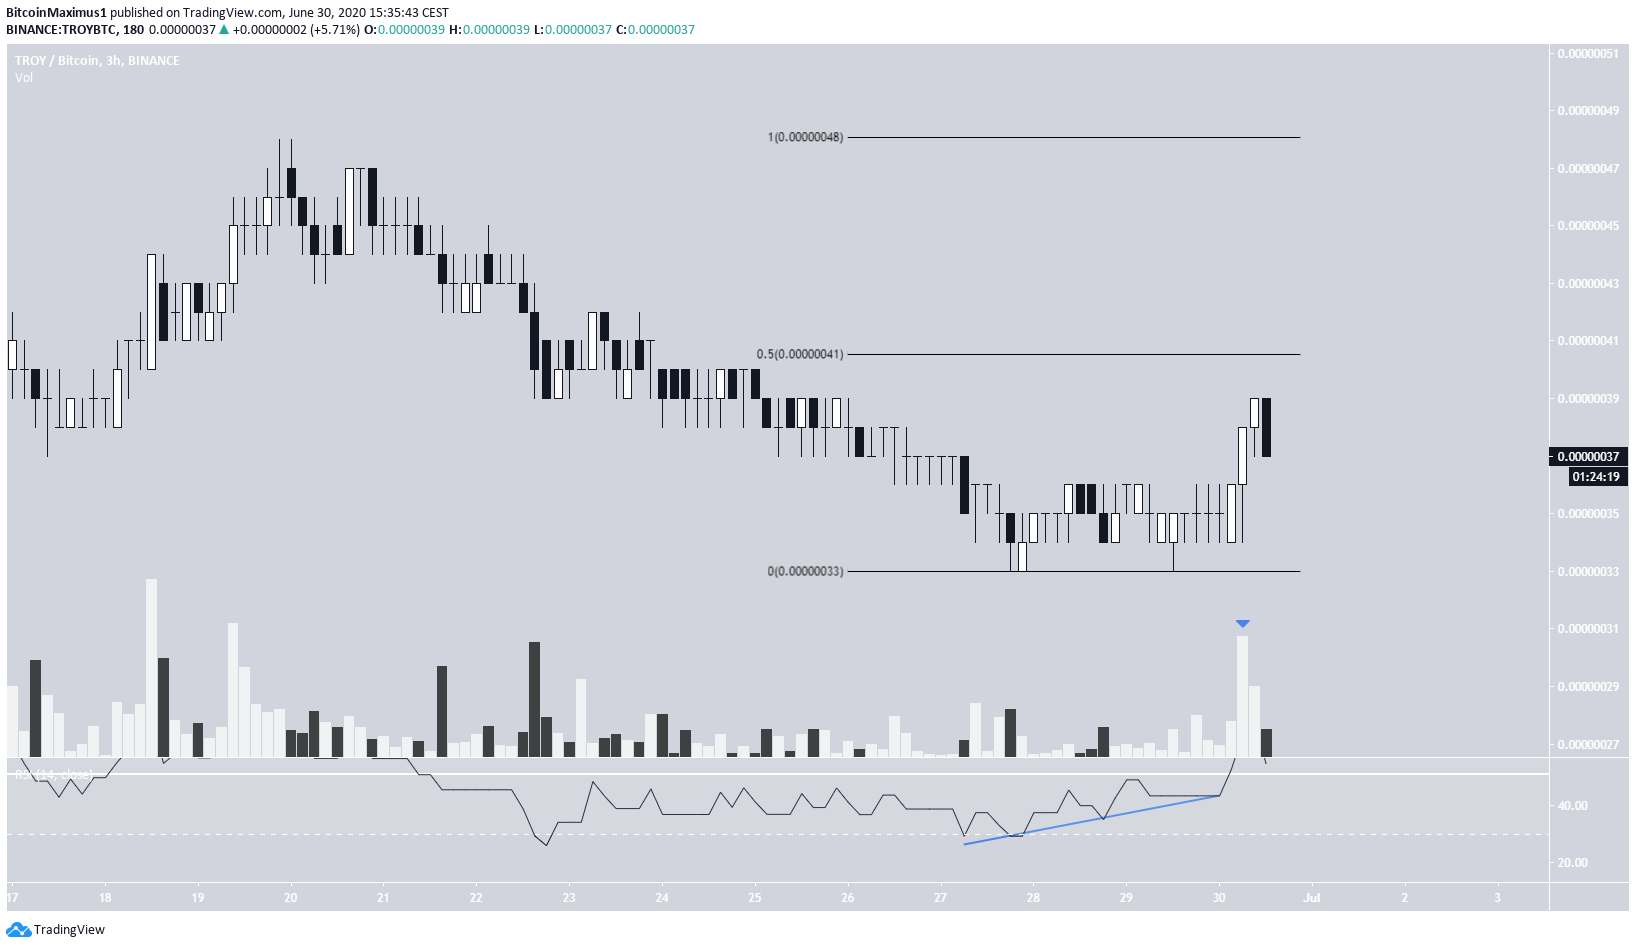
Short-Term Movement
In the short-term, TROY has made a double bottom, which has also been combined with bullish divergence. This is a bullish sign that suggests that the price will move upwards. Furthermore, there was a surge of volume during the most recent bullish candlestick, supporting the possibility of an upward movement.
The closest resistance area is found at 41 satoshis, the 0.5 Fib level of the entire previous decrease. If successful in moving above it, the price is likely heading for the range high at 49 satoshis.
At the time of writing, we cannot state with confidence whether the price will break out above this area or not.