
Solana “evaporated” nearly 20% in just 7 days, yet analysts see this as a golden opportunity to accumulate, as the RSI indicator has hit a rare oversold level.
History shows that each time SOL fell into this condition, the token bounced strongly — even rallying from $155 to $250 within just a few sessions. Could this explosive scenario repeat itself, putting SOL back on track to chase new highs?
SOL Oversold
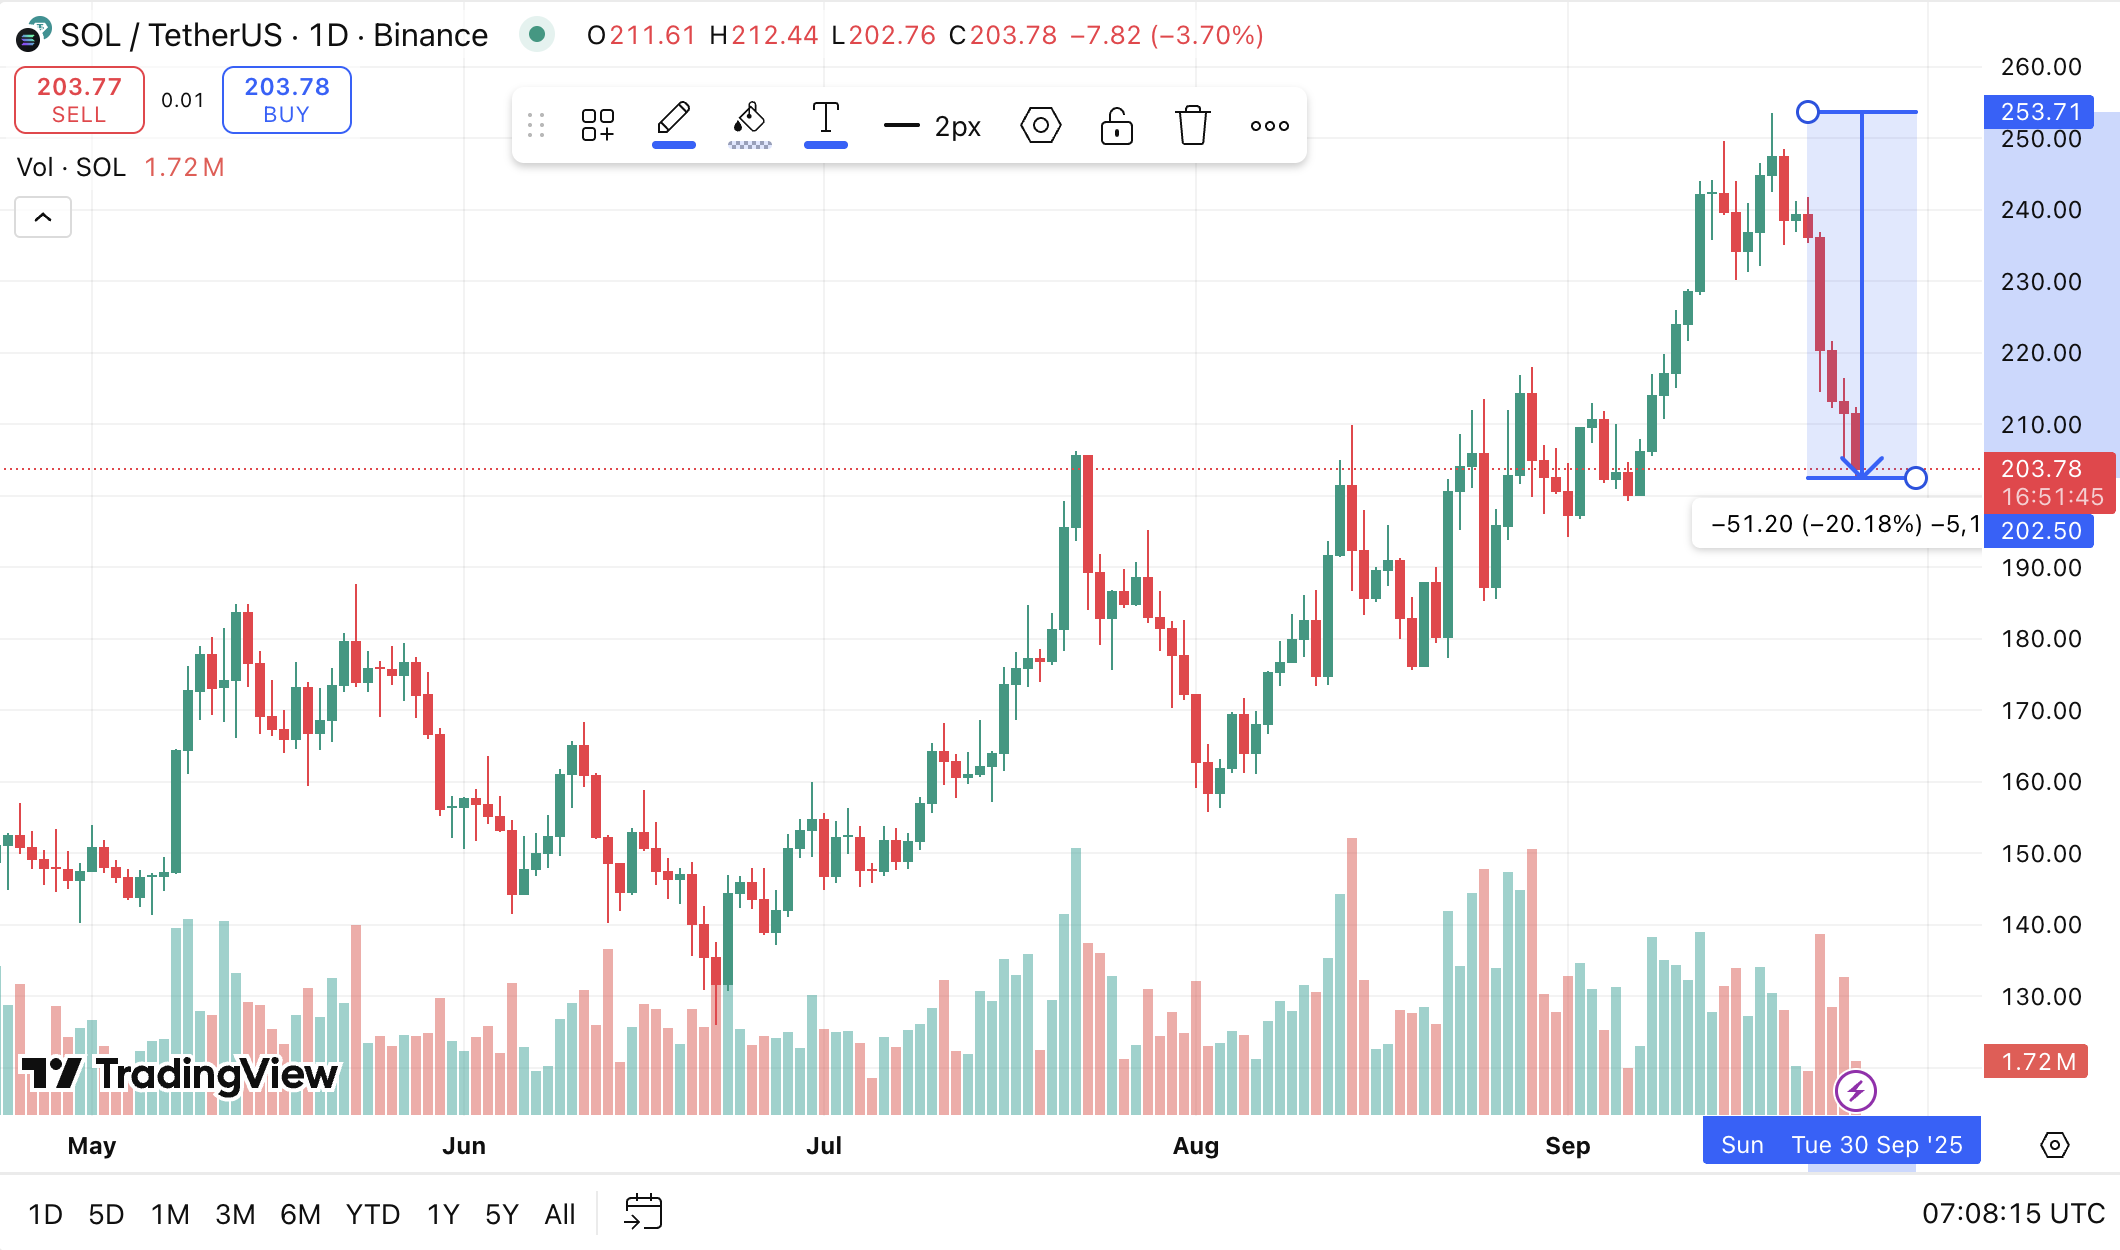
Solana (SOL) has experienced sharp volatility over the past seven days. According to BeInCrypto data, SOL is trading at $203,78, down 20.18% from its recent local top on September 18.
Against this backdrop, looking at SOL’s price action across multiple time frames shows intense selling pressure. However, technical signals also suggest the token is oversold. This has led many analysts to question whether the recent drop is opening up a bottom-fishing opportunity. Alternatively, they wonder if it’s merely a “fakeout” within the broader trend.
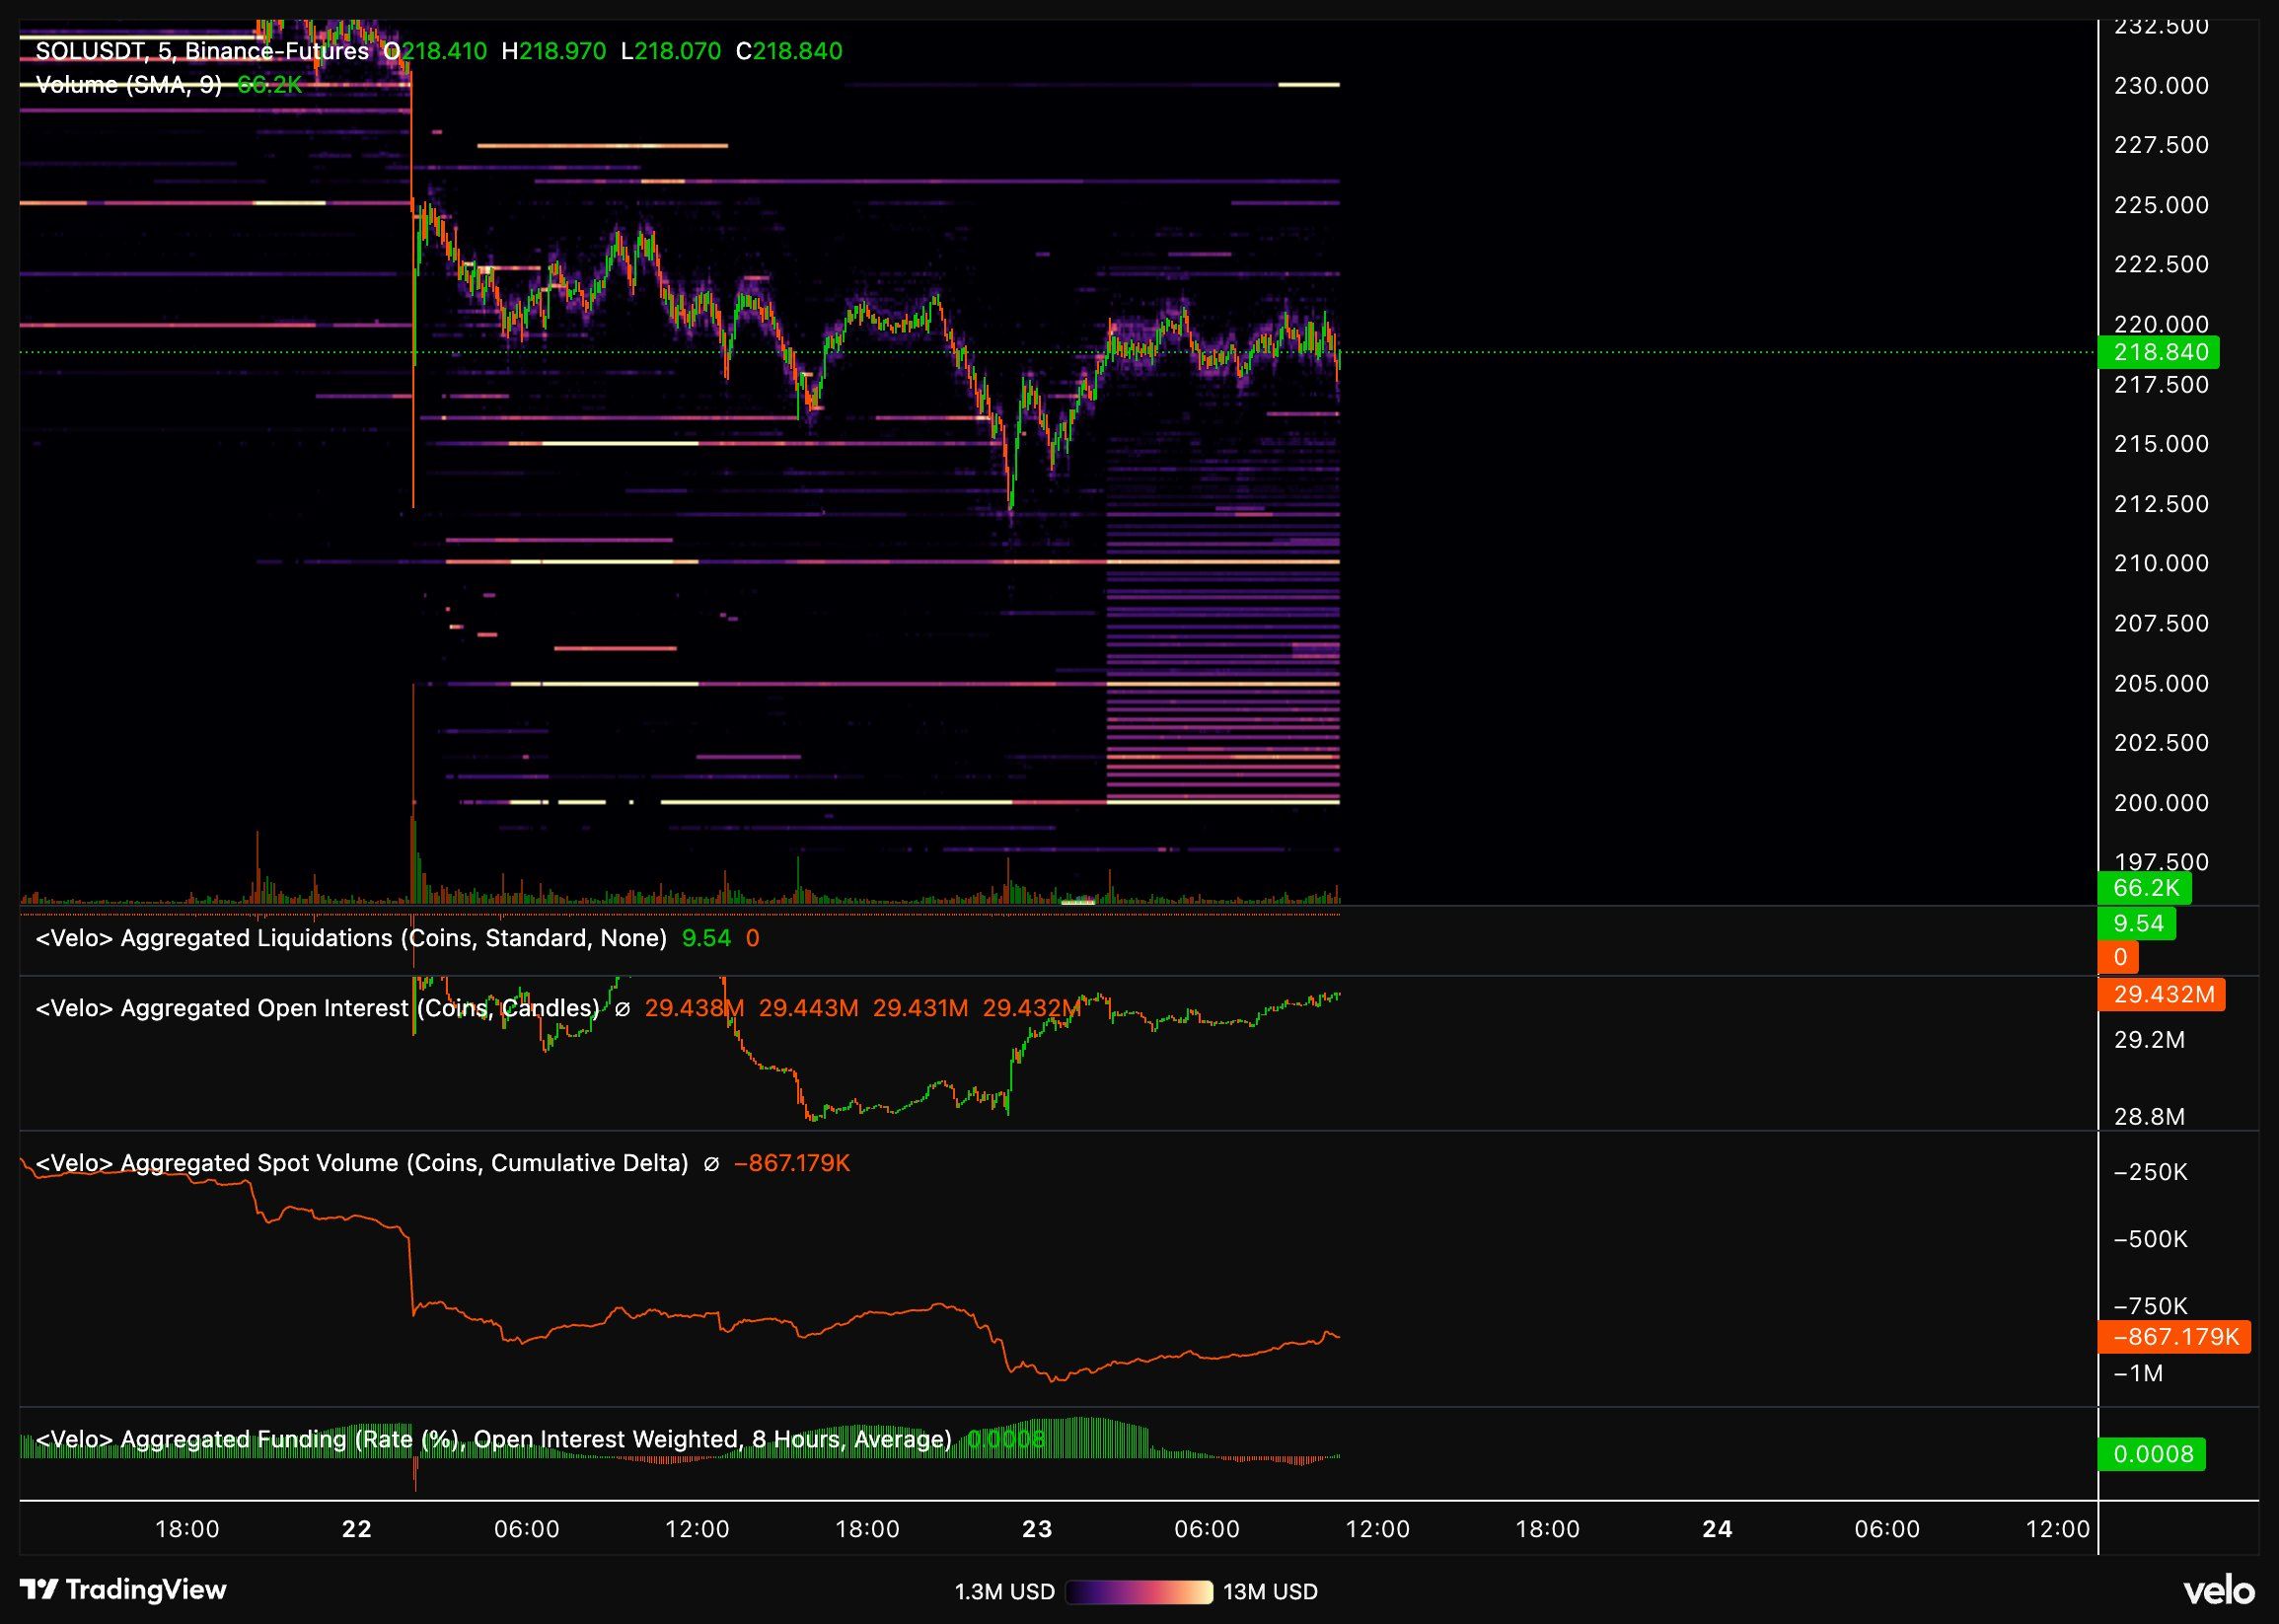
On the 4-hour chart, some traders observed that SOL has touched channel support while the Relative Strength Index (RSI) signals oversold conditions. Similar oversold setups have also been spotted on the 5-hour and 12-hour charts, often preceding technical bounces.
“$SOL is disgustingly OVERSOLD, in fact, the last time the 12 hour was this oversold, price pumped from $155 to $250,” one trader noted.
Another trader pointed out an interesting signal on the 12-hour chart: “layered bids” from the ~$200 region upward. This could be a critical threshold to watch before considering large position entries. At current prices, SOL is only about $3 away from this zone.
Daily and weekly charts have not yet given the bulls a green light. Daily analyses warn that SOL needs to reclaim key levels such as $216 — or at least hold $172 in a more optimistic scenario — to resume its push toward all-time highs. On the weekly chart, many traders consider a retest into the $190–$175 region an “ideal” setup, suggesting the market may continue to chop before forming a sustainable bottom.
Beyond technicals, fundamentals and on-chain data also play a crucial role. As BeInCrypto reported, a recent $315 million accumulation wave helped absorb selling pressure and laid the groundwork for a potential rebound. At the same time, institutional inflows and infrastructure upgrades provide long-term tailwinds for SOL. A CoinGecko report shows that public companies are starting to hold Solana, not just Bitcoin.
However, another BeInCrypto analysis highlighted that a wave of long liquidations in derivatives markets could trigger another test of the $200 zone if confidence falters. Investors must closely monitor on-chain flows and SOL’s reaction at key price levels. Historically, Solana has shown both rapid pumps and sharp pullbacks. Hence, risk management remains the ultimate determinant for navigating the current market.
