Highlights
- THETA is trading inside a descending wedge.
- It has moved above its 200-day moving average.
- There is significant support at 950 satoshis.
- There are resistance zones at 1,350 and 1,550 satoshis.
$THETA
— Devchart 👨🏻💻 (@devchart) January 29, 2020
Let's see if we can get some quick scalps at least from #THETA
1D TF
Support on the 200 MA + Horizontal support
4H TF
Possible bullish divergence
Invalidation if it closes below the 200 MA on the daily timeframe. pic.twitter.com/4wE7FPMEZc
THETA’s Fall From Grace
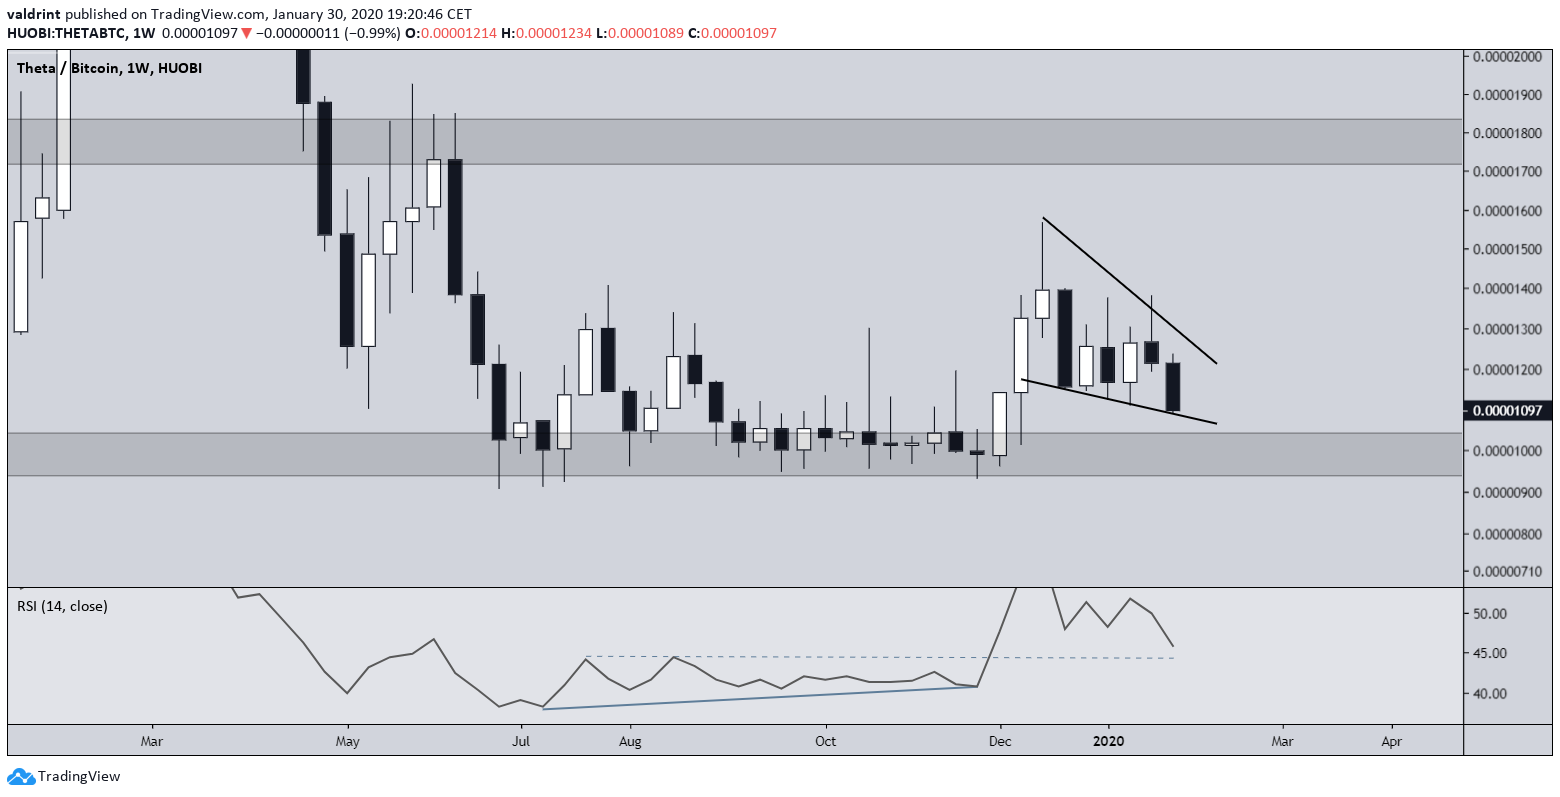
The THETA price has been consolidating between 1,000 and 1,800 satoshis since July 2019. The support area represents an all-time low since the price has never traded below it. The price traded very close to it for 168 days before initiating an upward move, from which it is currently retracing. A similar movement transpired in 2018 when the price consolidated inside this same area for 175 days and then broke out afterward. However, that breakout was much stronger since the price eventually increased all the way to its all-time high of 4,599 satoshis. Since July 2019, the weekly RSI for THETA began to generate bullish divergence and completed a failure swing bottom afterward. This caused the price to initiate the aforementioned upward move, from which it is currently retracing.
The price has been decreasing since Dec 19, doing so in the form of a descending wedge.

Descending Wedge
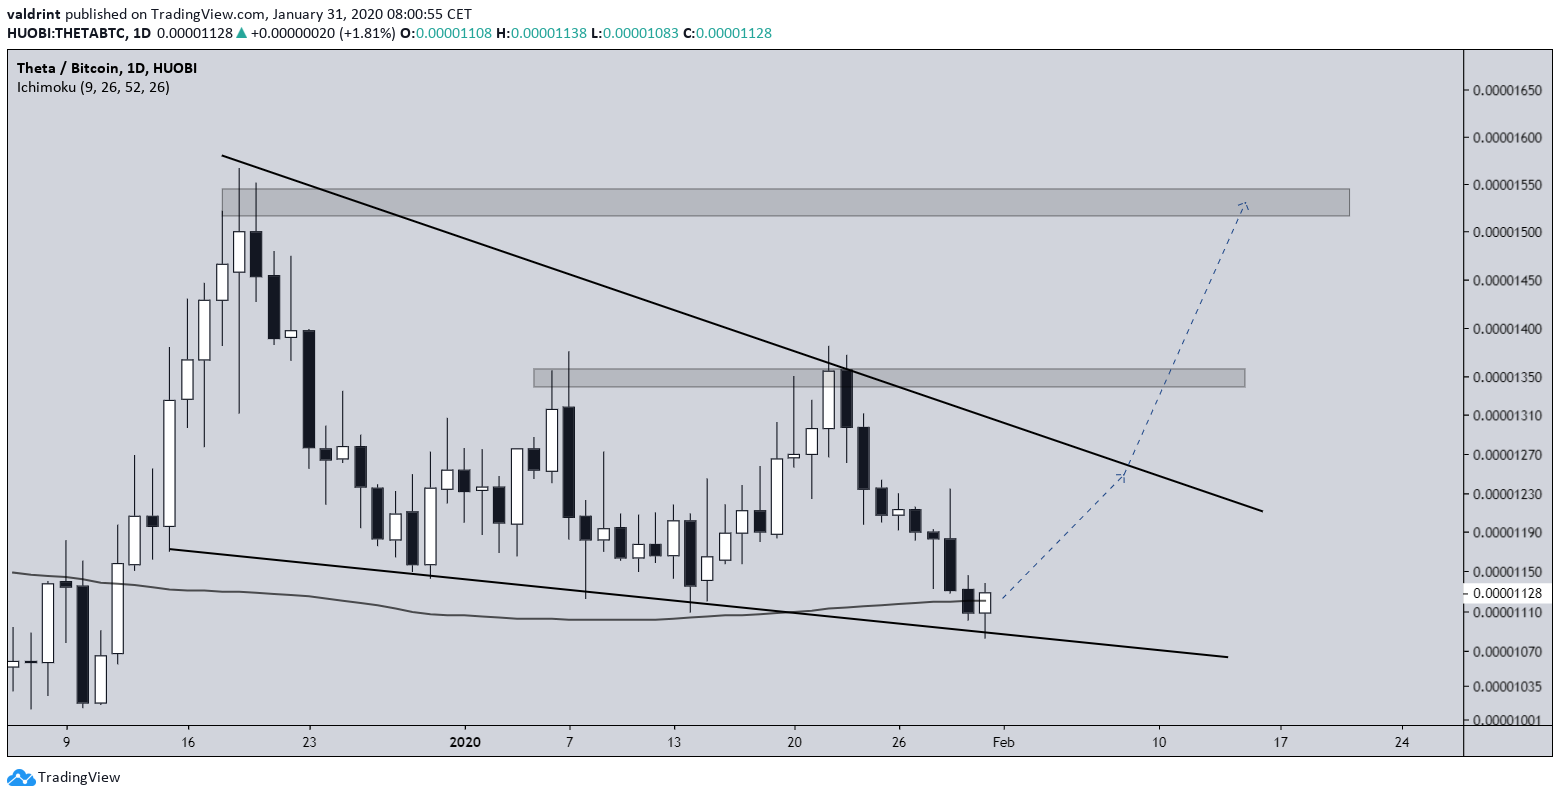
The price is trading very close to the support line of this wedge. It has also found support at the 200-day moving average (MA), creating a lower wick once it reached it. The other times the price has done so, it has begun upward moves towards the resistance line. As long as the price stays above the 200-day MA, it should begin to climb again soon. If the price breaks out, minor resistance areas would be found at 1,350 and 1,550 satoshis. To conclude, the THETA price is trading inside a descending wedge. A breakout of this wedge could take the price towards the 1,350 and 1,550 satoshi resistance zones.
Disclaimer
In line with the Trust Project guidelines, this price analysis article is for informational purposes only and should not be considered financial or investment advice. BeInCrypto is committed to accurate, unbiased reporting, but market conditions are subject to change without notice. Always conduct your own research and consult with a professional before making any financial decisions. Please note that our Terms and Conditions, Privacy Policy, and Disclaimers have been updated.


