Both Reserve Rights (RSR) and TRON (TRX) have broken out from long-term descending resistance lines — possibly indicating that they have begun bullish trends.
Reserve Rights (RSR)
The descending resistance line and break out for RSR were outlined by cryptocurrency trader @PostyXBT, who stated that :
Finally we get a clean breakout[.] A daily close above green would be ideal, but a lot to ask for [in my opinion.]
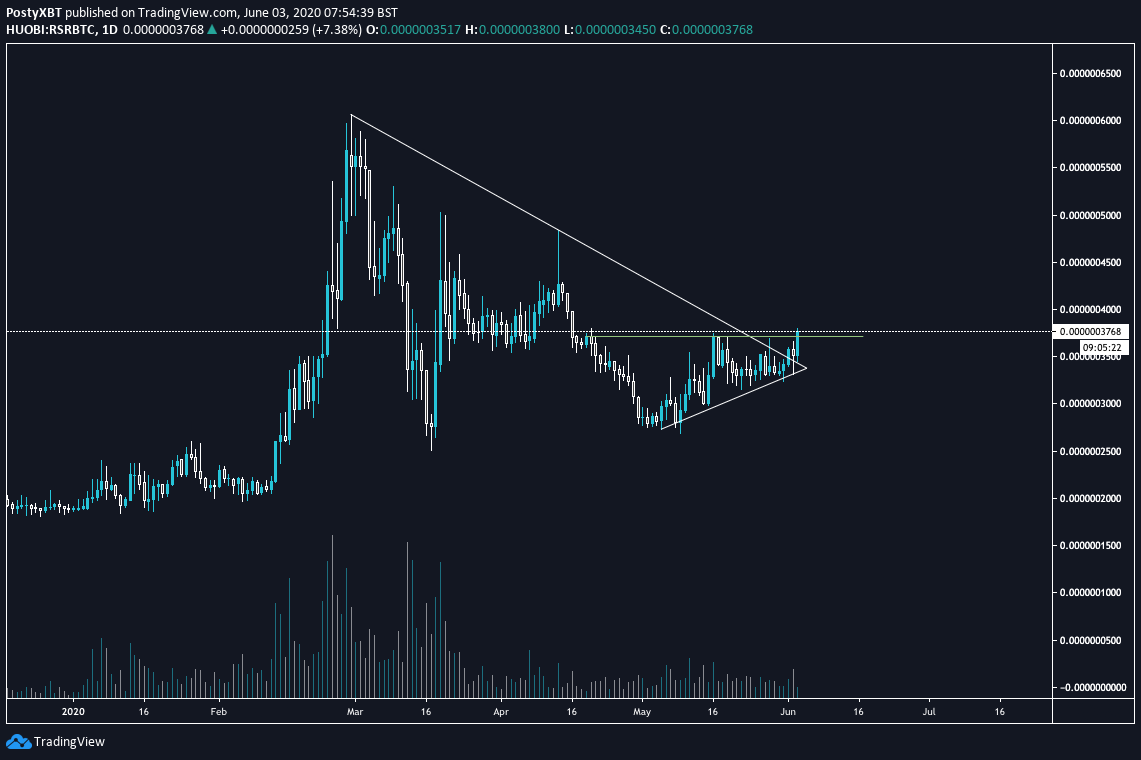
Indeed, RSR has broken out from a long-term descending resistance line and has flipped the 36 satoshi level as support.
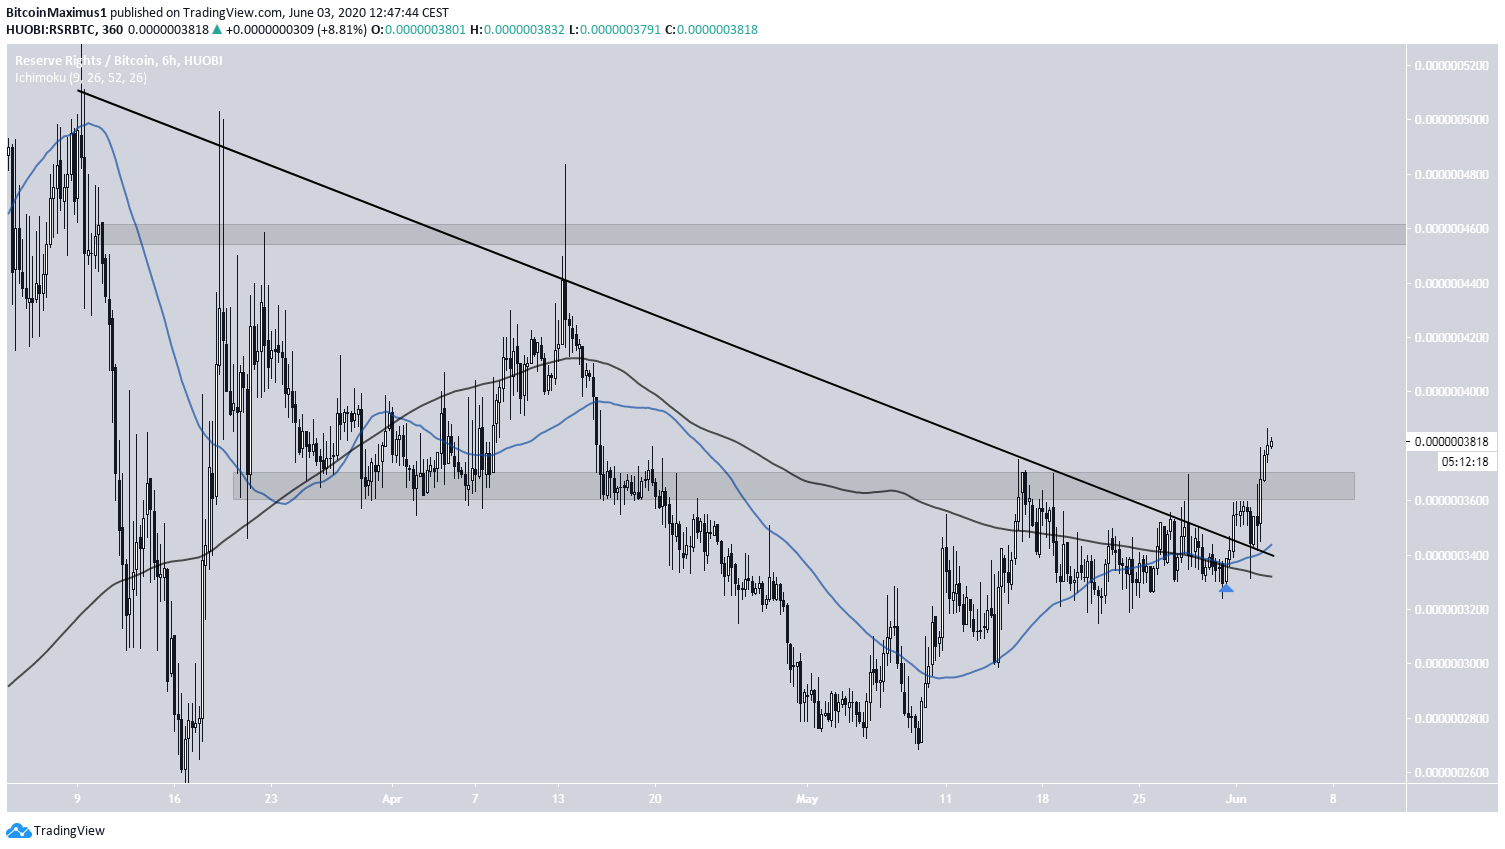
Additionally, a bullish cross has transpired between the 50- and 200-period moving averages (MAs), supporting the possibility that a bullish trend has already begun.
If the price continues to move upwards, which is looking likely, the closest resistance level is found at 46 satoshis.
TRON (TRX)
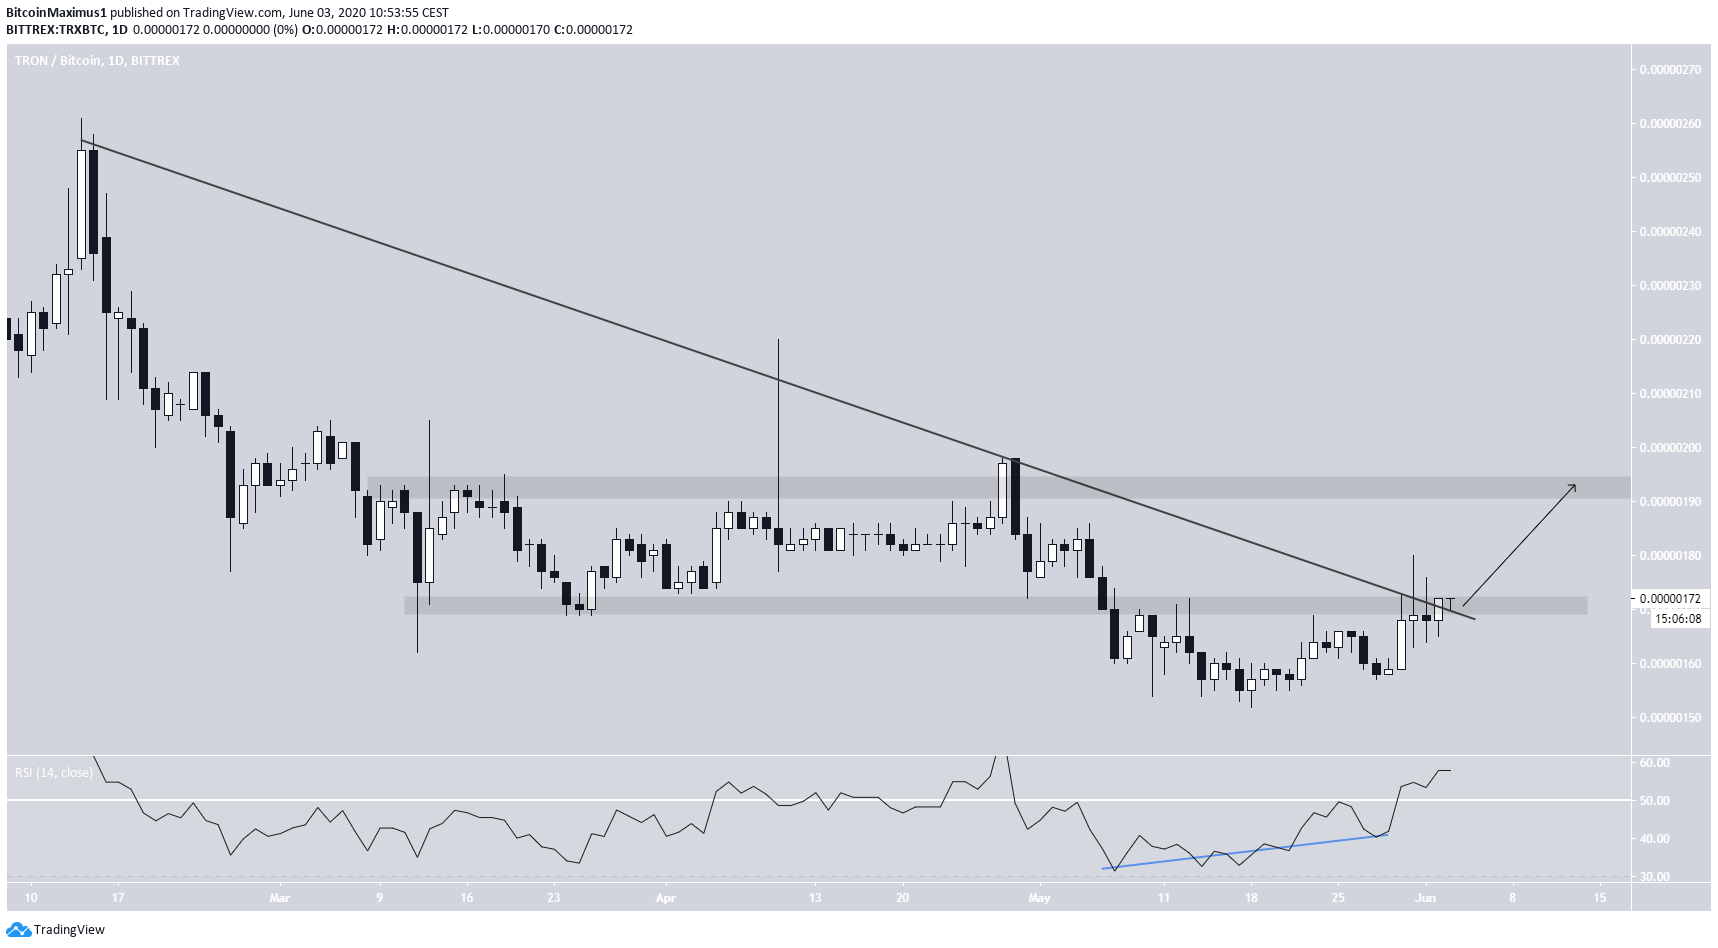
One coin that has not yet broken out but is in the process of doing so is TRON (TRX). The price has been following a descending resistance line since February 14. At the time of writing, the price was attempting to break out from this resistance line for the fourth time. Furthermore, the price was facing resistance from the 172-satoshis horizontal area.
However, the RSI shows a growing bullish divergence, which indicates that the price will break out. Also, yesterday’s daily close was the highest since May 4, slightly above this descending resistance line.
If the price breaks out, the next resistance level is found at 195 satoshis.
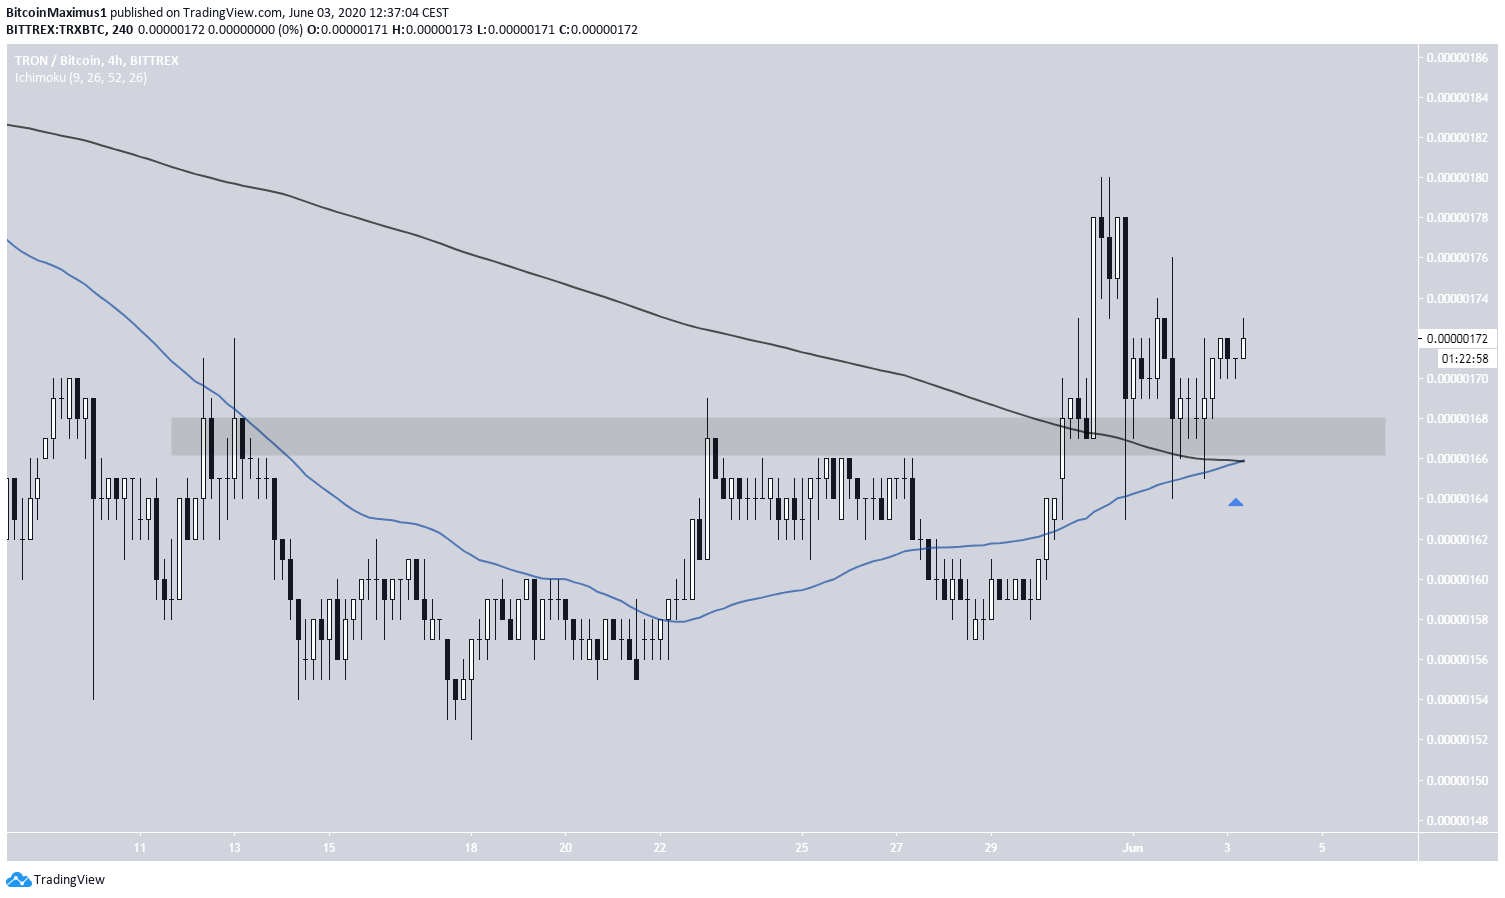
The short-term chart supports this possible increase. TRX has successfully flipped the 168 satoshi level as support and has created numerous long lower wicks.
In addition, there is an impending bullish cross between the 50- and 200-hour moving averages (MAs), a sign that a bullish trend has begun and the price is likely to continue moving upwards.