


NOIA Network (NOIA) has been rapidly moving up but has generated some bearish divergence and could soon begin to correct.
Cartesi (CTSI) has broken out from an important resistance level and validated it as support afterward. As long as the price is trading above it, the trend is considered bullish.
NOIA Network (NOIA)
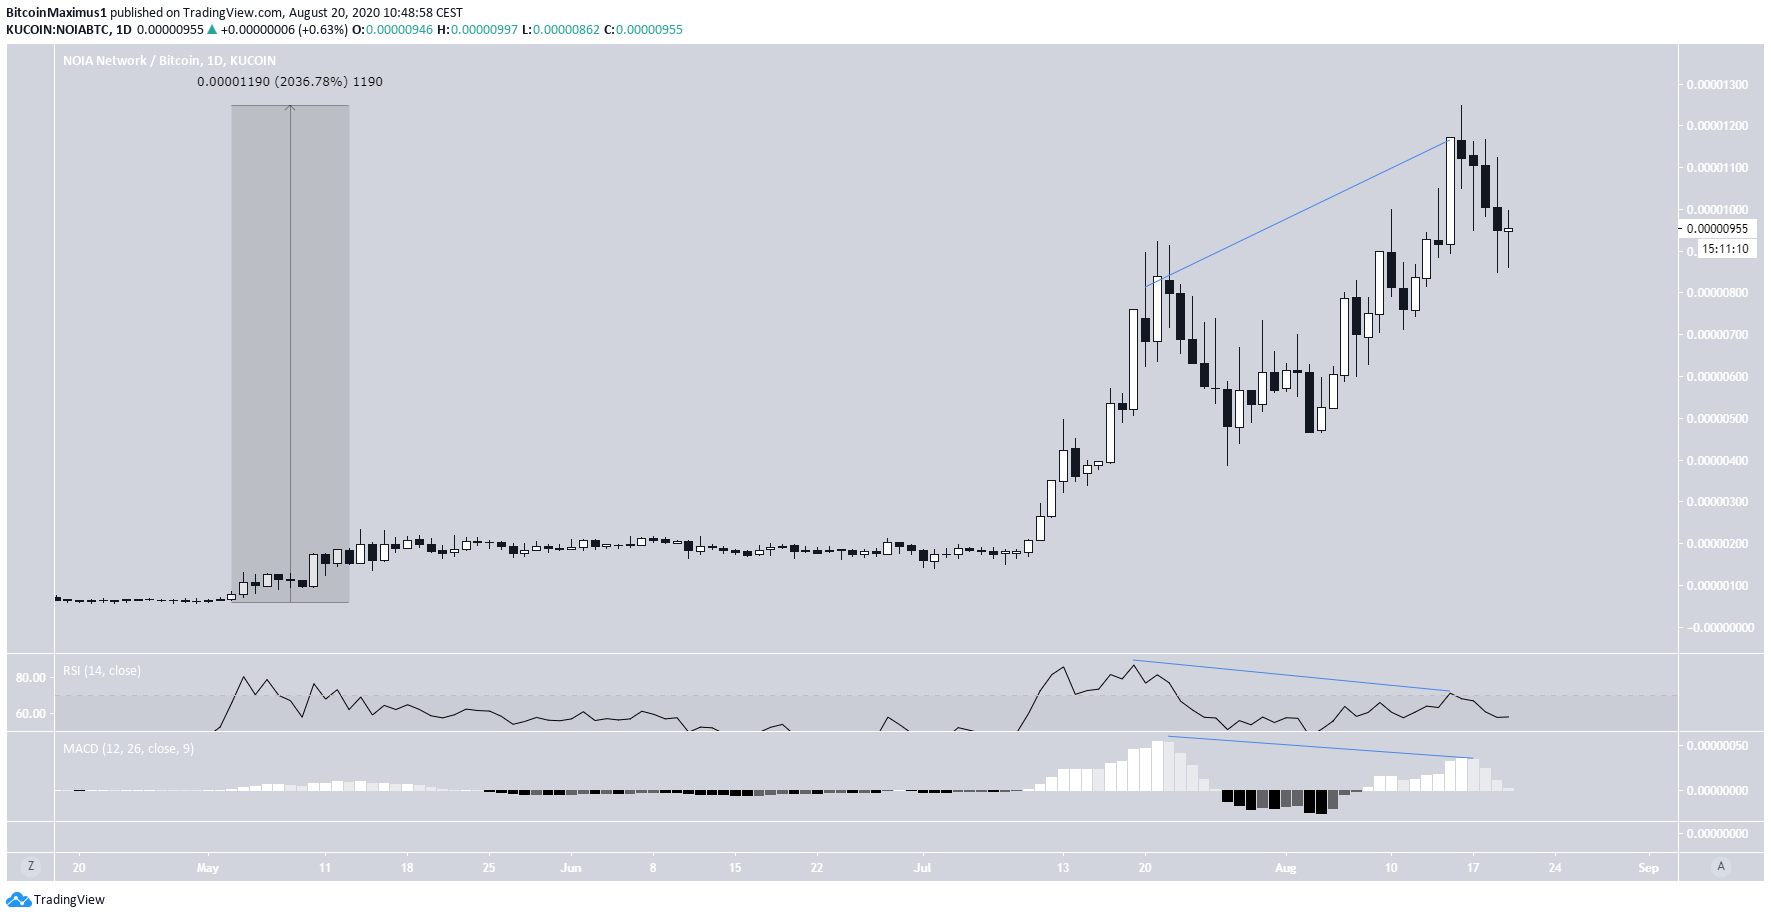
The NOIA Network price has been increasing since May 3, topping out at 2,000% when it reached a high of 1,249 satoshis on Aug 16.
However, there is a considerable bearish divergence building in both the RSI and MACD, a sign that the price has likely reached or is close to reaching a top.
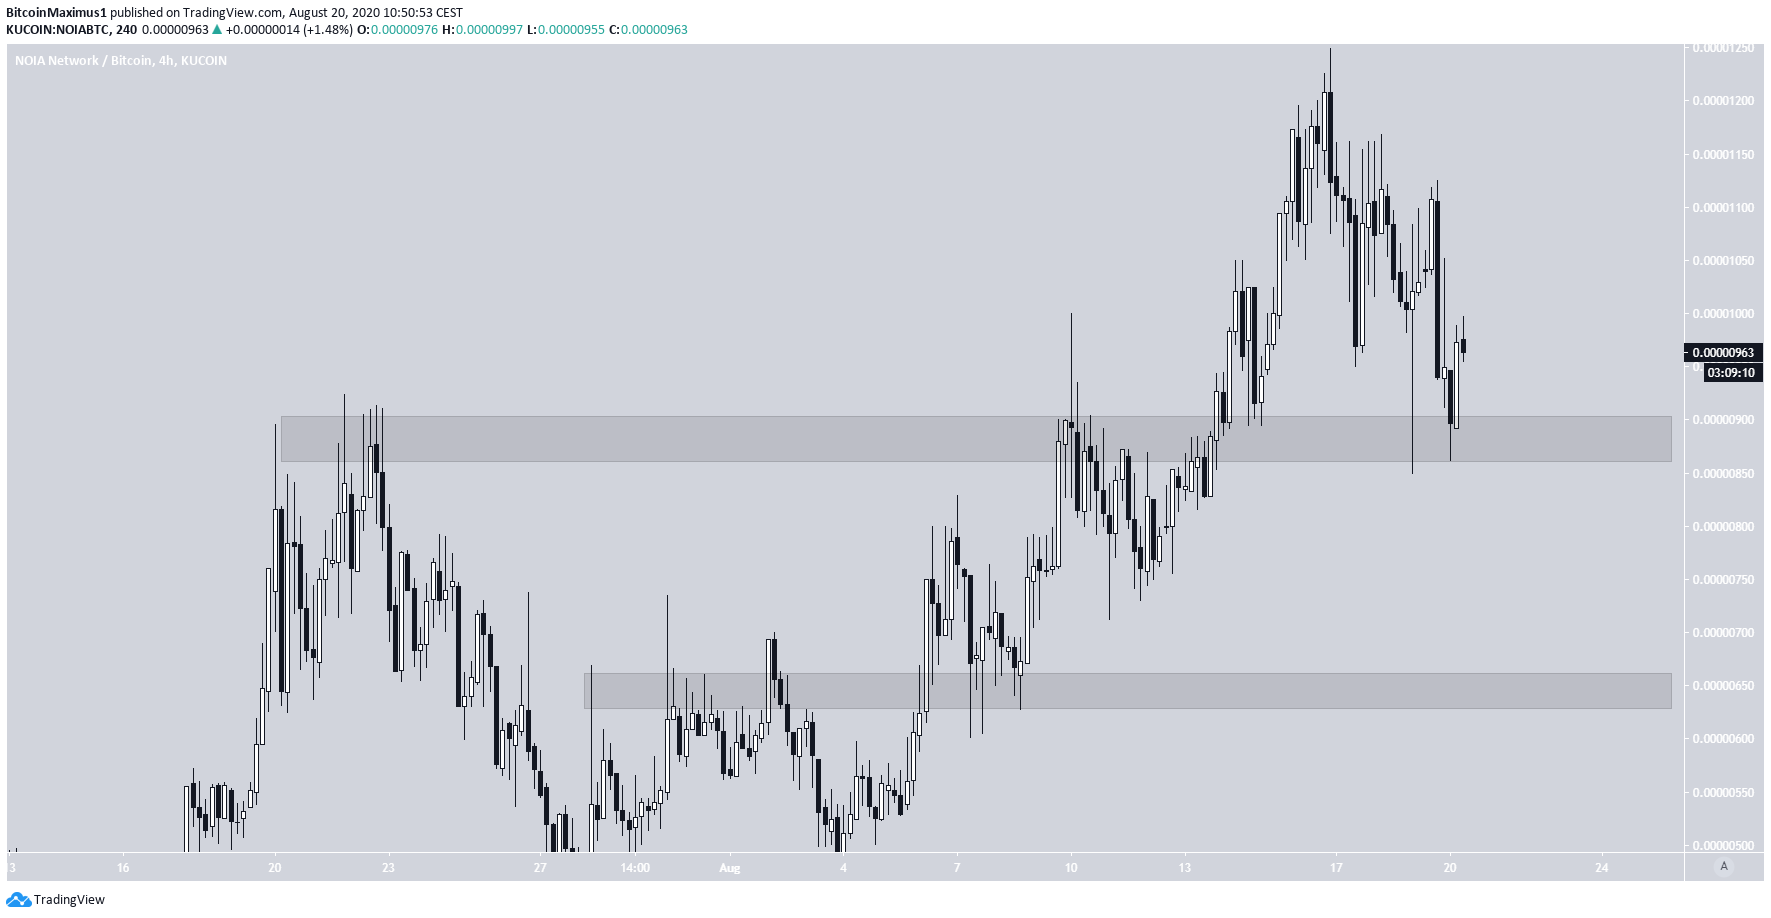
The shorter-term chart reveals that the price is attempting to hold on to the 880 satoshi support area. A breakdown from this area could take the price towards the next support at 650 sats.
Cryptocurrency trader @Bitcoin_brown stated that the weekend will belong to NOIA and CTSI. Since NOIA looks a bit bearish, we’ll switch gears for the next one and analyze Cartesi (CTSI).
Cartesi (CTSI)
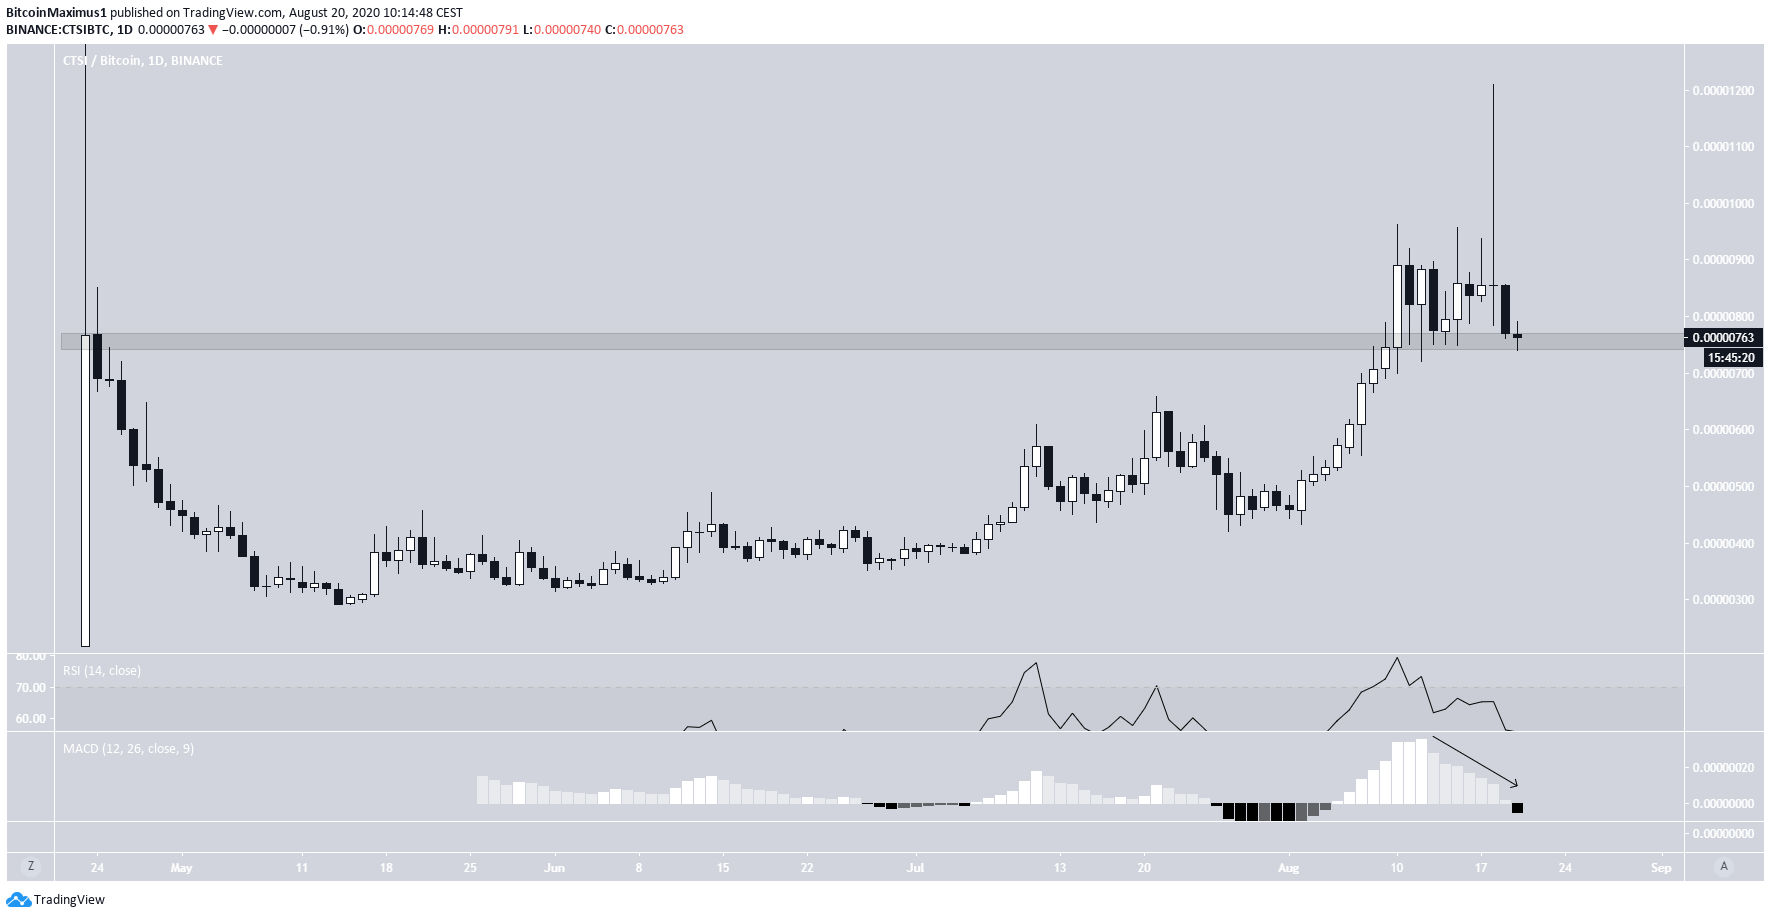
On Aug 10, CTSI broke out from the 760 satoshi area, which until that point had been the highest closing price. While it has been decreasing since then, it looks to be validating this previous level as support.
As long as the price is trading above 760 satoshis, the trend is considered bullish.
Technical indicators are neutral, leaning towards bearish. The MACD has crossed into negative territory, but there is no bearish divergence in the MACD or RSI.
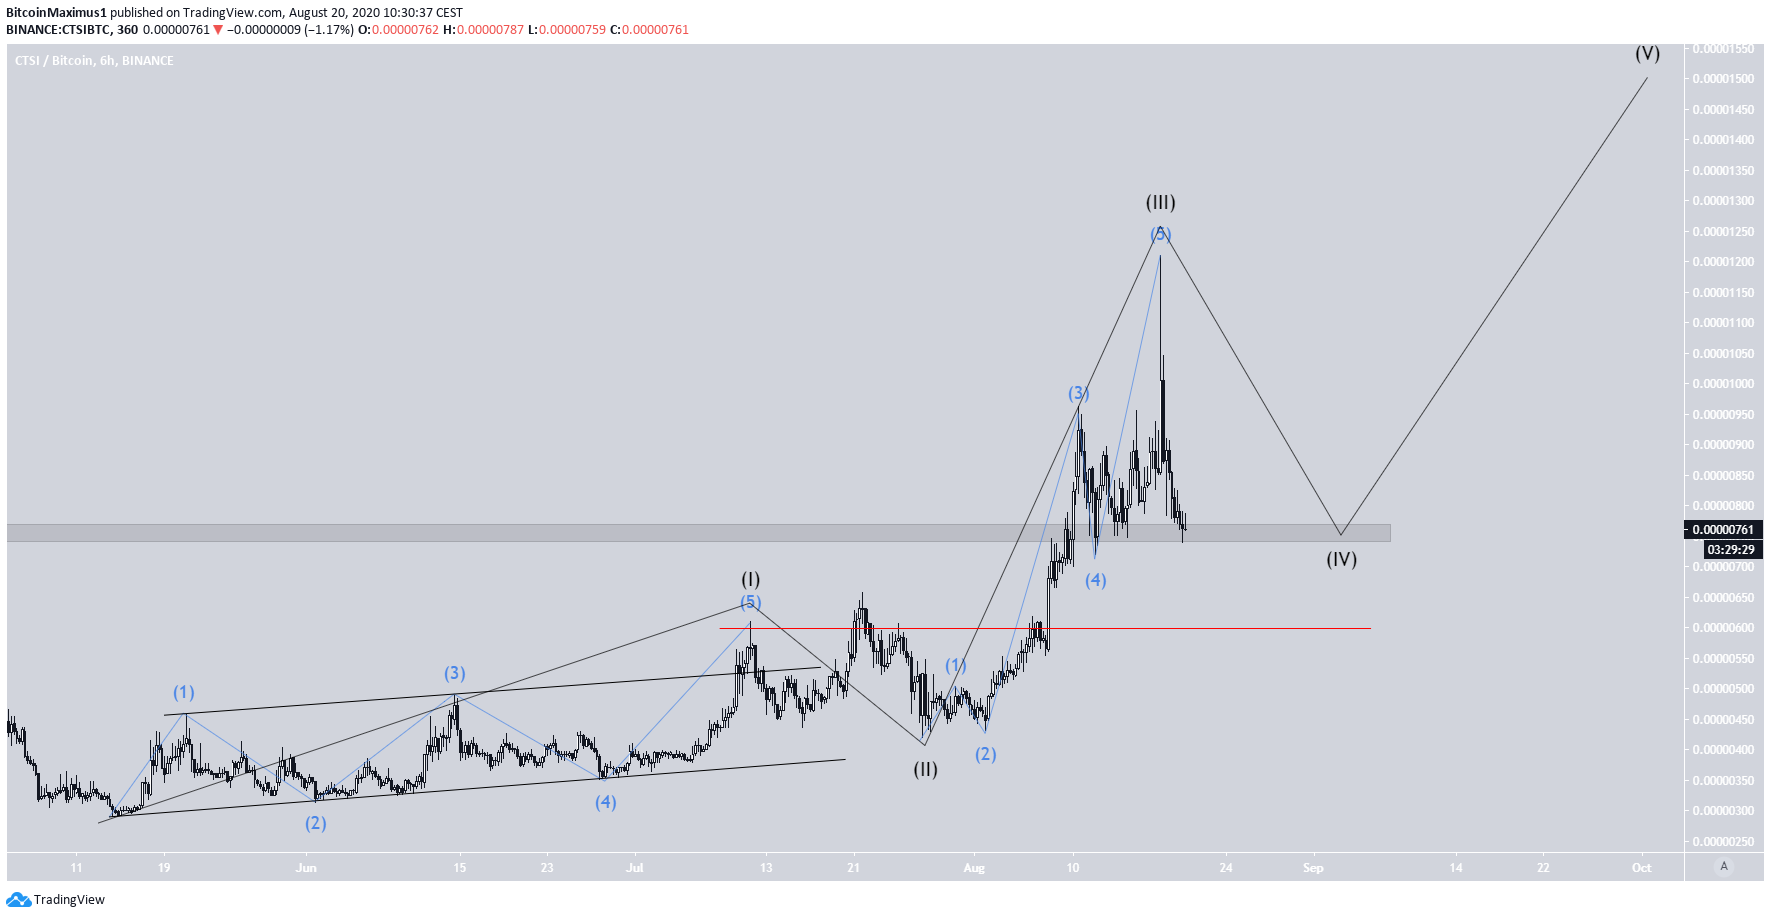
Since the upward movement began, the CTSI price seems to have completed four waves (black), with a fifth wave expected to materialize soon.
If the price manages to hold on to the 760 satoshi area, it could soon begin an upward move. The wave count would be invalidated with a decrease above the wave 1 high at 595 satoshis.
There are, however, no reversal signs or technical indicators that would suggest the price will move upwards at this point in time.
For BeInCrypto’s latest Bitcoin analysis, click here!


