


BeInCrypto looks at five altcoins that increased the most from the entire crypto market last week, specifically from Dec. 16 – 23.
These digital assets have taken the crypto news and crypto market spotlight:
- BinaryX (BNX) price increased by 21.26%
- XDC Network (XDC) price increased by 10.23%
- Radicle (RAD) price increased by 5.61%
- iExec RLC (RLC) price increased by 5.54%
- Toncoin (TON) price increased by 0.97%
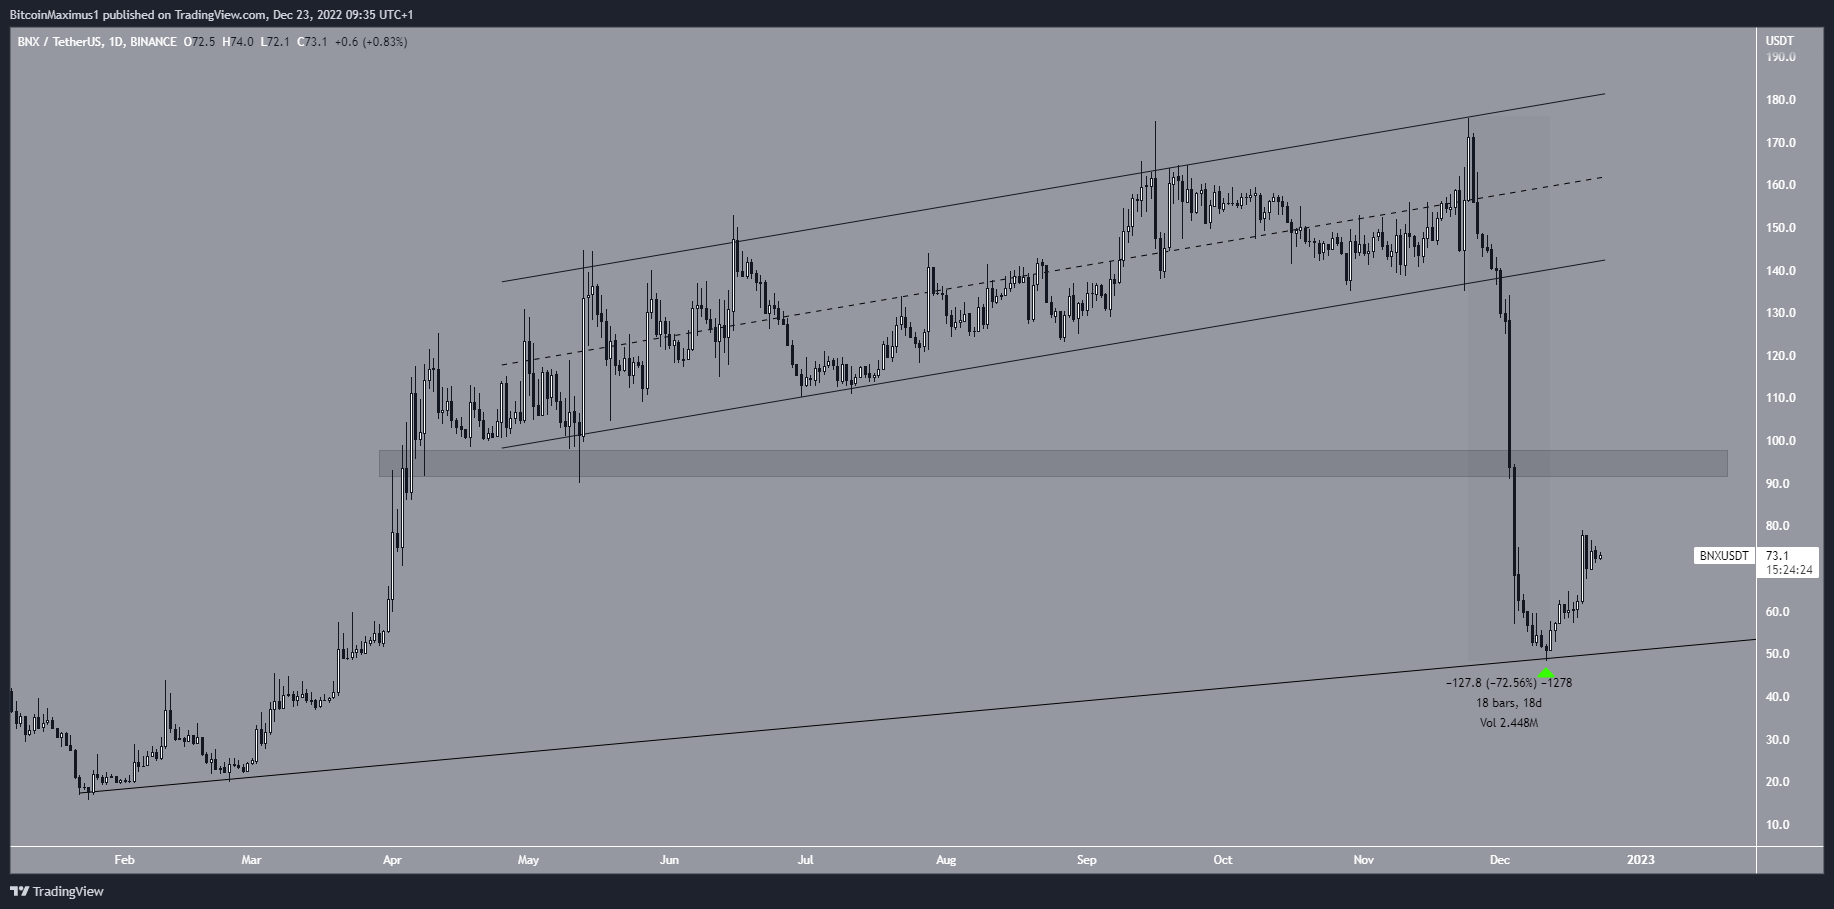
BNX Leads Altcoins Rally
The BNX price has fallen since reaching a high of $175.60 on Nov. 24. Five days later, it broke down from an ascending parallel channel and accelerated its rate of decrease. This led to a low of $48.40 on Dec. 11, a 72% drop in only 18 days.
However, the BNX price bounced afterward, validating a long-term ascending support line (green icon) that has been in place since Jan. 2022.
If the upward movement continues, the closest resistance area would be at $95.
Whether the BNX price reclaims this area or breaks down from the ascending support line will likely determine the direction of the future trend.
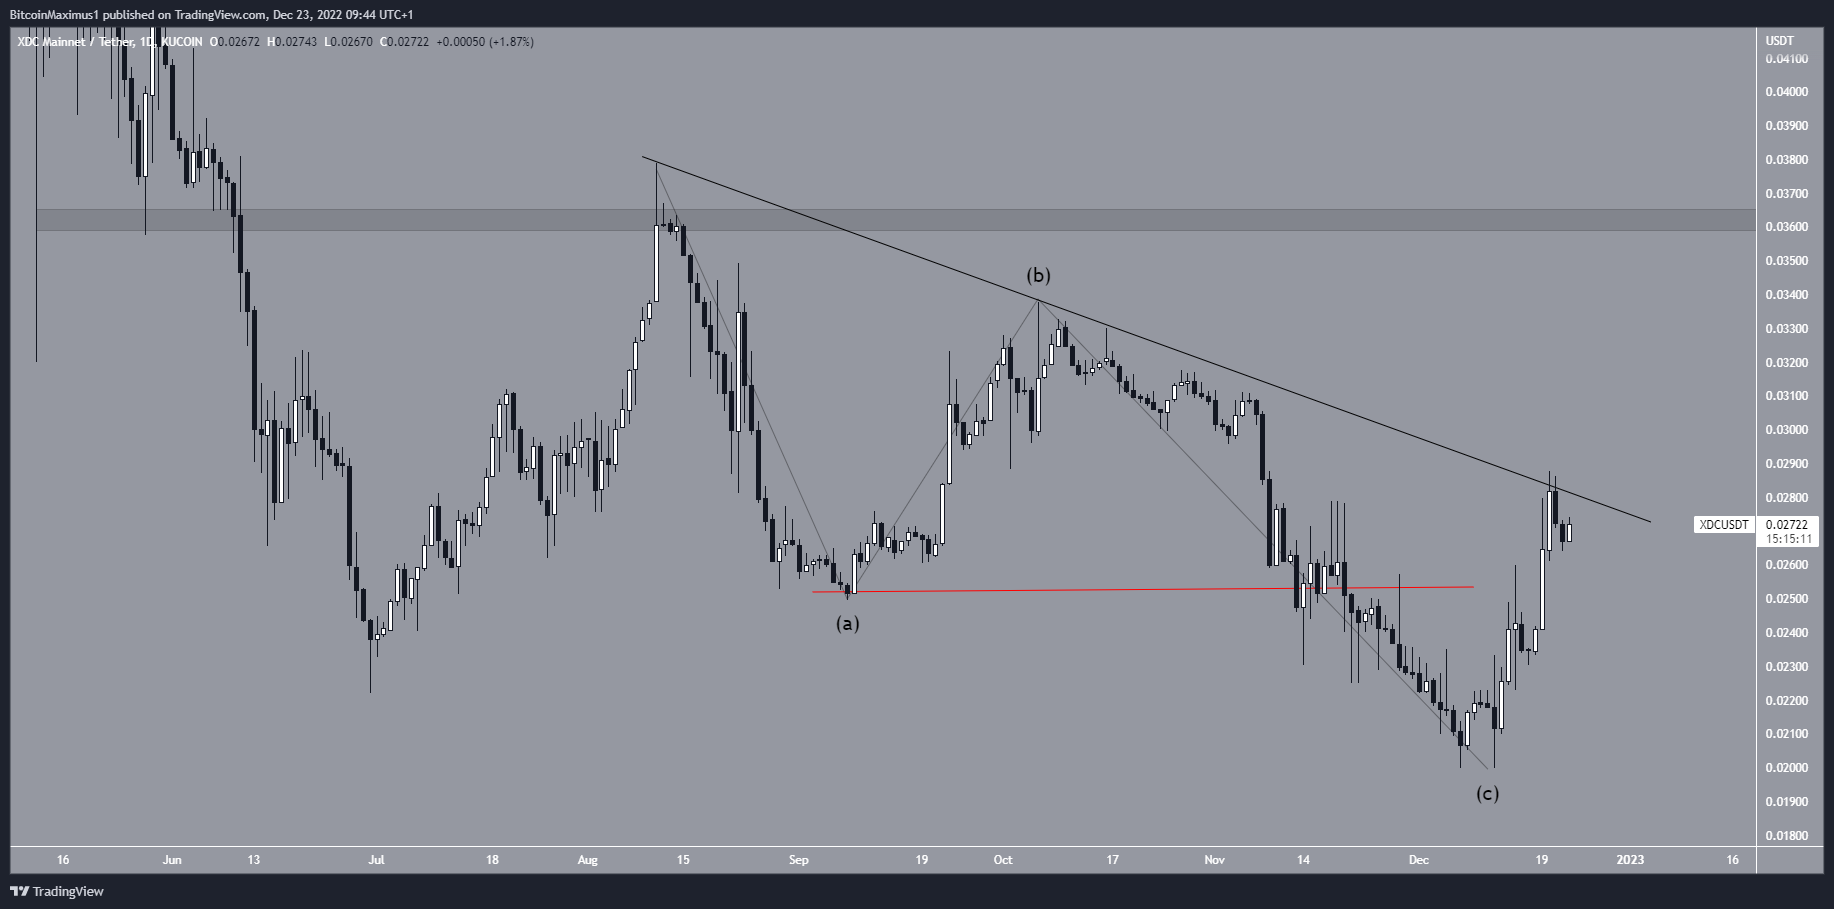
XDC Attempts Breakout
The XDC price has decreased below a descending resistance line since Aug. 11. The downward movement led to a low of $0.02 on Dec. 7. Due to the overlap in the movement (red line), decrease is likely a completed A-B-C corrective structure (black). This is supported by the strong bounce after the Dec. 7 lows, which took the XDC price back to the resistance line.
A breakout from the line would likely lead to an upward movement toward $0.036
Conversely, falling below the $0.070 low would invalidate this bullish hypothesis.
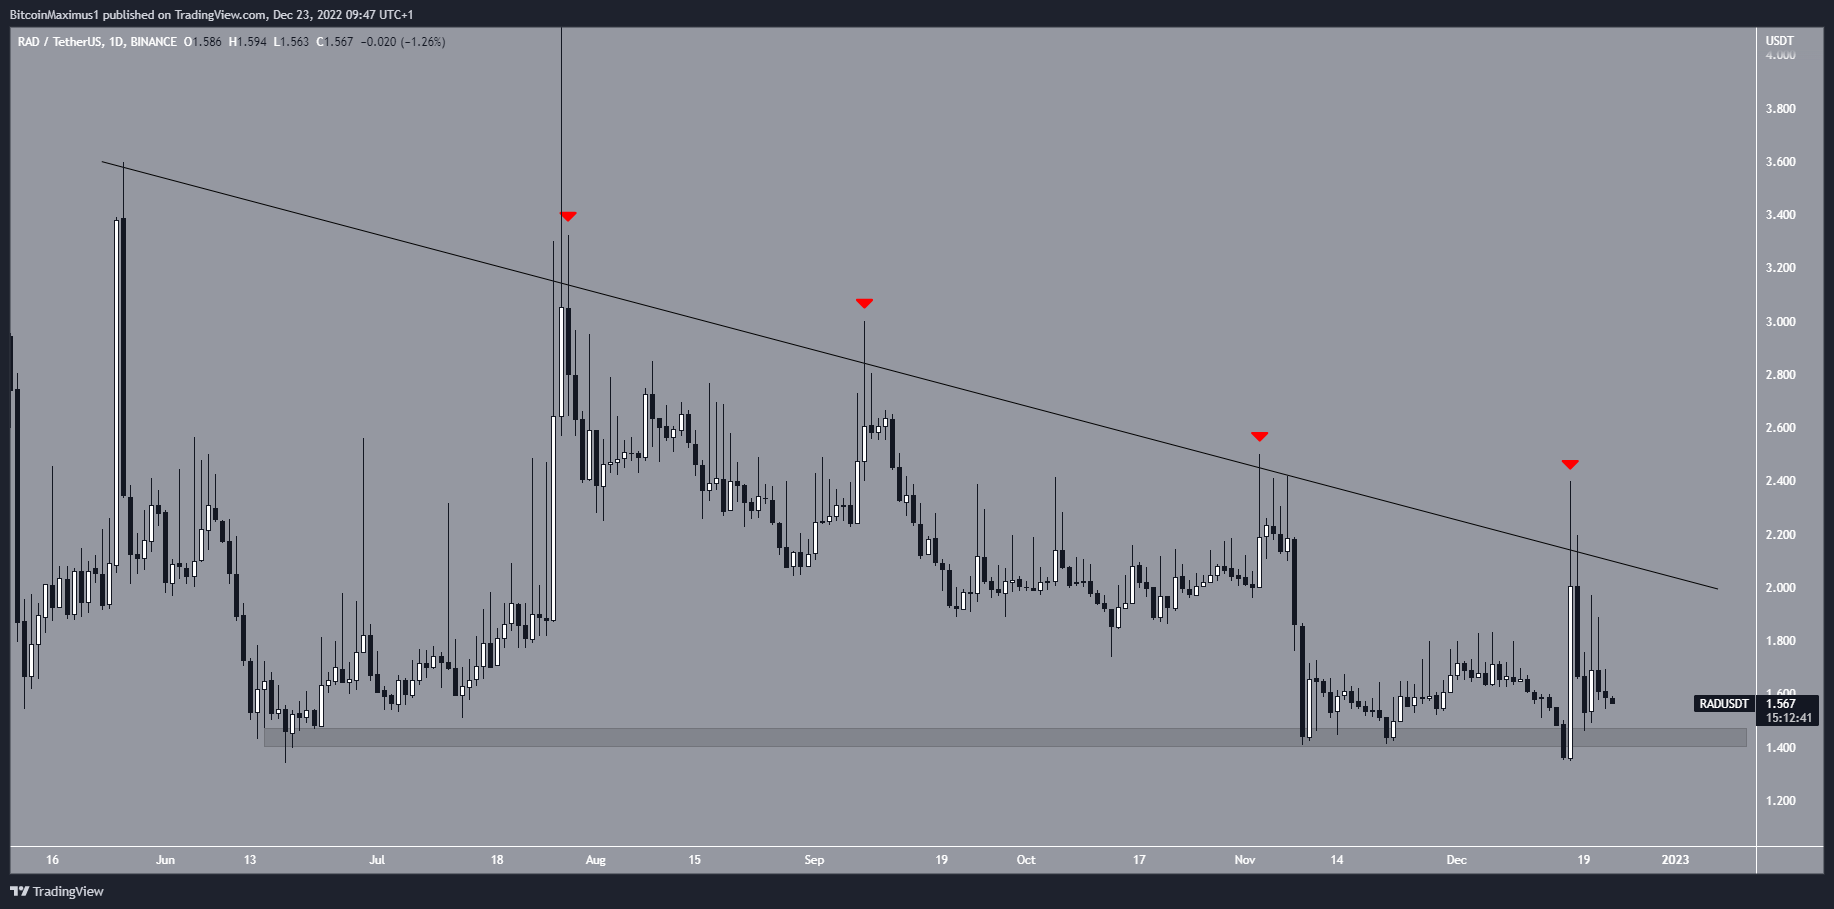
RAD Gets Rejected By Resistance
The RAD price has decreased below a descending resistance line since May 28. The line has caused numerous rejections so far (red icons), most recently on Dec. 17.
The closest support area is at $1.45. The area has acted as the yearly low support. As a result, a breakdown below it could accelerate the rate of decrease.
Whether the RAD price breaks out from the resistance line or falls below the $1.45 area will likely determine the direction of the future trend.
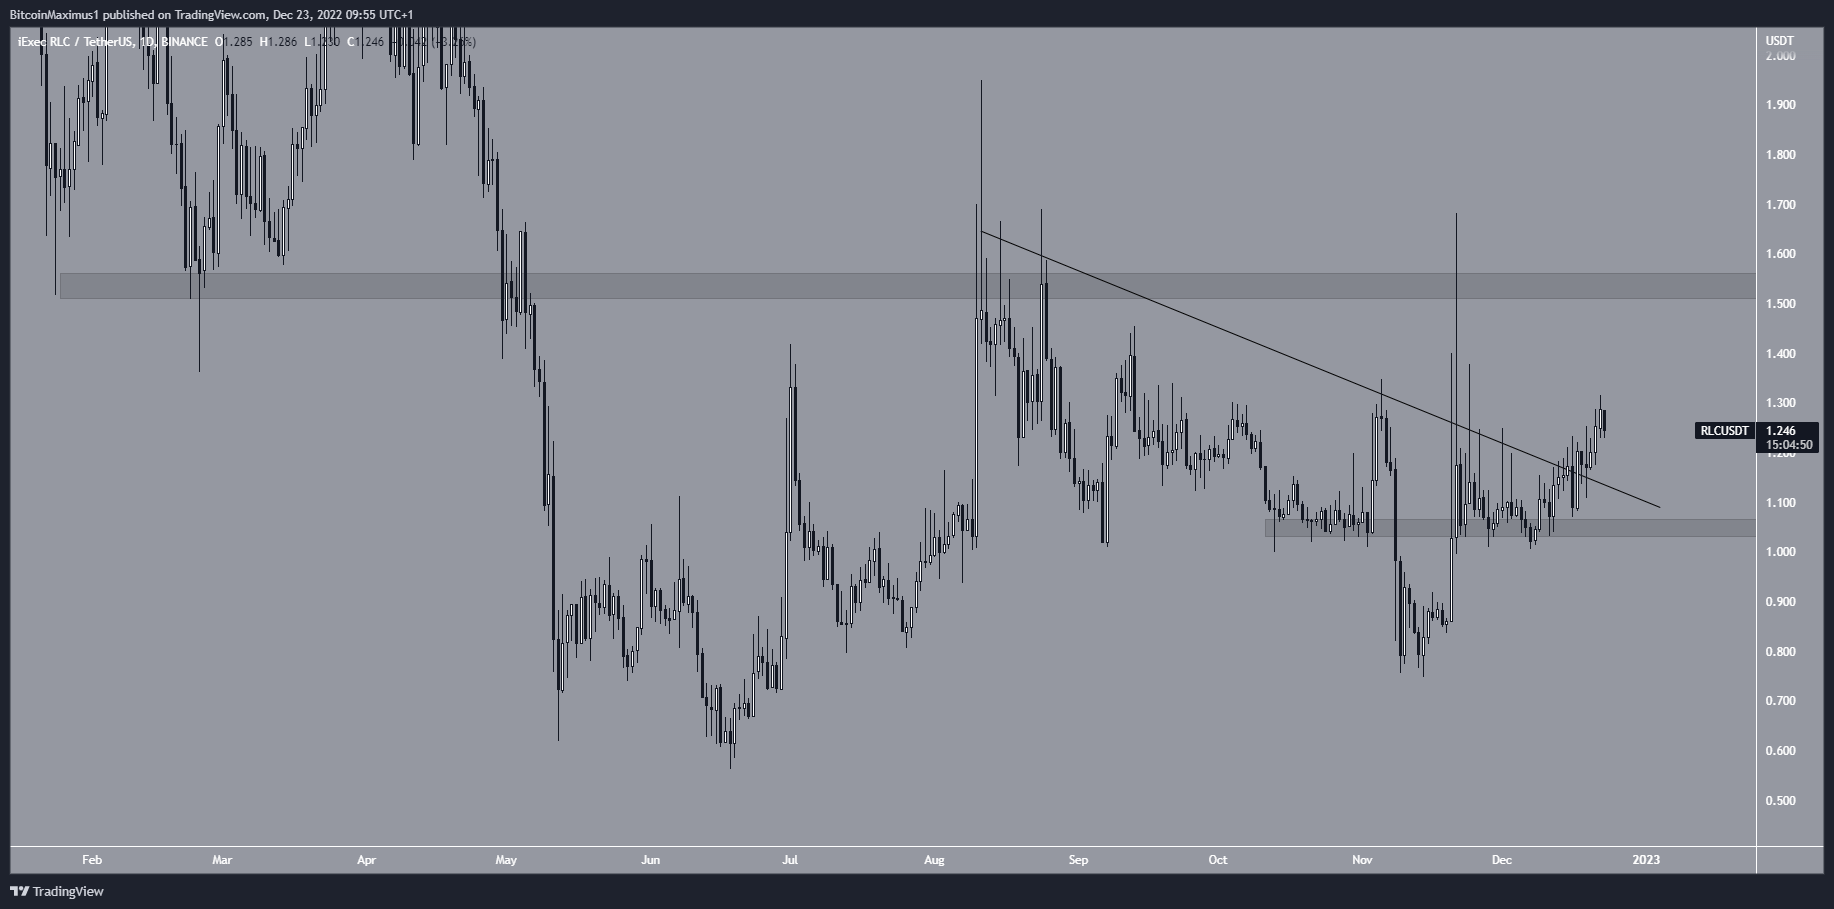
RLC Breaks Out Above Resistance
The RLC price had decreased below a descending resistance line since the beginning of Aug. The downward movement led to a low of $0.748 on Nov. 14.
The RLC price has increased since and broke out from the resistance line on Dec. 17. It also caused a reclaim of the $1.05 resistance area.
If the upward movement continues, the next closest resistance area would be at $1.55.
Conversely, breaking down from the $1.05 area would indicate the trend is bearish.
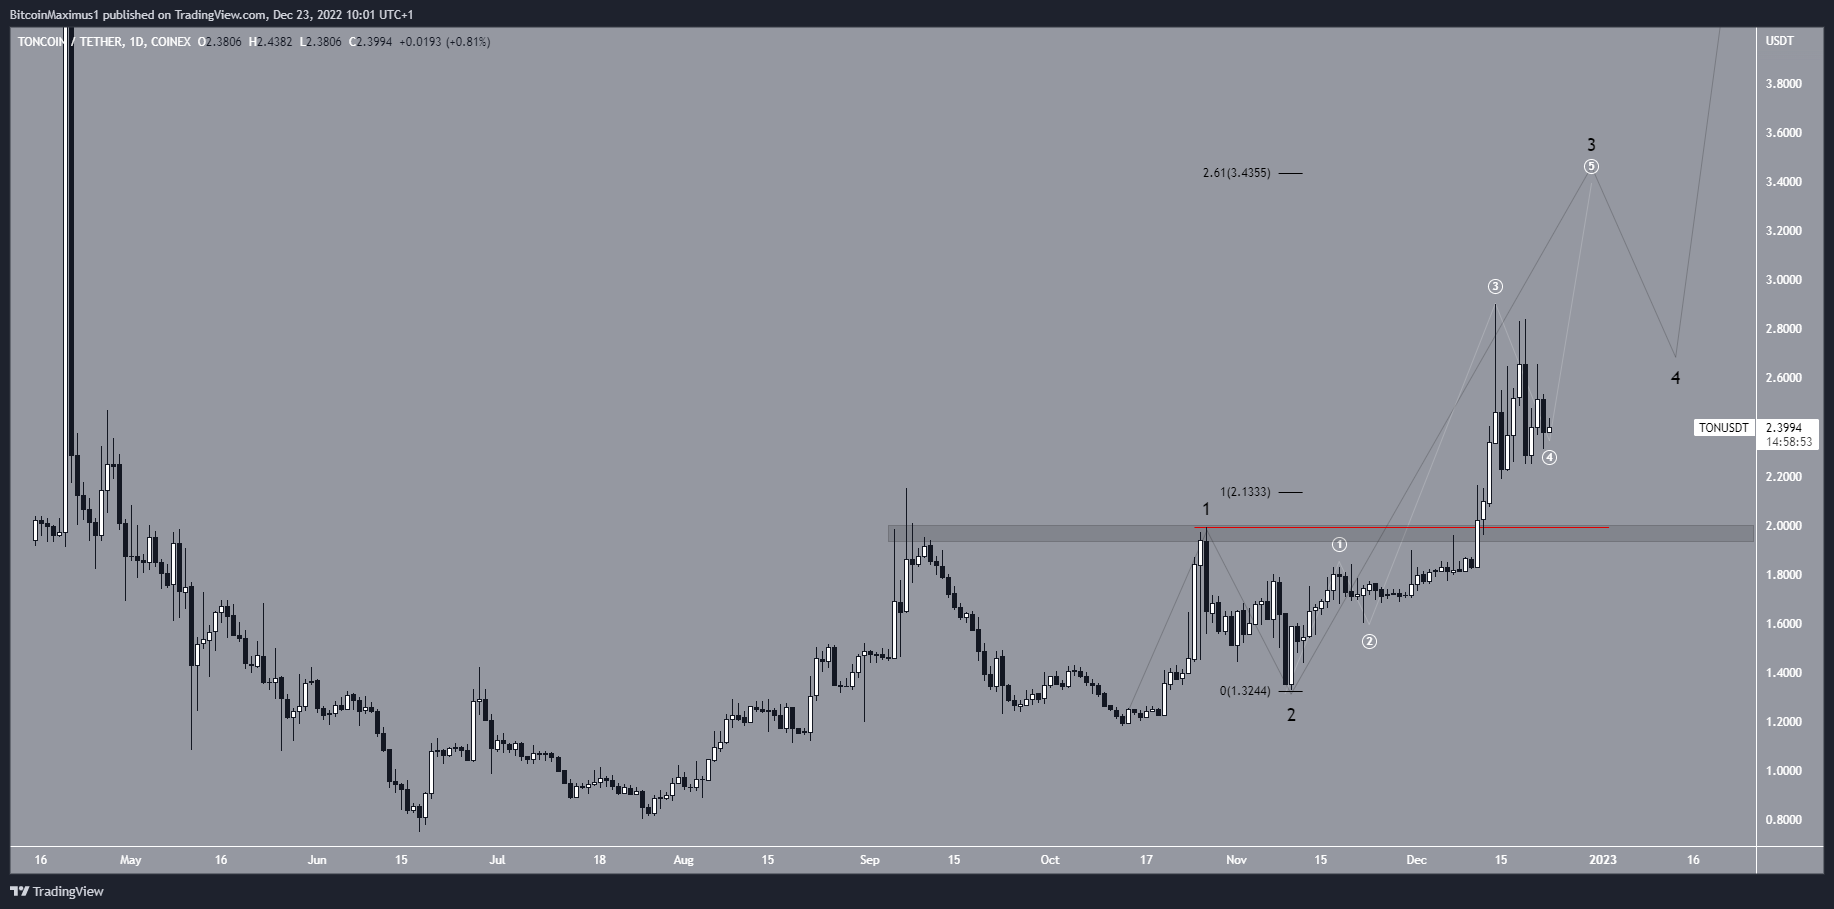
TON Is One of Few Altcoins With Bullish Setups
The TON price has moved upwards at an accelerated rate since reaching a low of $1.33 on Nov. 10. The upward movement caused a breakout above the $1.95 resistance area, further accelerating the rate of increase.
So far, the TON price has reached a high of $2.90.
The upward movement looks like a five-wave upward structure, in which TON is in wave three (black) and sub-wave five (white). A potential target for the top of the upward movement is at $3.44.
A decrease below the wave one high (red line) would invalidate the bullish hypothesis.
For BeInCrypto’s latest crypto market analysis, click here.


