


![The Waves Price Breaks Out, Is Targeting 16,000 Satoshis [Premium Analysis]](/_mfes/post/_next/image/?url=https%3A%2F%2Fassets.beincrypto.com%2Fimg%2F81MCBpCu4RLiFvl3b2mXxYCZTJ0%3D%2Fsmart%2F76ebcf8c4e9a4f978e814a83a10e3a5c&w=1920&q=75)
The Waves price is likely in the fifth and final wave of a medium-term upward trend. However, it is possibly in the primary stage of a longer-term upward trend.
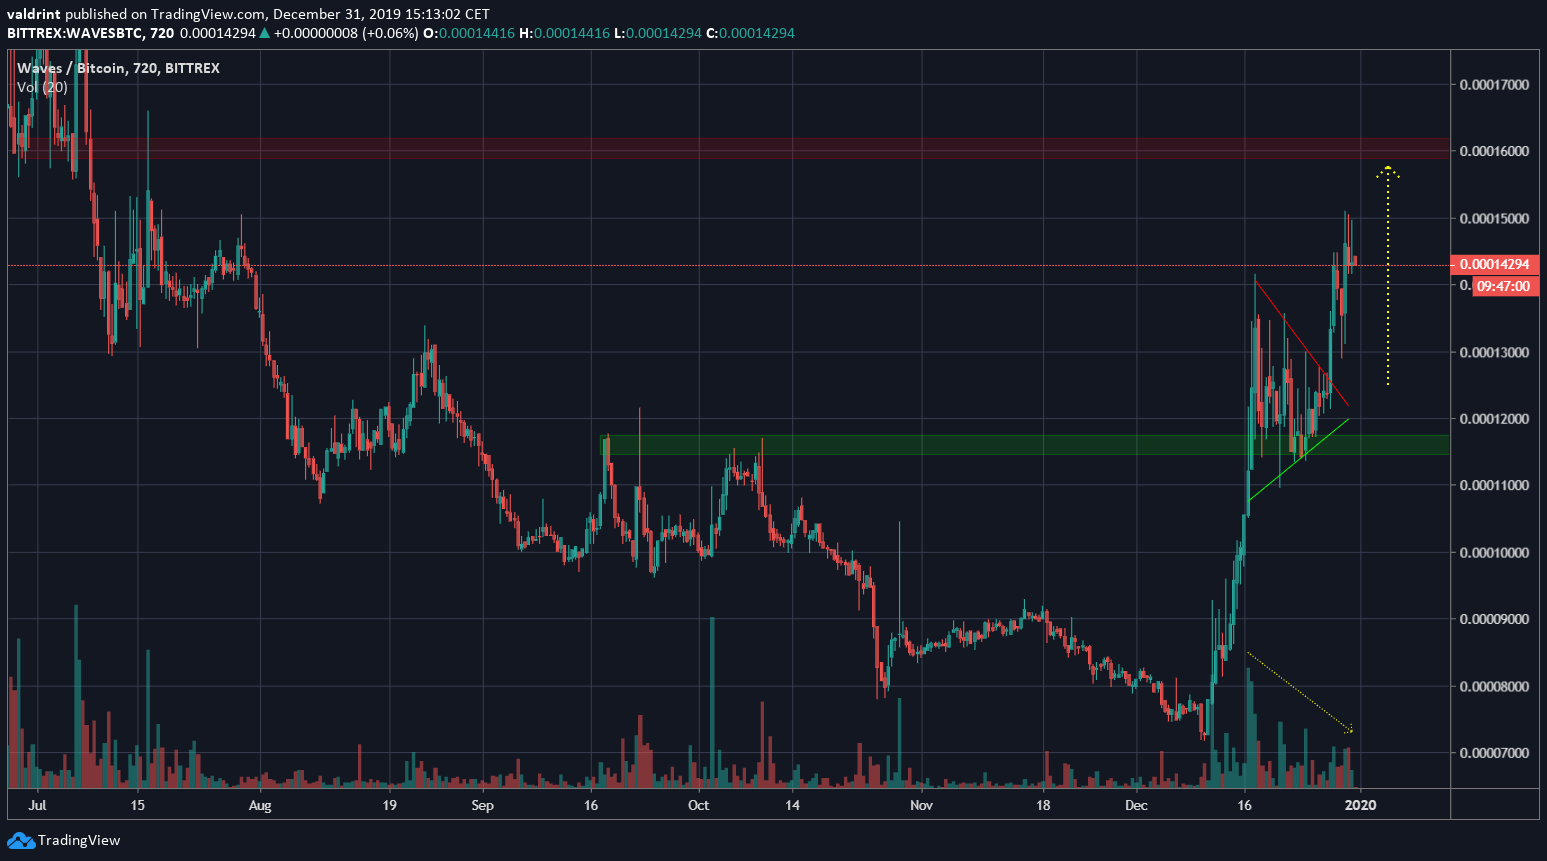
The Waves price began an upward trend on December 11. After breaking out above the initial resistance area on December 17, the price consolidated until December 26, when another breakout transpired — which is still ongoing.
Analyst and trader @devchart stated that, after retesting a previous resistance area, the Waves price is well on its way to another breakout — with a target of 16,300 satoshis.
https://twitter.com/devchart/status/1211947385204748288?s=19
Let’s take a closer look at the Waves price movement and determine if the price will get there.
Waves’ Continuation Breakout
The Waves price reached a low of 7185 satoshis on December 10. It began an upward move and increased above the 11,500 satoshi resistance area, validating it as support.
After the breakout, it created a symmetrical triangle — a continuation pattern from which it again broke out. Projecting the full height of the pattern to the breakout point takes us very close to the 1600 satoshi resistance area, the target outlined in the tweet.
However, since the breakout, the volume has been very low compared to the original upward move — a possible sign of weakness.
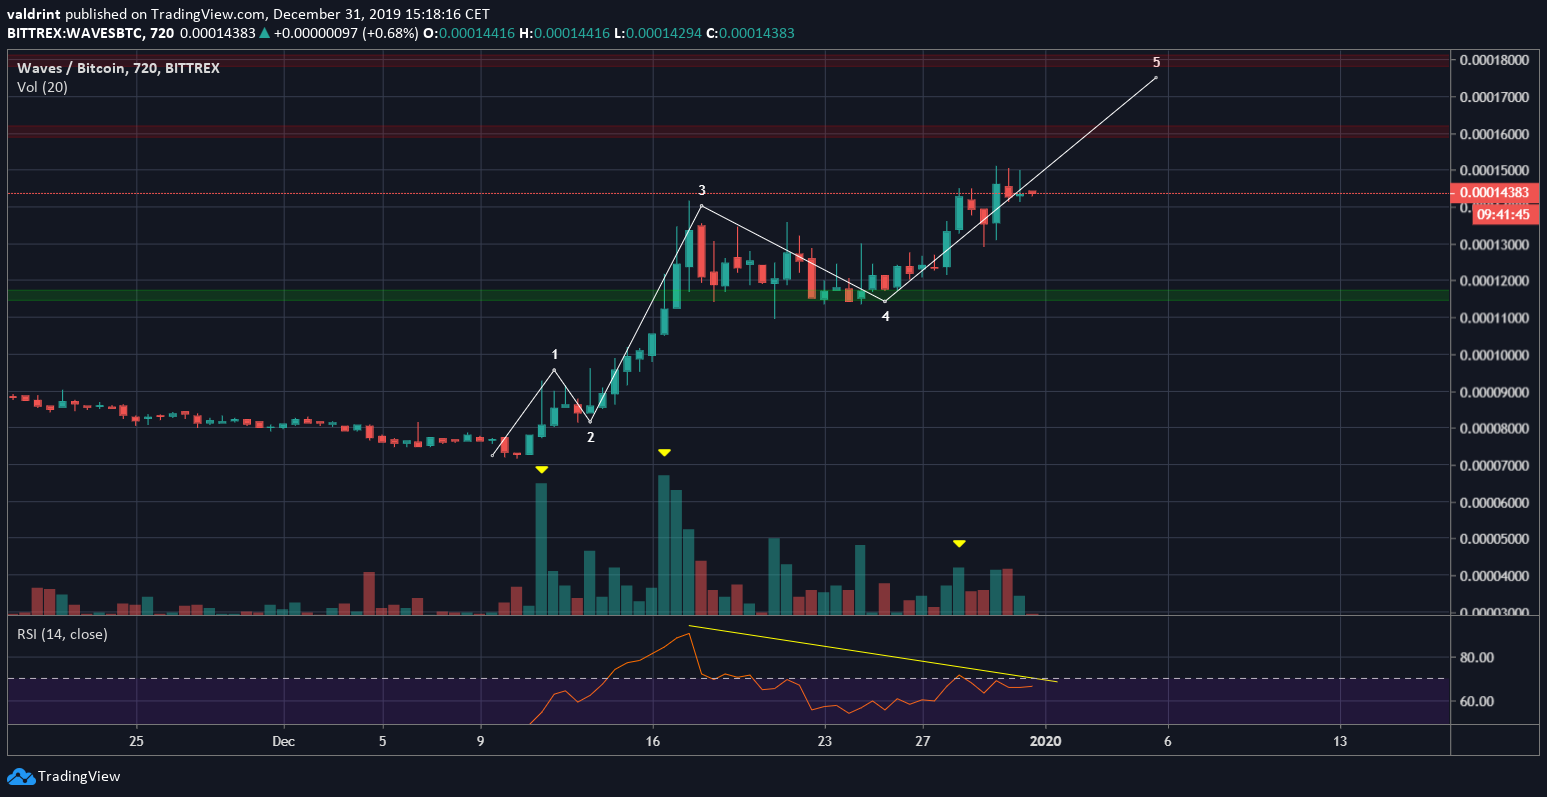
The characteristics of the movement resemble a five-wave Elliott formation.
The first wave had low volume but had a small magnitude. It was followed by a short correction. The third wave was very strong and had the highest volume.
It seems as if we are in the fifth wave, which has had a lower volume than the third one. Additionally, the bearish divergence developing in the RSI supports the hypothesis that the Waves price is in the final stages of the uptrend that began on December 10.
The fifth wave could get parabolic, so the price could reach a high of 18,000 satoshis, moving above the first resistance area.
Long-Term
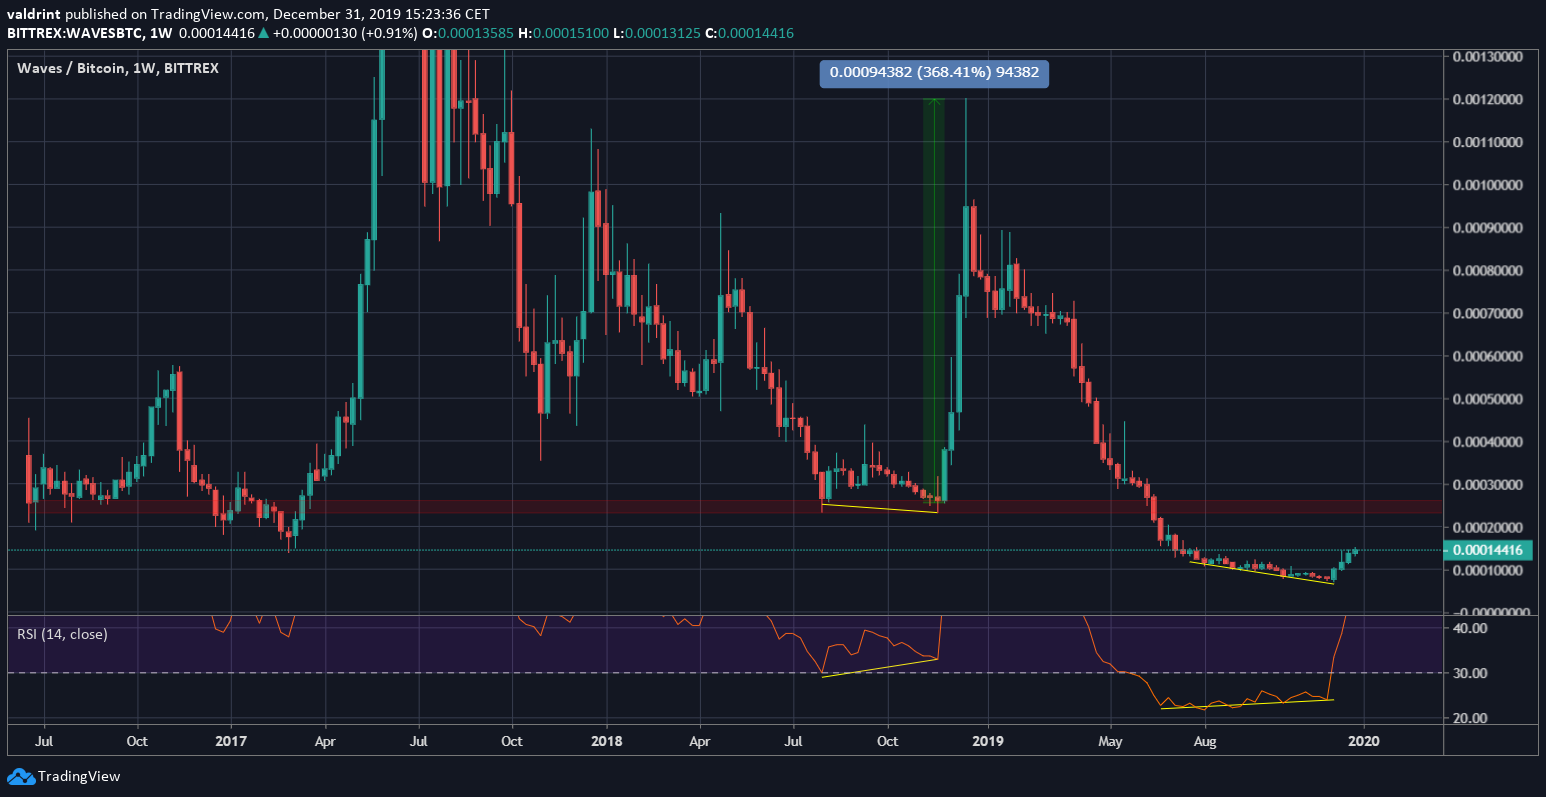
The weekly chart for Waves reveals that the price his possibly in the first phase of the initiation of a new market cycle.
The weekly RSI recorded oversold levels for almost six months before the price moved upward and caused the same to occur in the RSI. Additionally, it generated bullish divergence throughout the entire period.
The RSI has never been in the oversold territory before. However, it generated bullish divergence throughout August-November 2018, initiating an upward move with a 368 percent magnitude.
The main resistance area is found at 25,000 satoshis. A breakout above it could trigger a very rapid price increase.
To conclude, the Waves price is likely in the fifth and final wave of an upward move, for which we have a target between 16,000-18,000 satoshis. Additionally, it is possibly in the first stage of a long-term upward trend.
