


BeInCrypto takes a look at the seven altcoins that increased the most over the past seven days, from Oct 29 to Nov 5.
These altcoins are:
- The Sandbox (SAND) : 161.22%
- Velas (VLX) : 141.16%
- XYO (XYO) : 139.67%
- Decentraland (MANA) : 120.61%
- Loopring (LRC) : 113.63%
- Dogelon Mars (ELON) : 95.92%
- Arweave (AR) : 88.42%
SAND
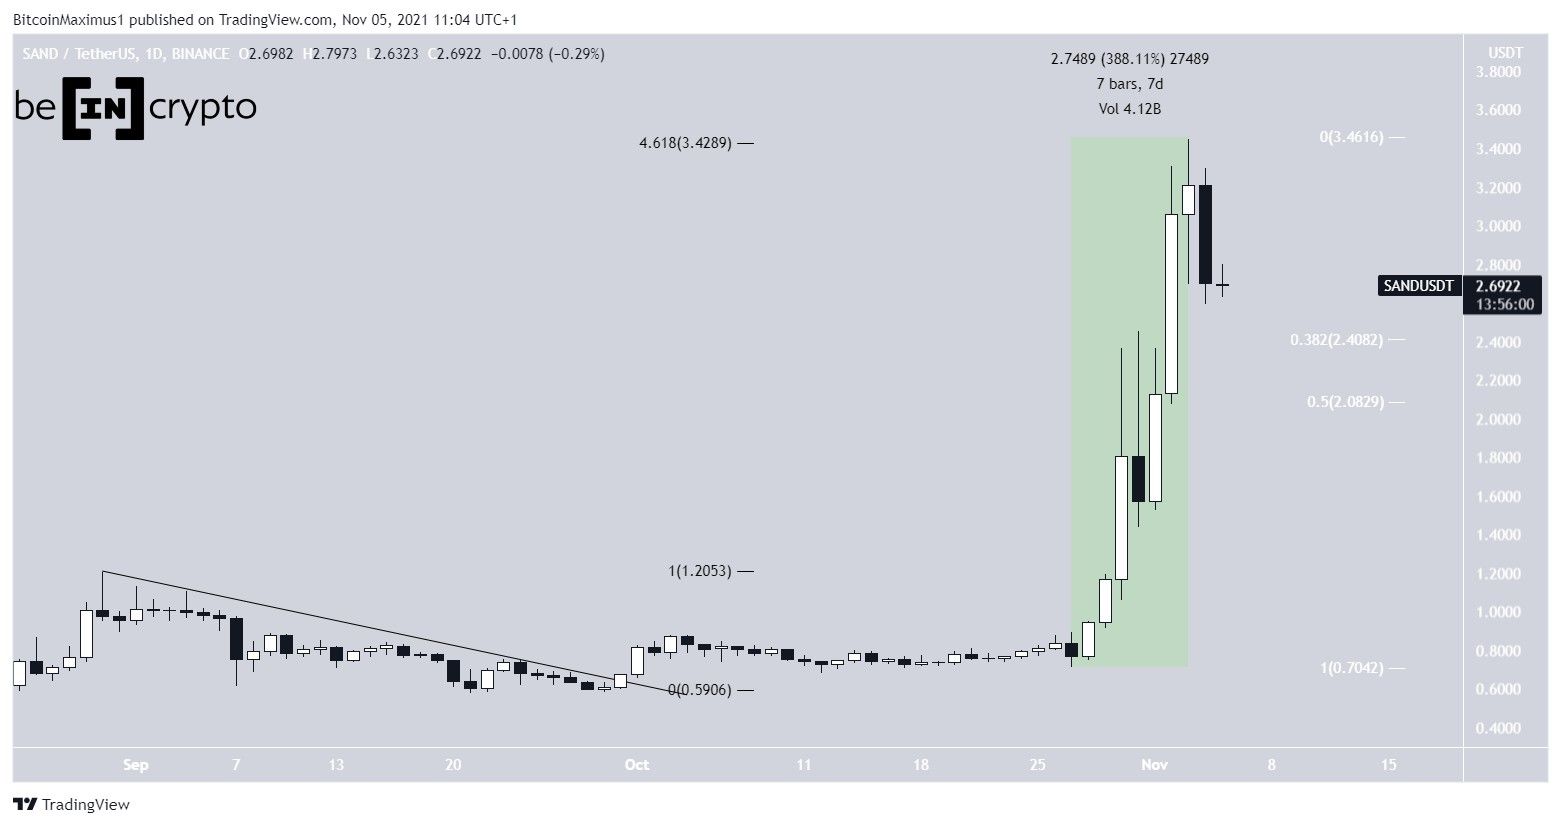
SAND has been increasing since breaking out from a descending resistance line on Sept 31. The rate of increase accelerated greatly on Oct 27, after the token created a higher low.
In a span of seven days, SAND increased by 389%, leading to a new all-time high price of $3.45 on Nov 3.
The high was made right at the 4.61 external Fib retracement when measuring the previous drop. This is a level that very often acts as the high of upward movements.
Therefore, it is possible that SAND has reached a local top. It further supported this possibility by creating a bearish engulfing candlestick on Nov 4. This is a type of bearish candlestick in which the entire upward movement from the previous day is negated the next one.
If the token resumes its downward movement, the closest support area would be between $2.40 and $2.09.
VLX
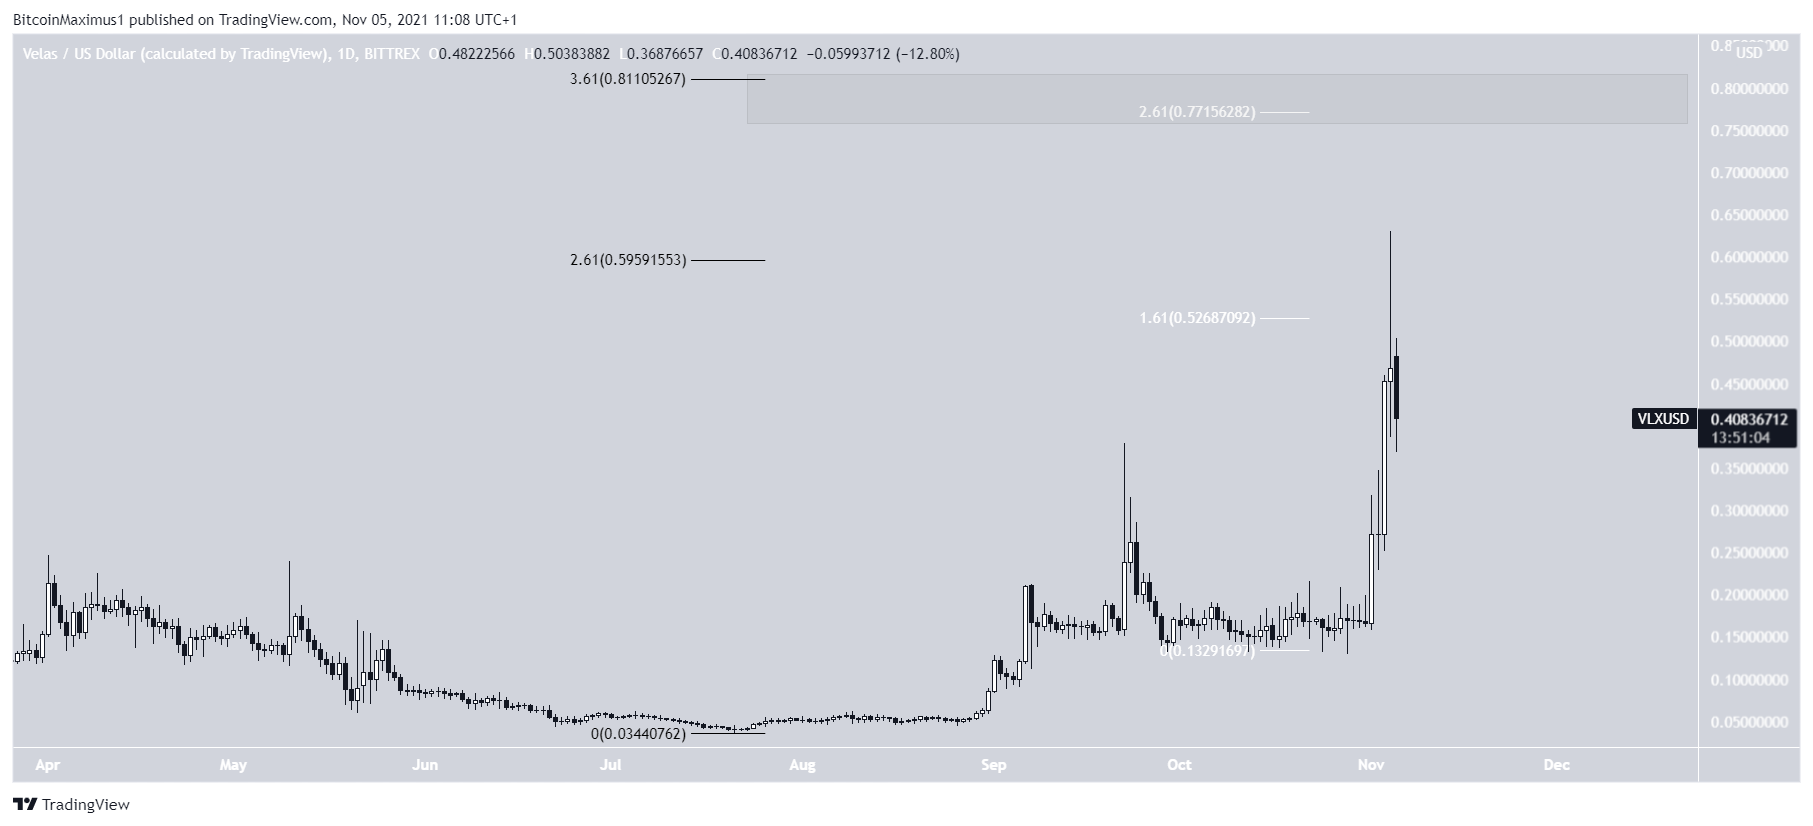
VLX has been increasing at an accelerated rate since Oct 28. The upward movement culminated with an all-time high of $0.63 on Nov 4.
However, the token created a shooting star candlestick the same day and has been decreasing. This is a type of bearish candlestick that has a very long upper wick, a sign of selling pressure.
Furthermore, the high was made at a confluence of resistance levels, created by the short-term 1.61 (white) and the long-term 2.61 (black) external Fib retracement levels.
The next resistance is between $0.77 – $0.81.
XYO
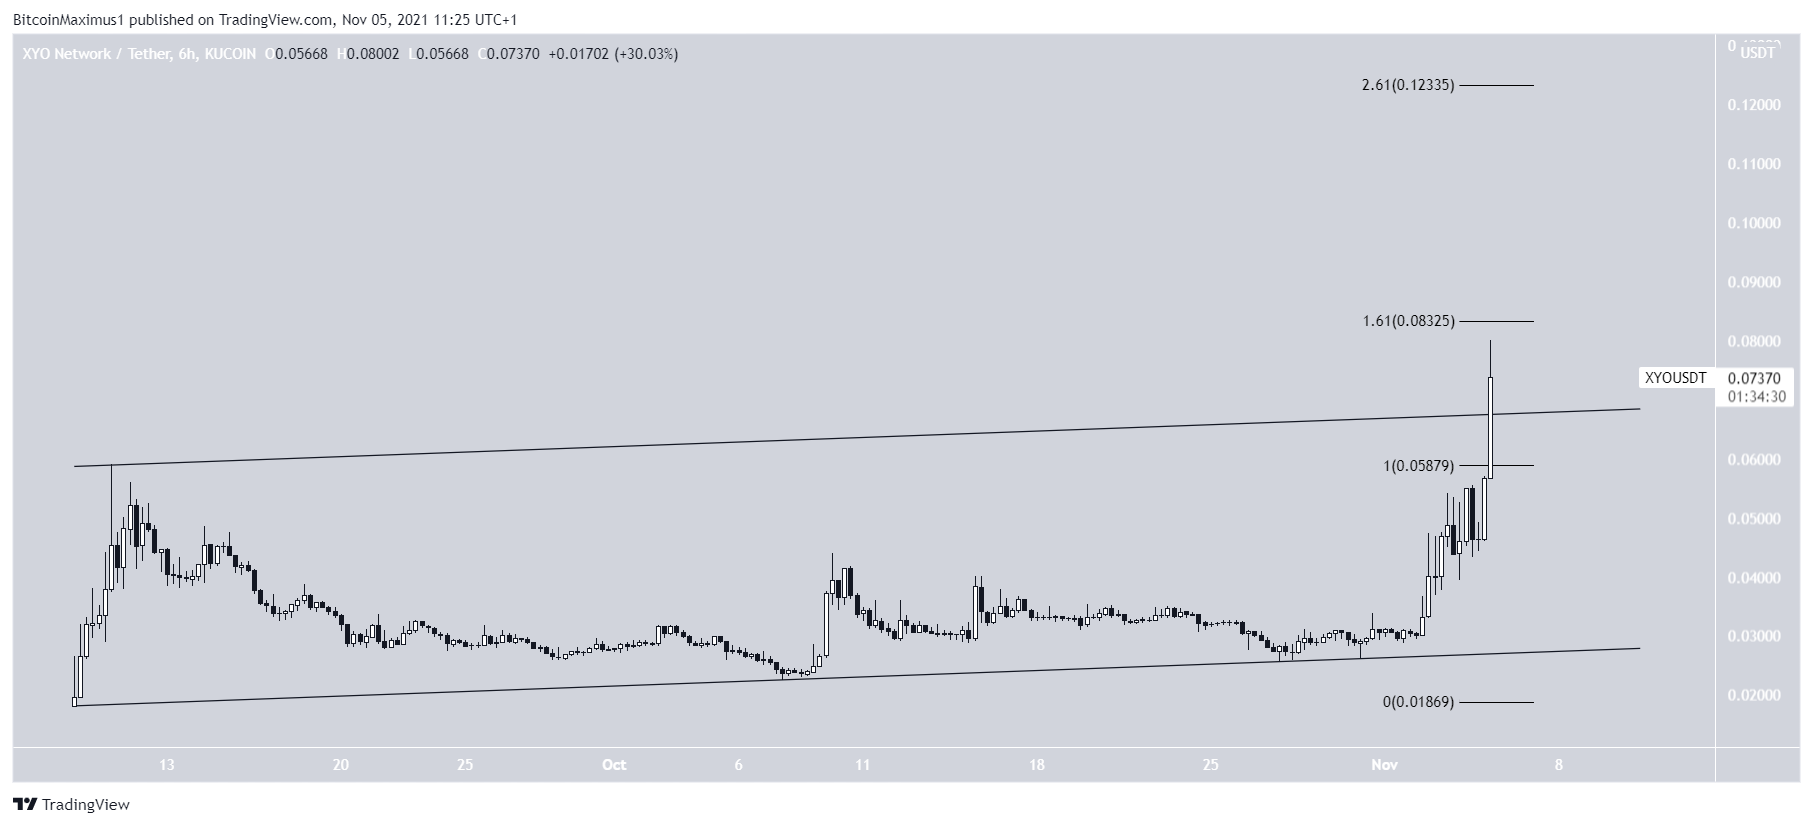
XYO has been increasing inside an ascending parallel channel since the beginning of Sept. After bouncing on its support line on Oct 31, it initiated an upward movement. It is currently in the process of breaking out.
If it is successful in reaching a close above the resistance line of this channel, XYO would confirm that it has begun a new upward movement.
The next closest resistance levels are at $0.083 and $0.123.
MANA
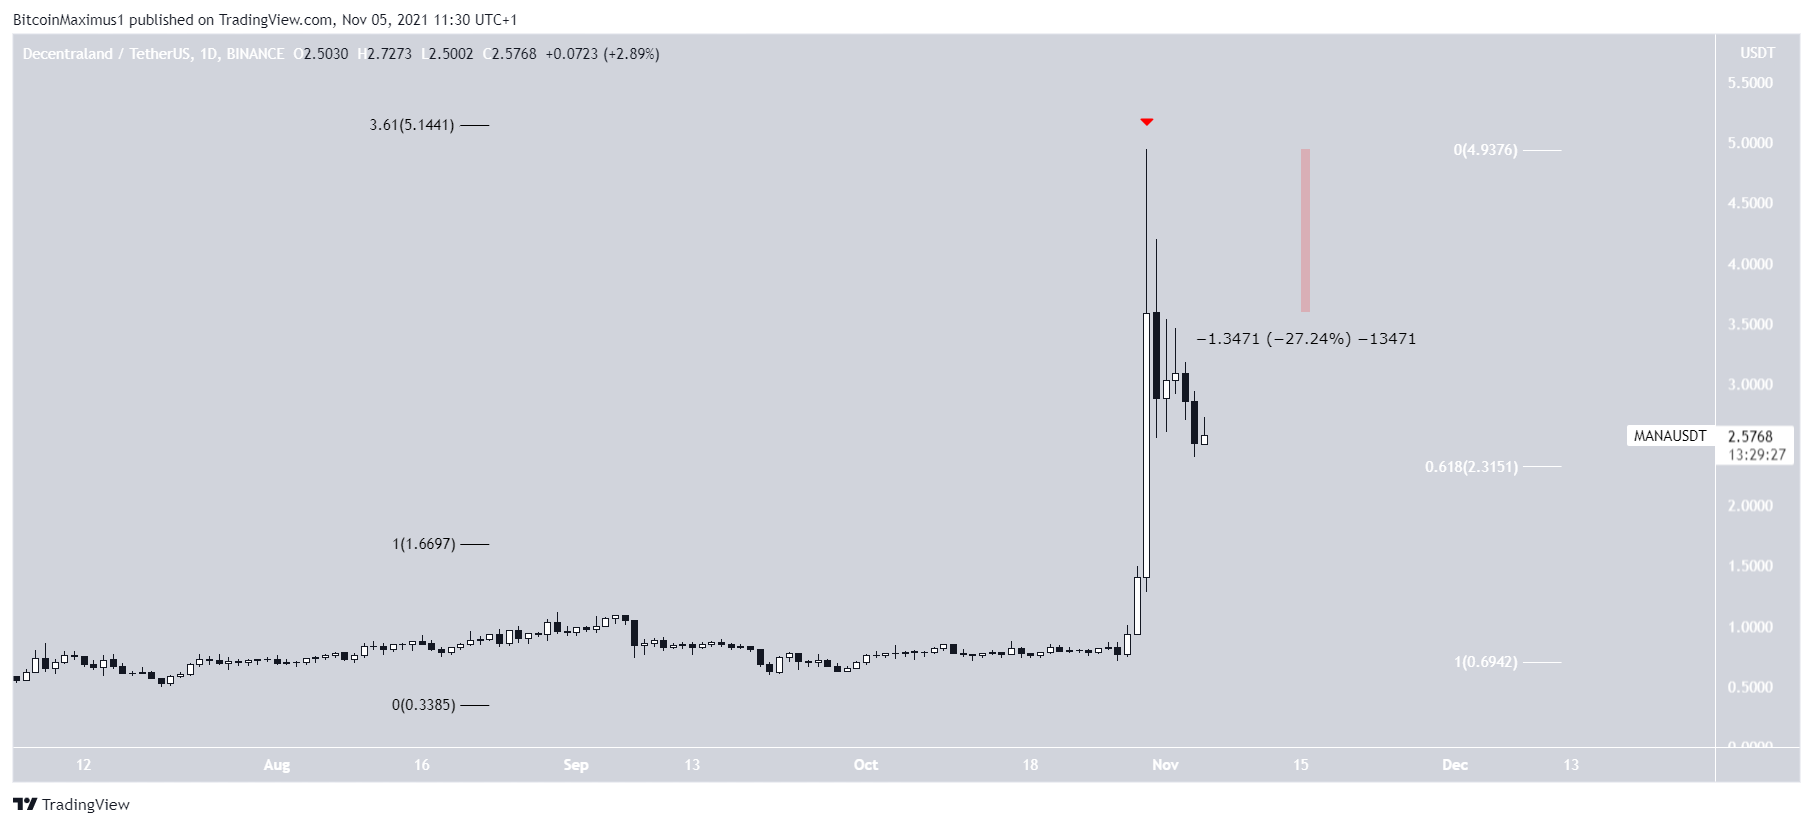
MANA initiated a significant upward movement on Oct 28, when it was trading at $0.75. Two days later, it reached a new all-time high of $4.94. The high was made very close to the 3.61 external Fib retracement level when measuring the previous drop.
MANA has been decreasing since, and created a long upper wick with a magnitude of 27.25% the same day it reached a new all-time high.
However, the token has dropped all the way to the 0.618 Fib retracement support level at $2.31, so it could initiate a bounce.
LRC
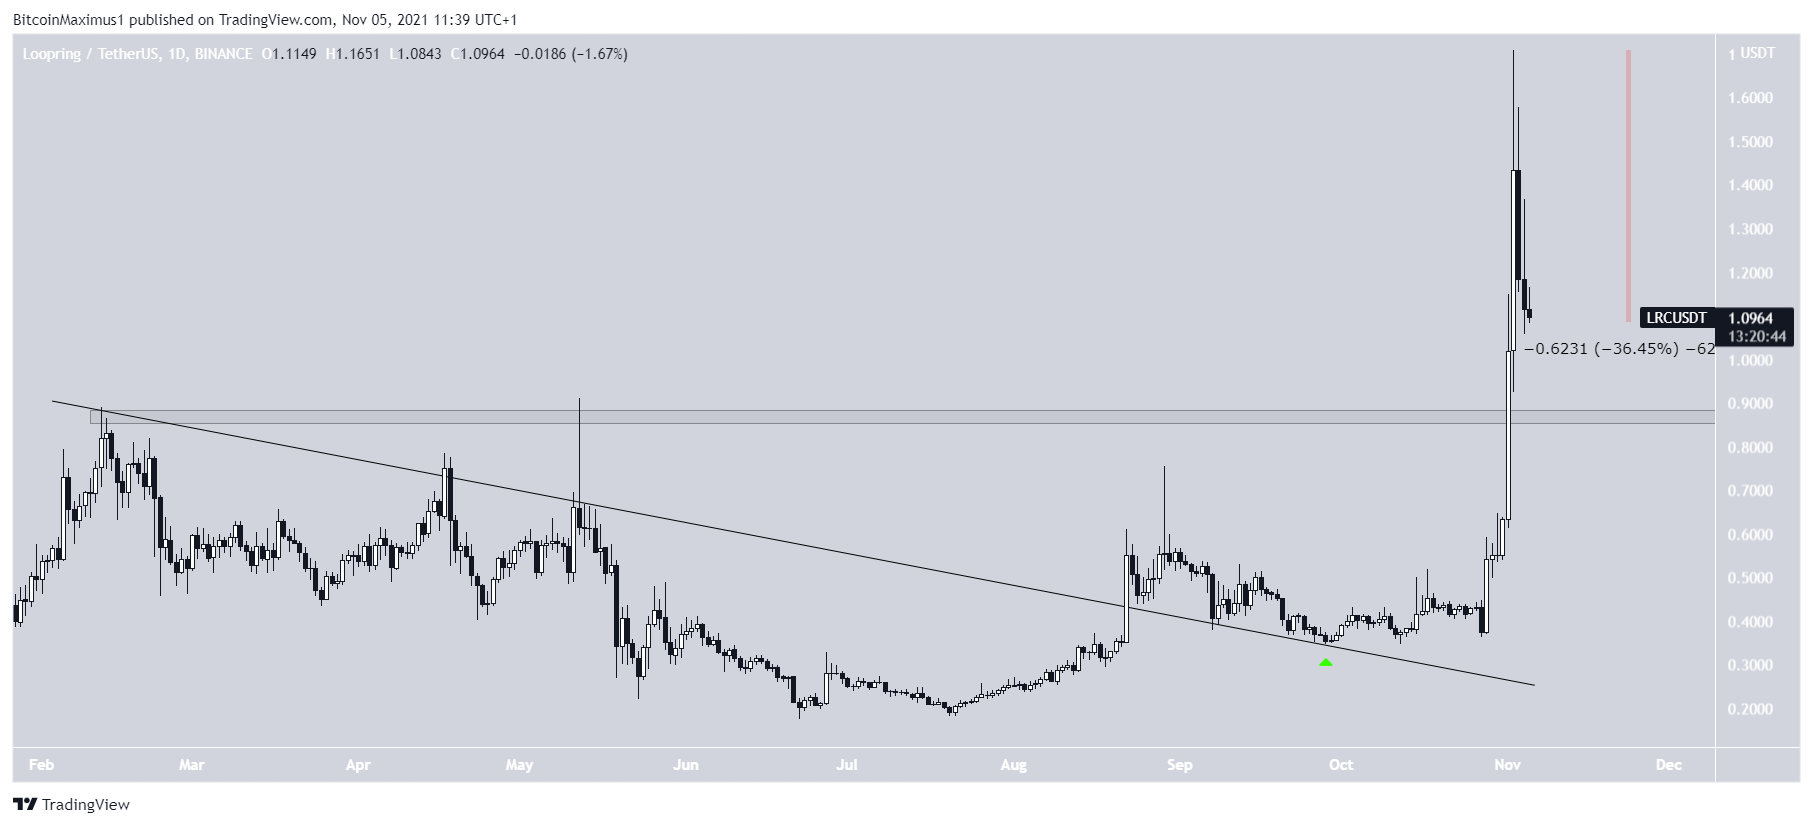
LRC has been moving upwards since breaking out from a descending resistance line and validating it as support on Sept 31. This suggested that the previous correction had come to an end and a new upward movement began.
The upward movement culminated with a new all-time high price of $1.71 on Nov 2.
However, LRC has been falling since, having decreased by 36.54% so far. If it continues to drop, the $0.86 area would be expected to act as support.
ELON
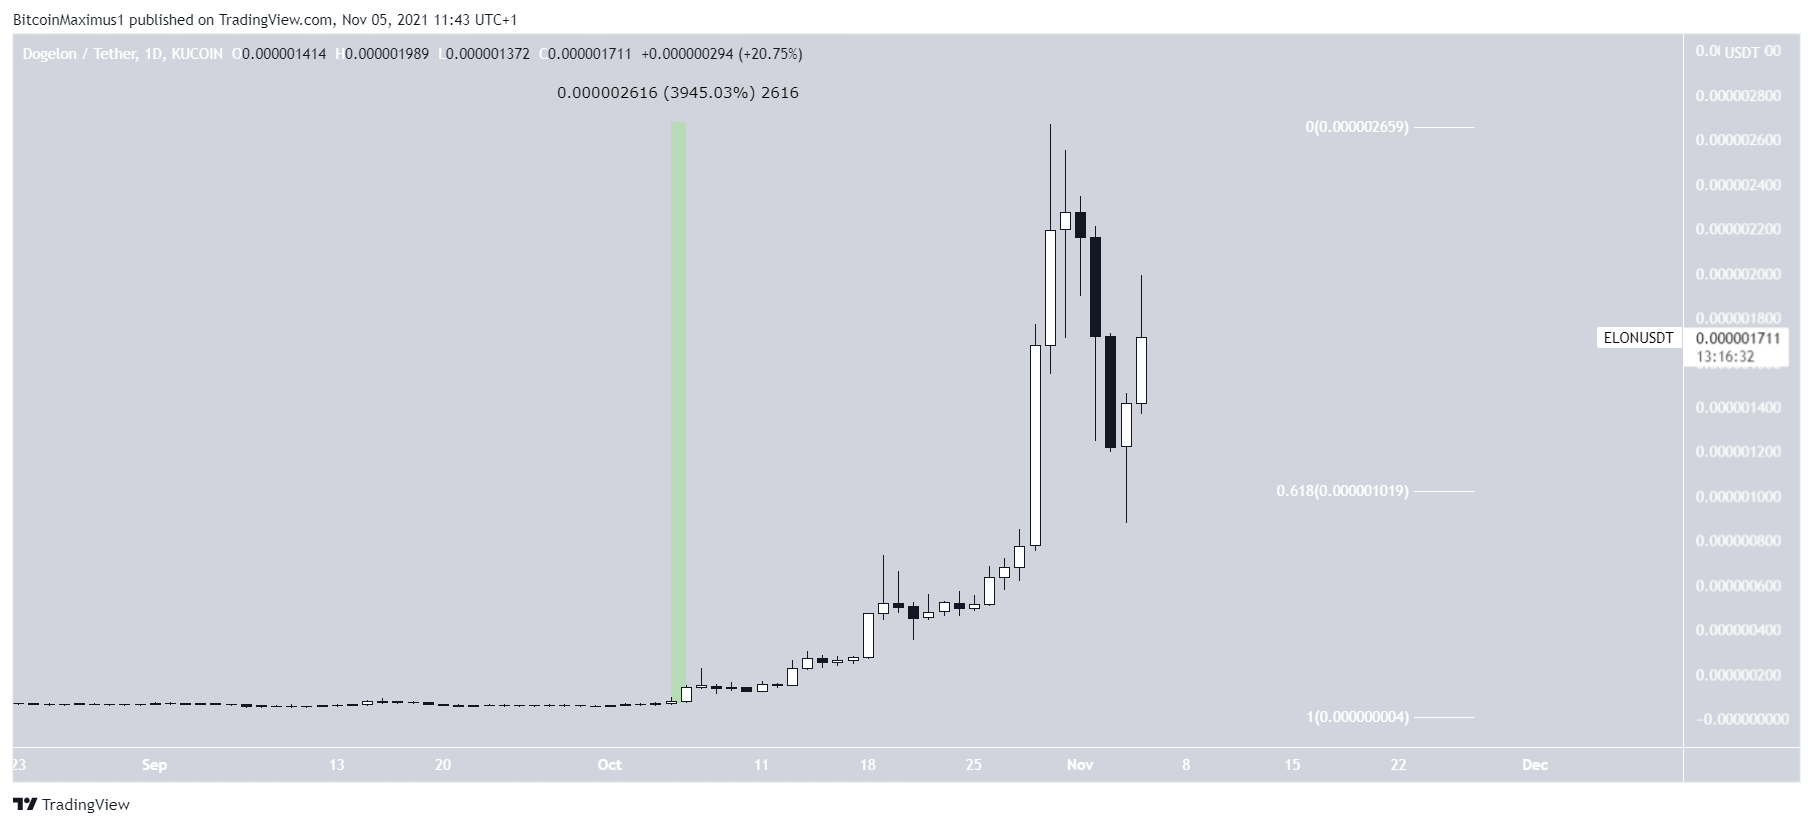
ELON was subject to a massive increase beginning on Oct 6. This led to a new all-time high price of $0.0000026 on Oct 31. It amounted to an increase of 3945% in less than one month.
While ELON dropped afterwards, it bounced at the 0.618 Fib retracement support level at $0.000001 and created a long upper wick. It has been moving upwards since.
AR
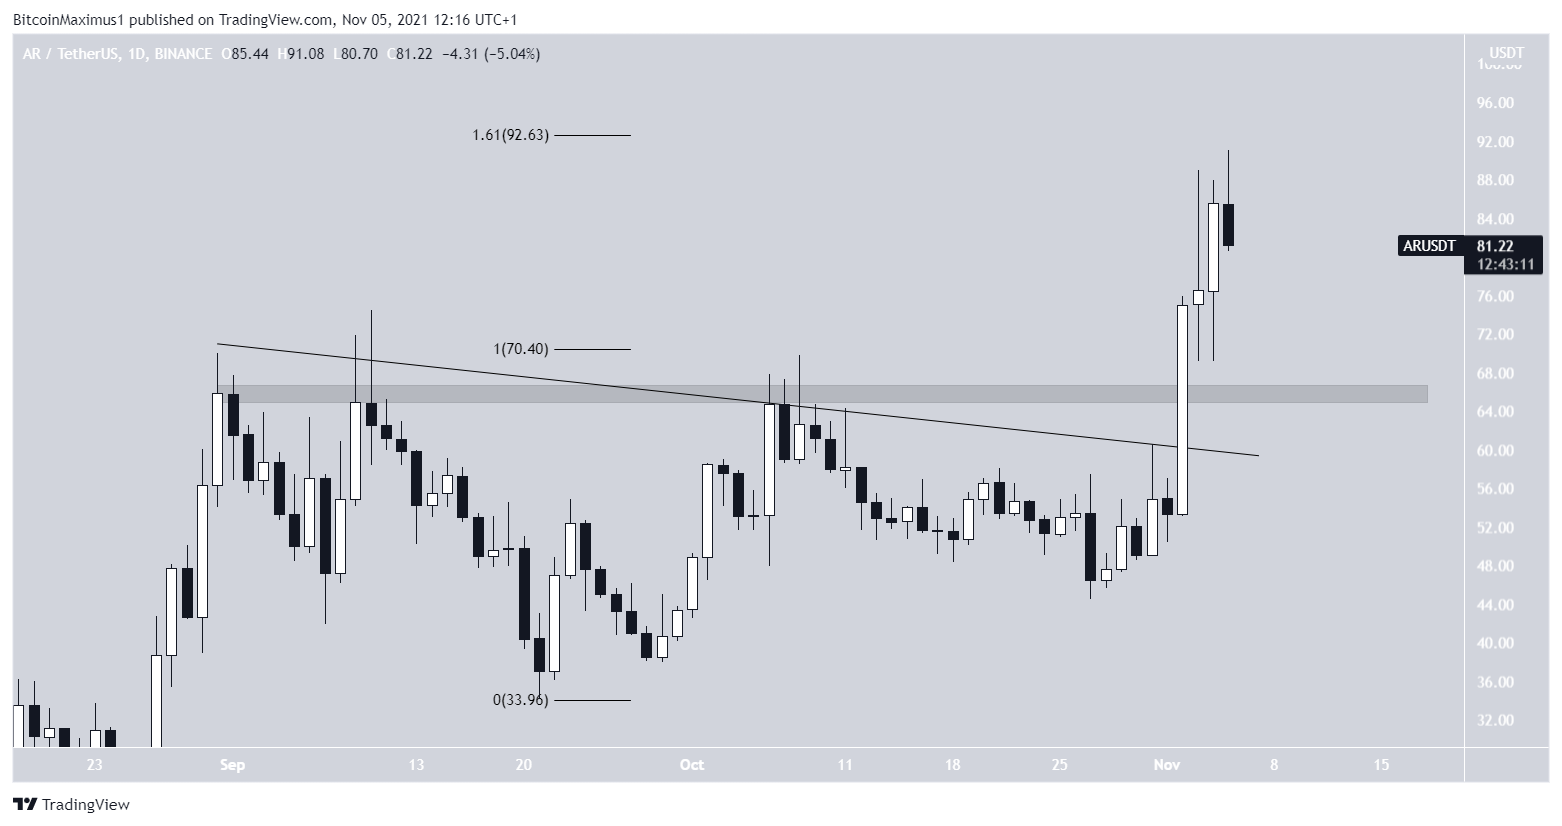
AR has been increasing since Nov 2, when it broke out from a descending resistance line. This confirmed that the downward movement that had been going on since the beginning of Sept came to an end.
The increase led to an all-time high price of $91.08 on Nov 5. The high was made right at the 1.61 external Fib retracement when measuring the most recent downward movement.
AR has been decreasing since. The previous all-time high region of $66 is now expected to provide support.
For BeInCrypto’s latest Bitcoin (BTC) analysis, click here.
What do you think about this subject? Write to us and tell us!


