


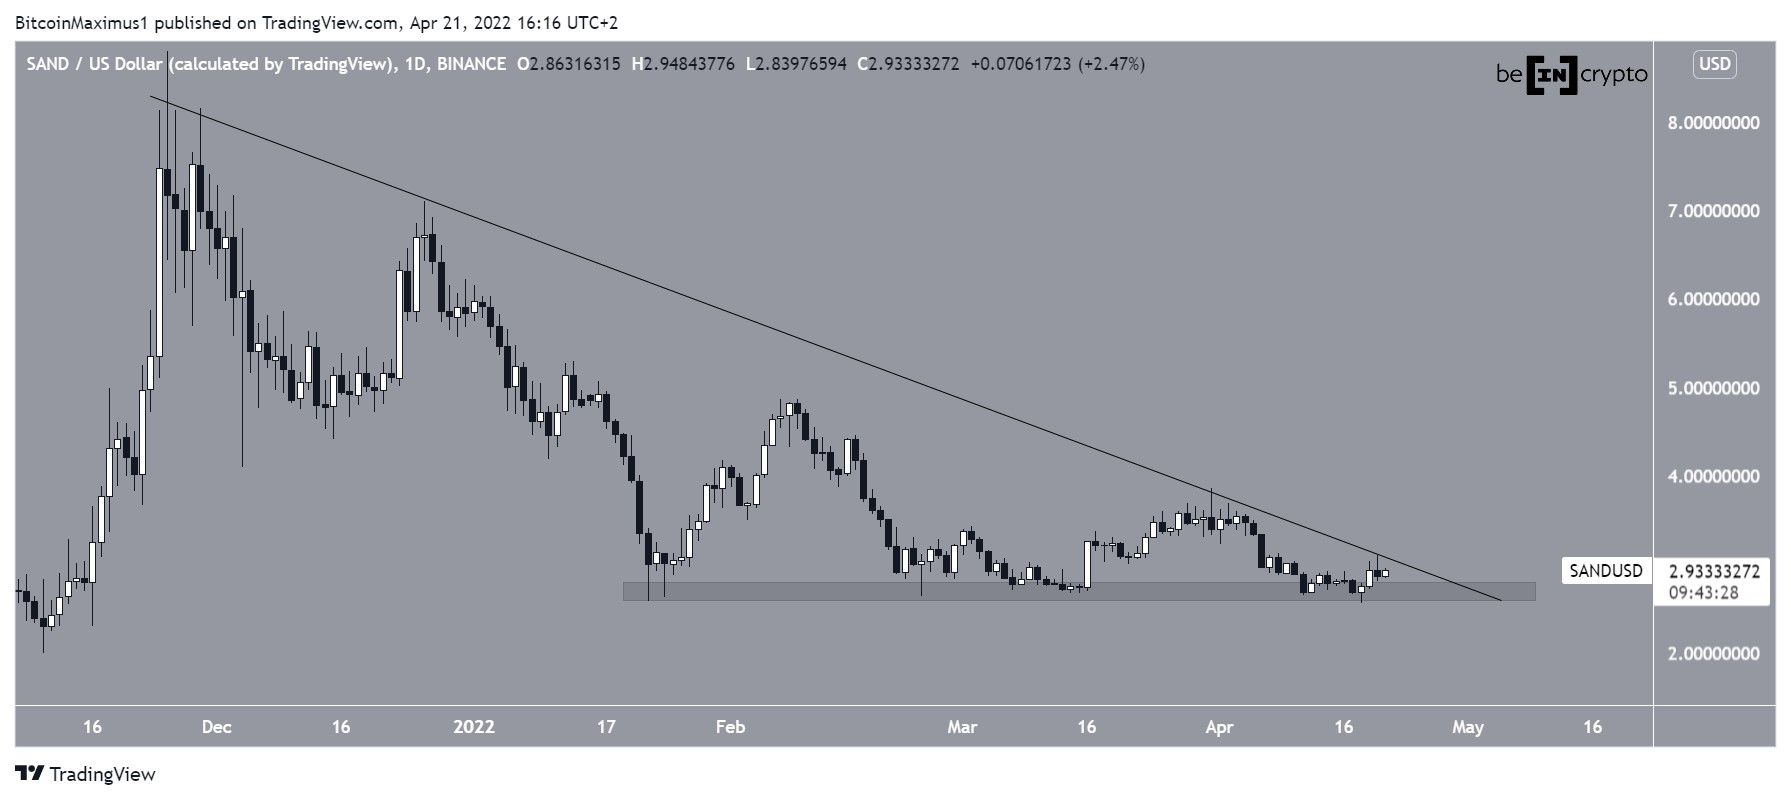
The Sandbox (SAND) is trading above the $2.70 horizontal support area, but has yet to show any significant bullish reversal signs.
SAND has been decreasing underneath a descending resistance line since reaching an all-time high price of $8.80 on Nov. 25, 2021. The downward movement led to a low of $2.57 on January 22.
Since then, SAND has bounced at the $2.70 horizontal area thrice. However, each bounce has been weaker than the previous one.
Measuring from the all-time high, SAND has decreased by 67% so far.
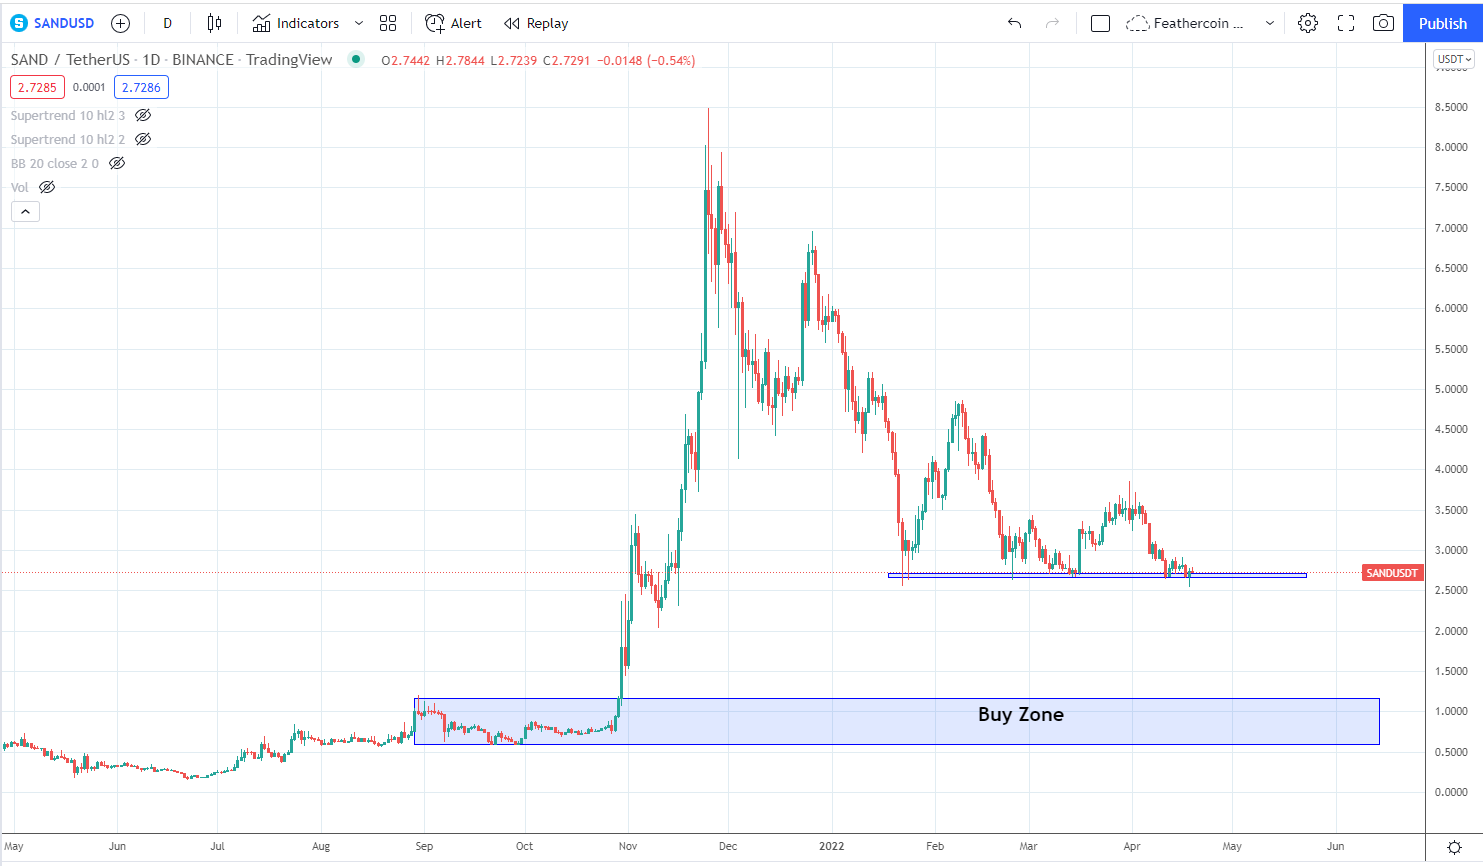
Market analyst @IncomeSharks tweeted a chart of SAND, stating that the price could eventually fall to $1.
To determine if this will occur, a close look at the price movement and indicator readings is required.
Future movement
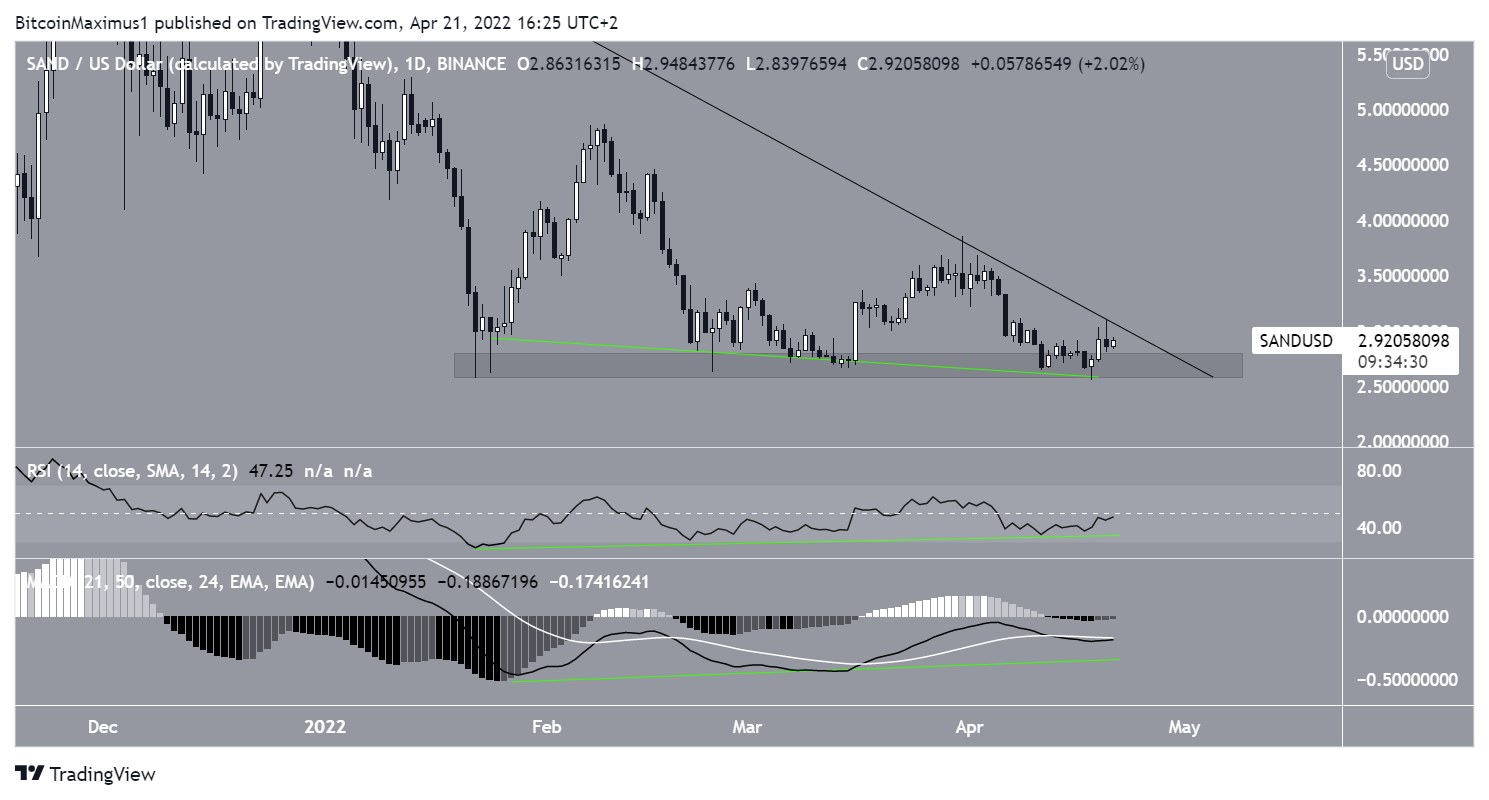
Technical indicator readings in the daily time frame are mixed – both the RSI and MACD have generated bullish divergences (green), which are considered signs of bullish trends.
However, both are also falling. The daily time frame readings are mixed, as the RSI is below 50 and the MACD is negative.
Whether SAND breaks out from the resistance line or down from the $2.70 area, will likely determine the direction of the trend.
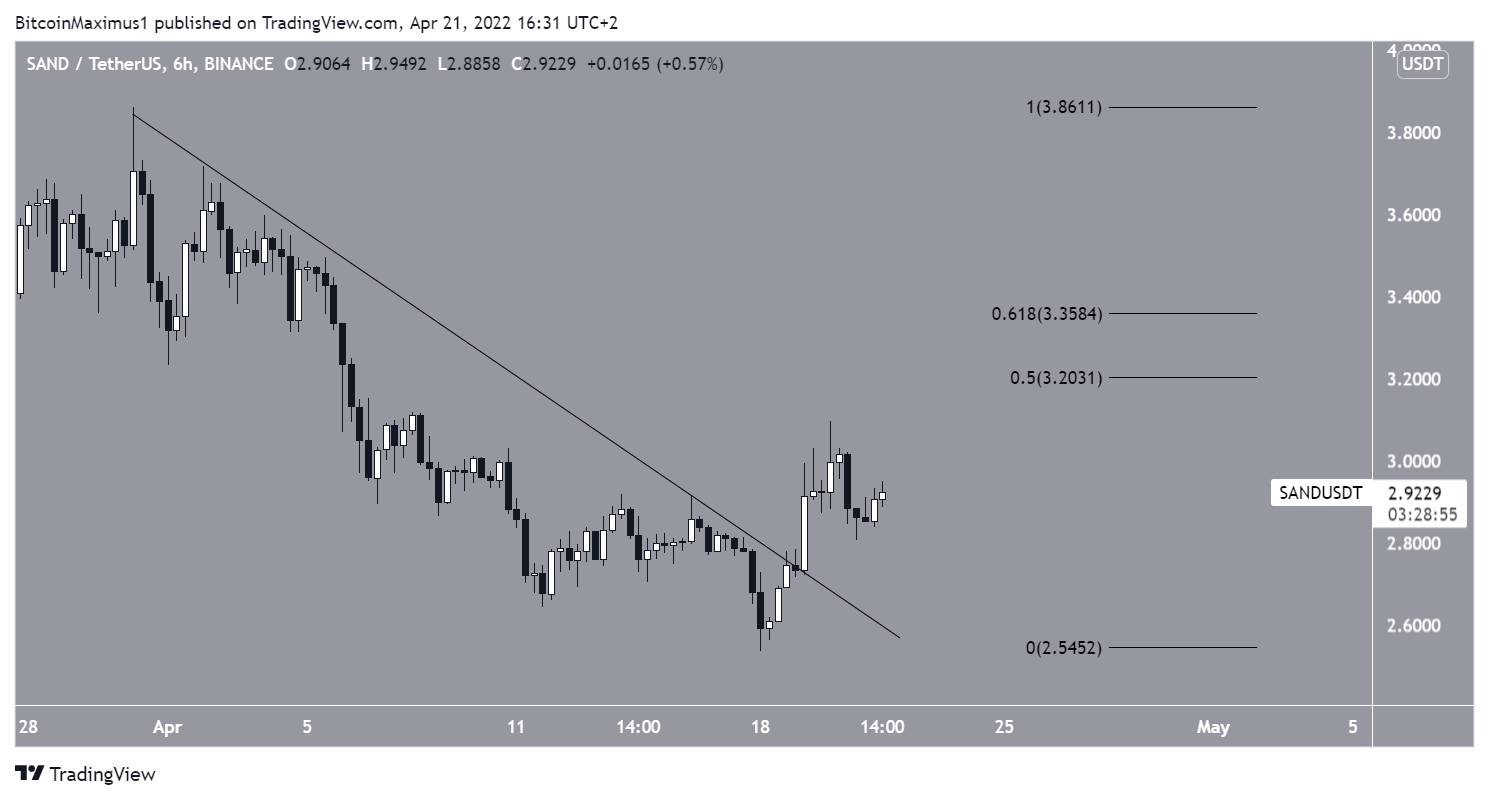
The six-hour time frame shows that SAND has broken out from a short-term descending resistance line .
If the short-term upward movement continues, the closest resistance would be between $3.20 – $3.35.
This is the 0.5 – 0.618 Fib retracement resistance area.
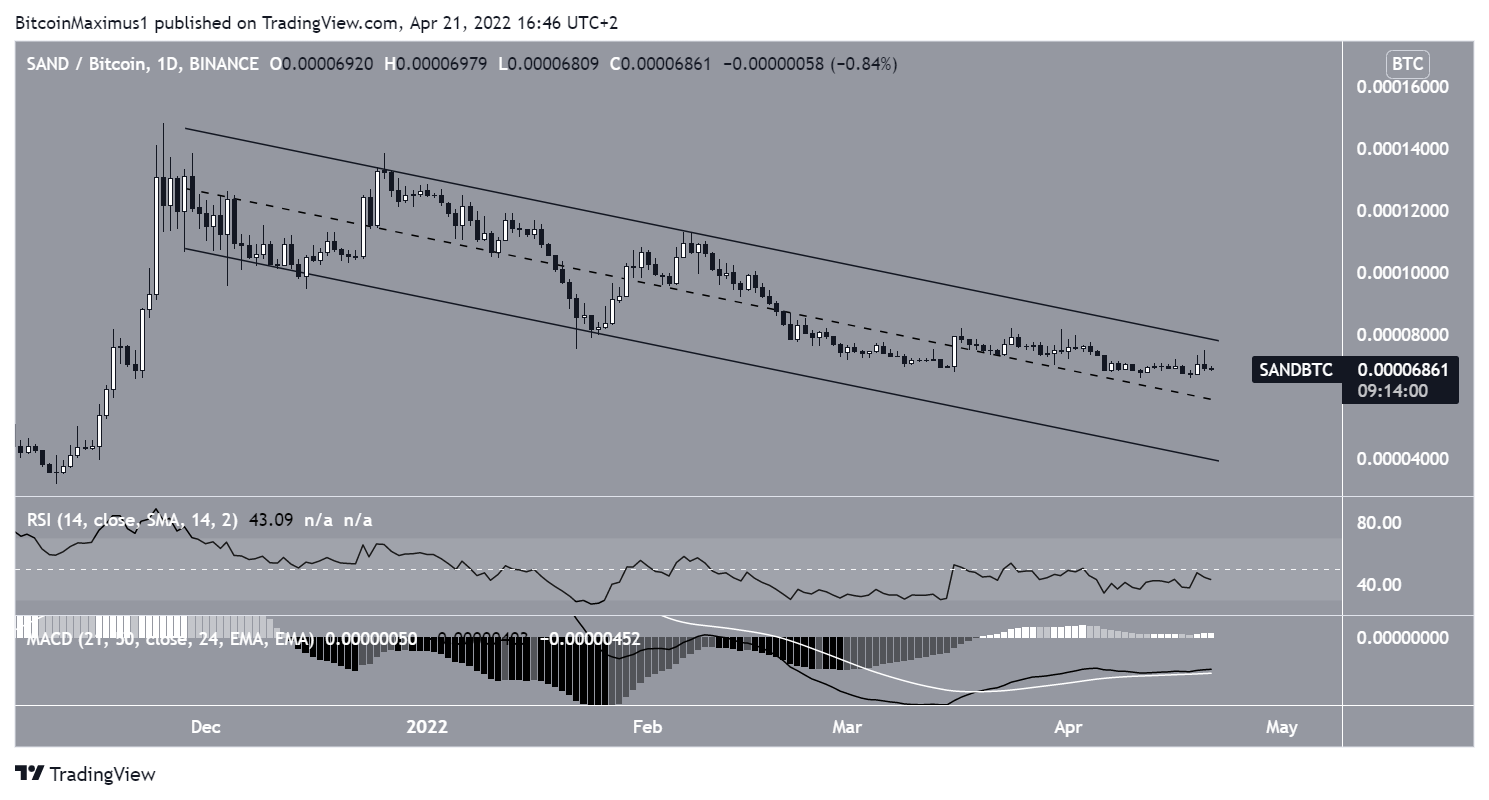
SAND/BTC
Similarly to the USD pair, SAND/BTC provides a fairly neutral reading.
The price is trading inside a descending parallel channel, which is considered a corrective pattern.
However, both the RSI and MACD are neutral/bearish.
Whether the price breaks out from the channel or falls below its mid line, will likely determine the direction of the future trend.
For Be[In]Crypto’s latest Bitcoin (BTC) analysis, click here.
What do you think about this subject? Write to us and tell us!


