


The Sandbox (SAND) broke out from a short-term resistance level on March 27 and created its first higher high since Feb.
SAND TECHNICAL ANALYSIS: BREAKOUT FROM DESCENDING RESISTANCE LINE! | Coin Of The Week – YouTube
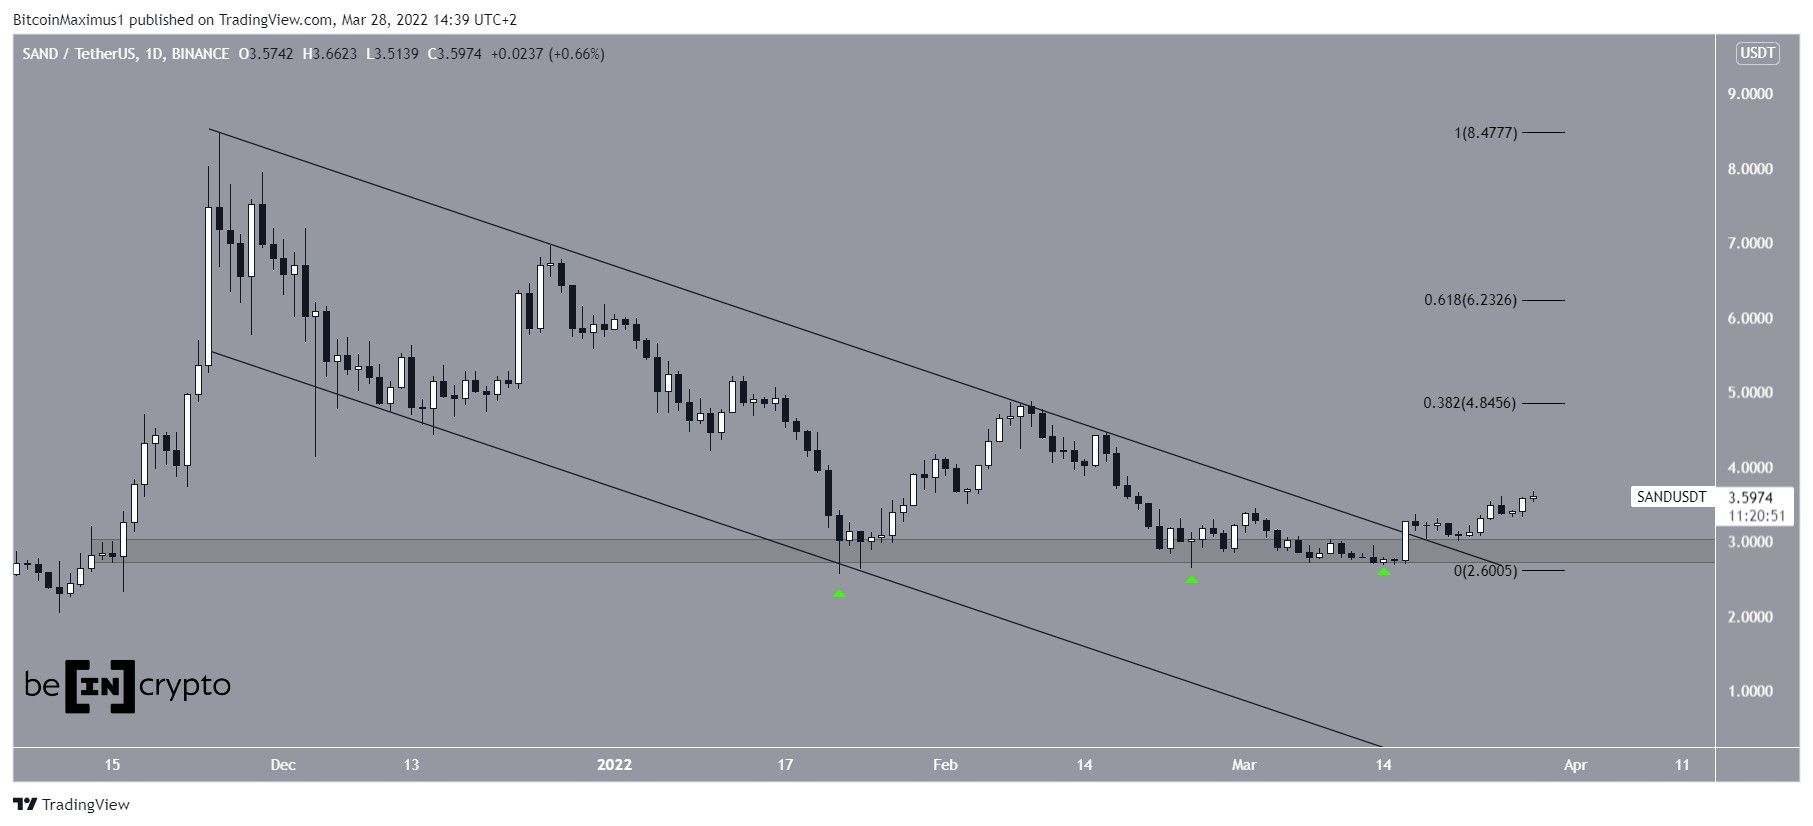
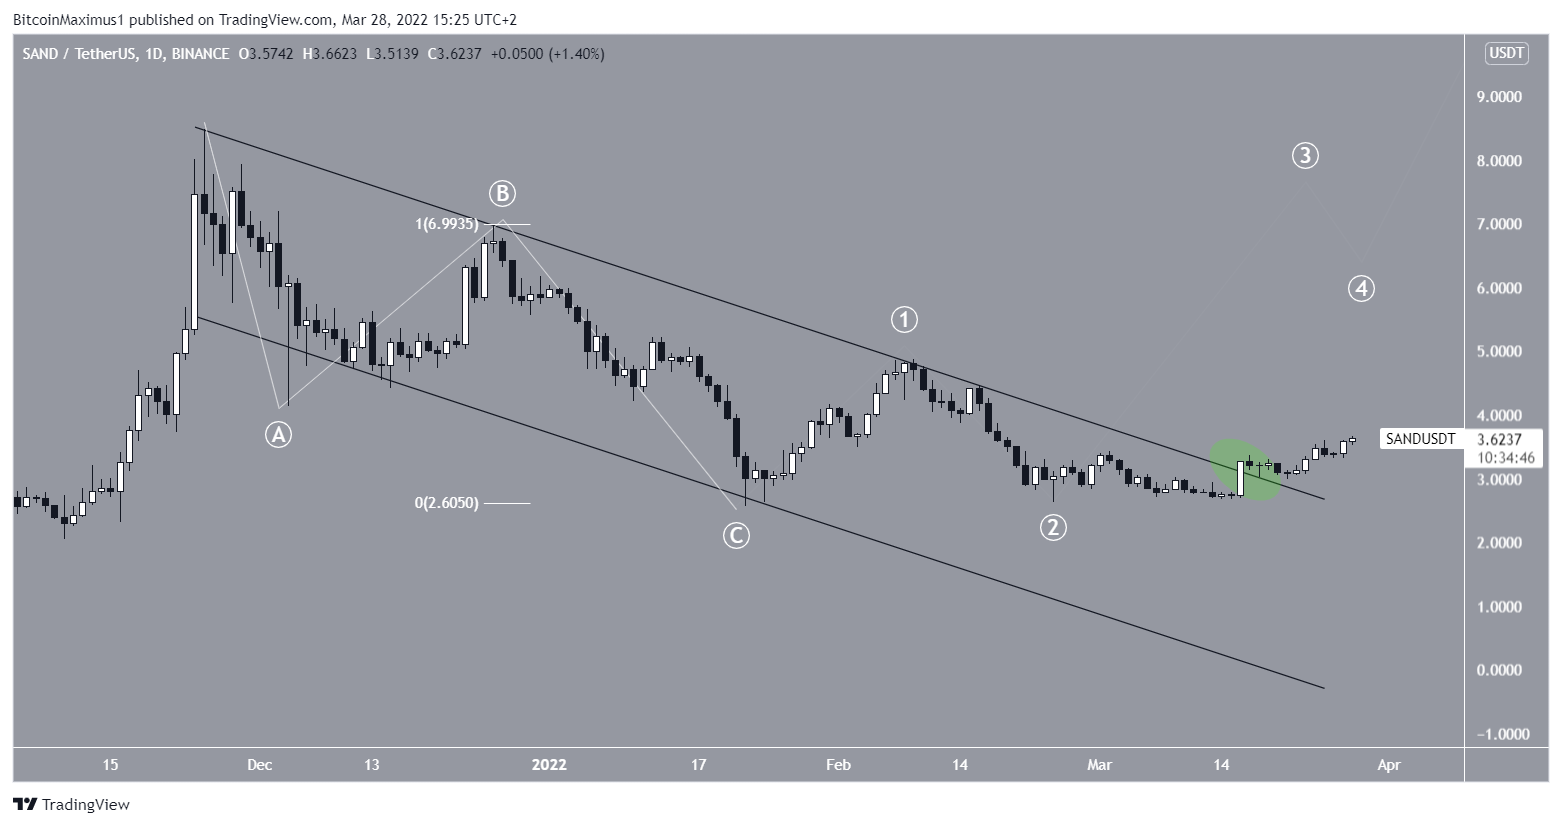
SAND has been falling inside a descending parallel channel since reaching an all-time high price of $8.48 on Nov 25. The downward movement led to a low of $2.55 on Jan 22 (green icon). The low and ensuing bounce served to validate the $2.90 area as support.
Afterward, the price returned to the same level twice more, on Feb 24 and March 14, respectively. This created what resembles a triple bottom, which is considered a bullish pattern
The price has been increasing since and broke out from the channel on March 16.
If the SAND upward movement continues, the next closest resistance levels would be at $4.85 and $6.25. These are the 0.382 and 0.618 fib retracement resistance levels, respectively.
Future SAND movement
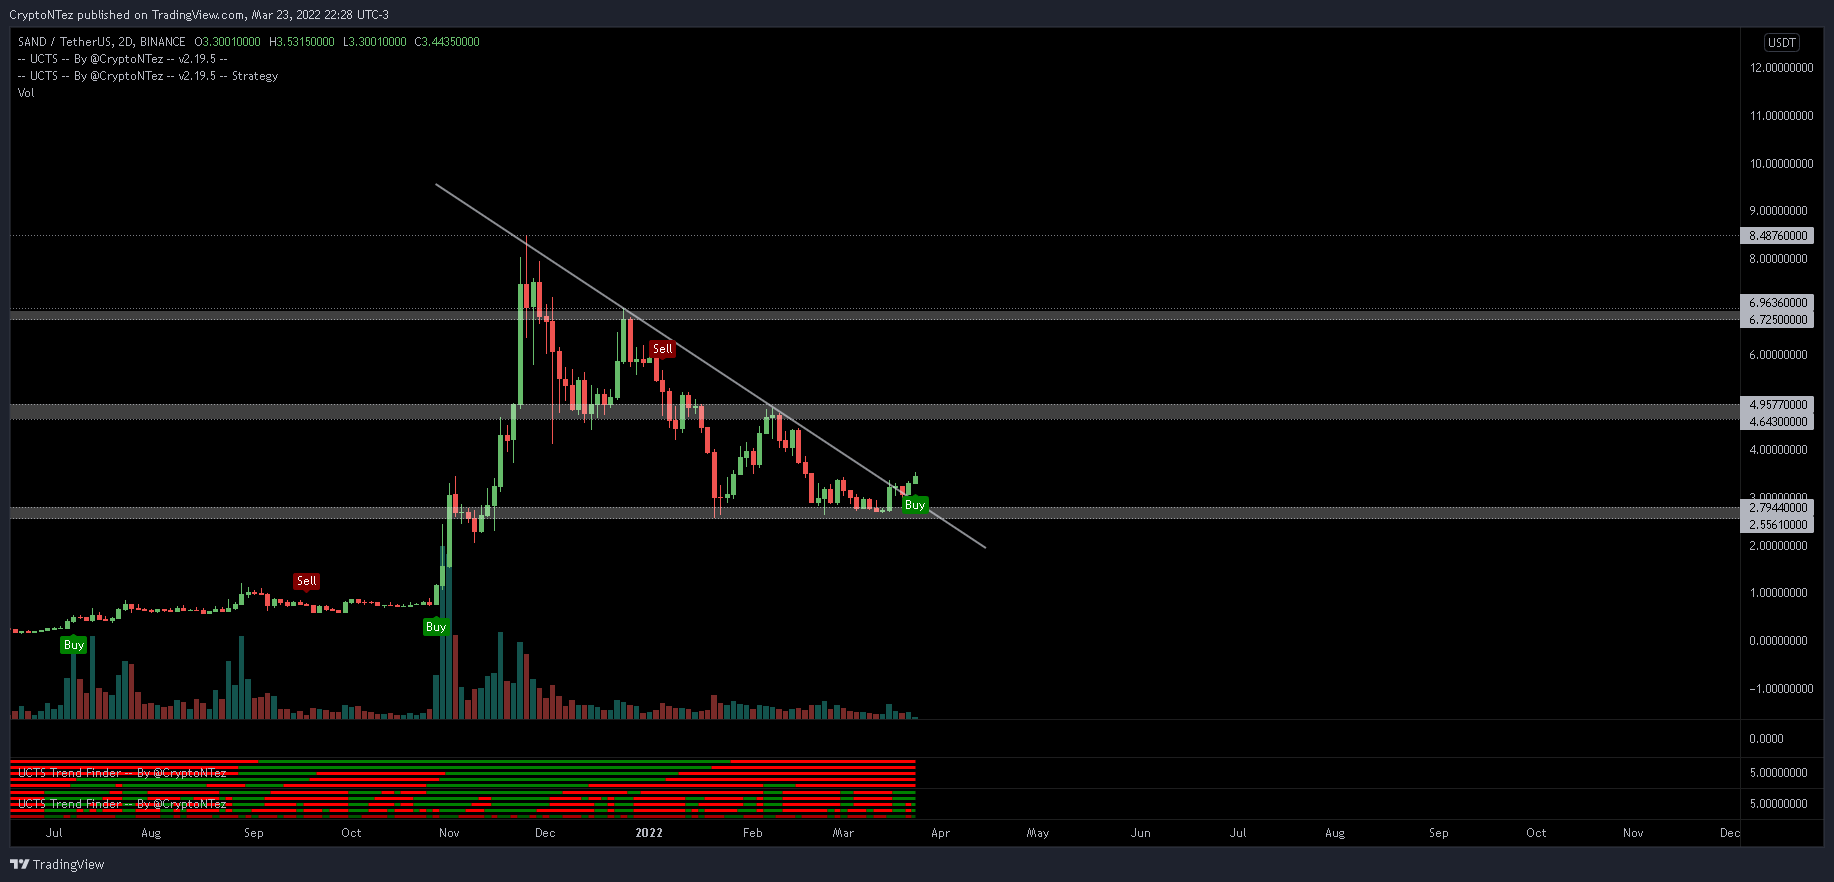
Cryptocurrency trader @CryptoNTez tweeted a chart of SAND, stating that the price could soon initiate a strong upward movement.
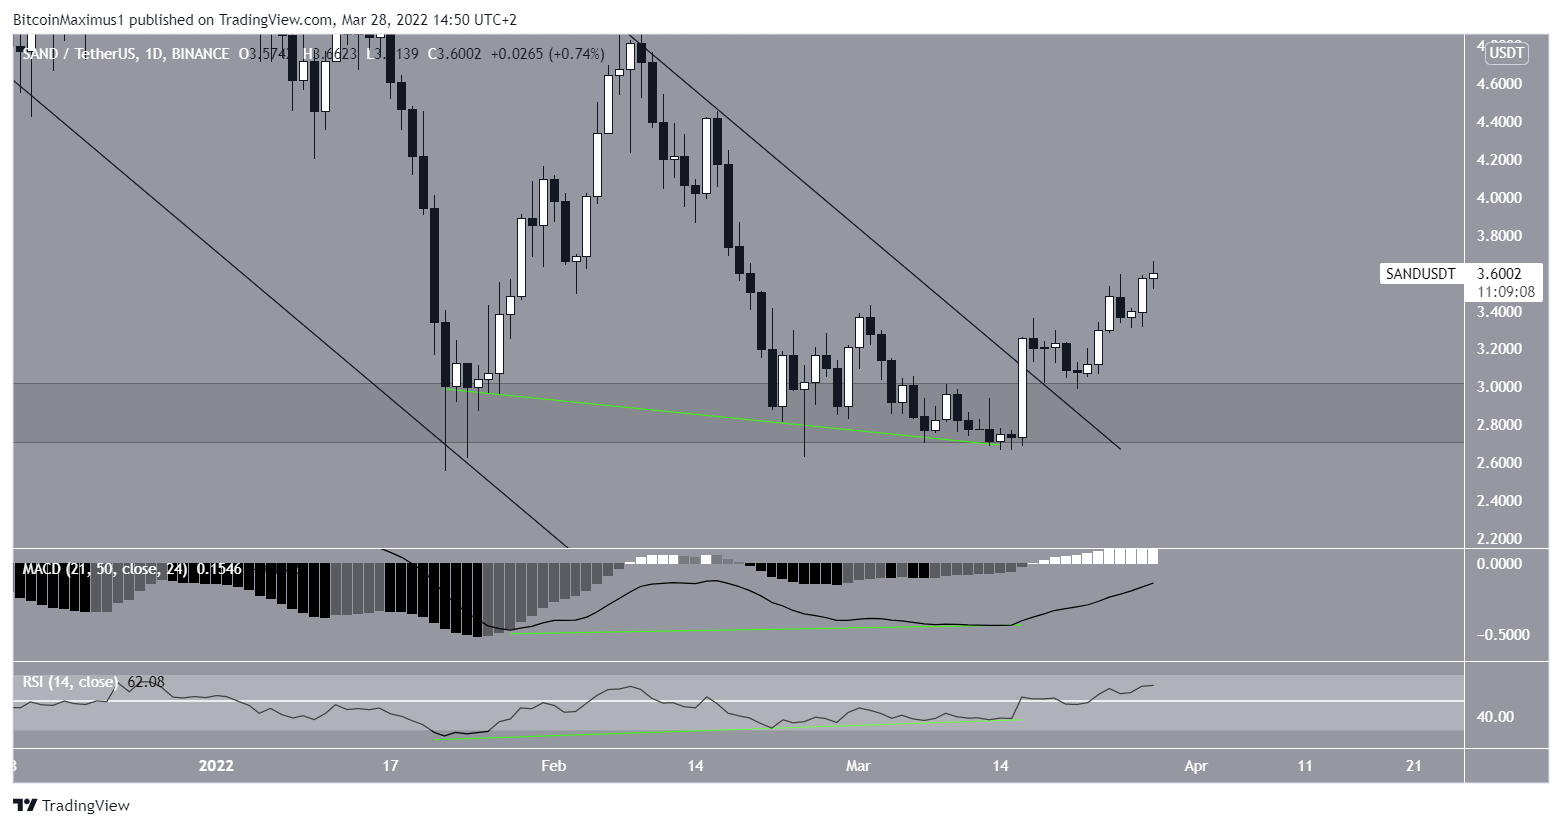
Technical indicators support the possibility of upward movement continuing. This is visible by the considerable bullish divergences that have developed in both the RSI and MACD (green lines).
Such divergences often precede bullish trend reversals, as was the case with the breakout from the long-term channel.
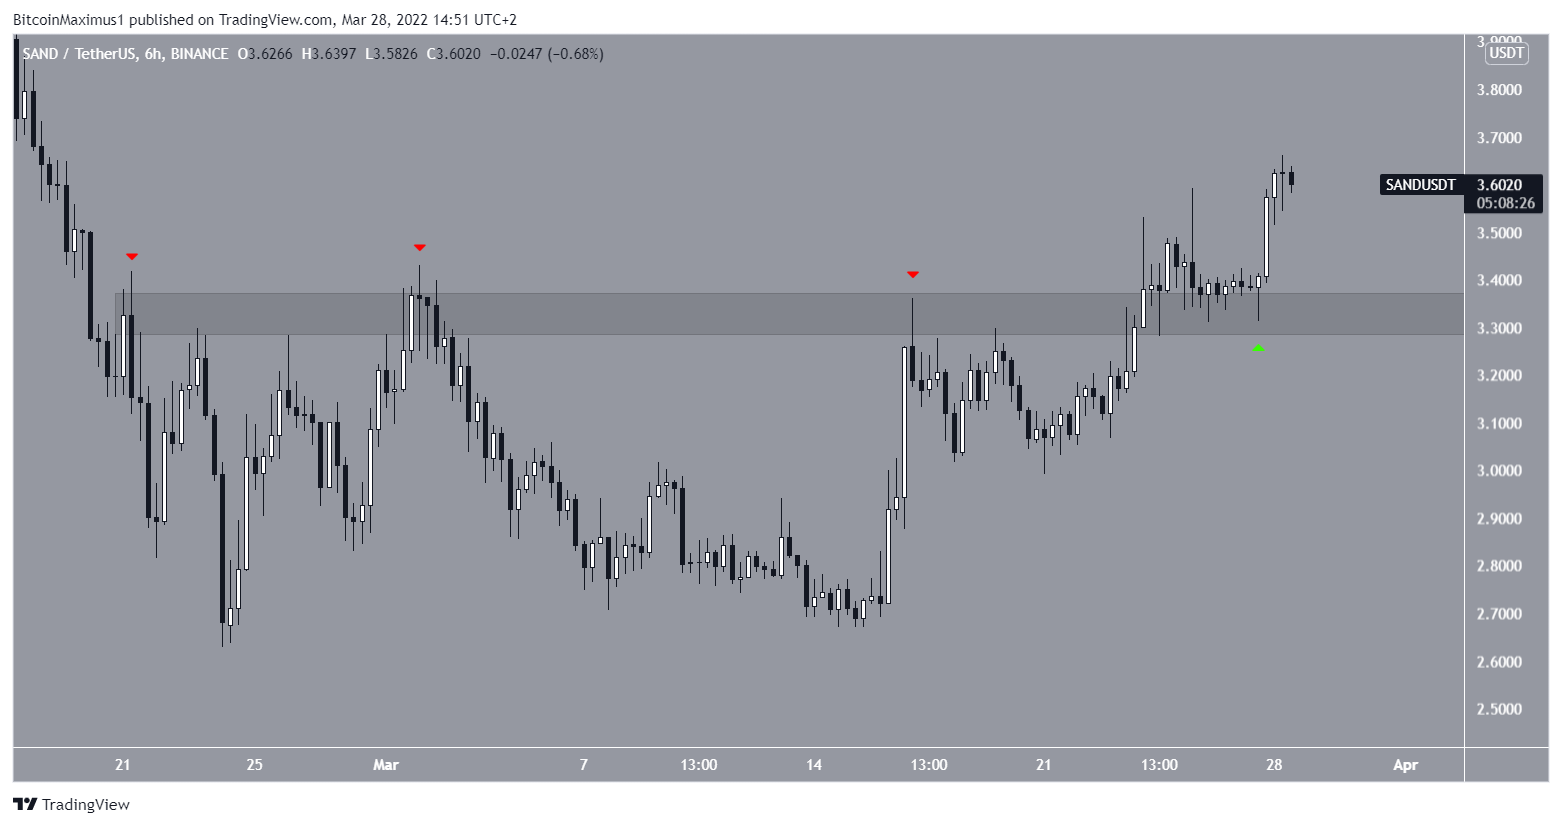
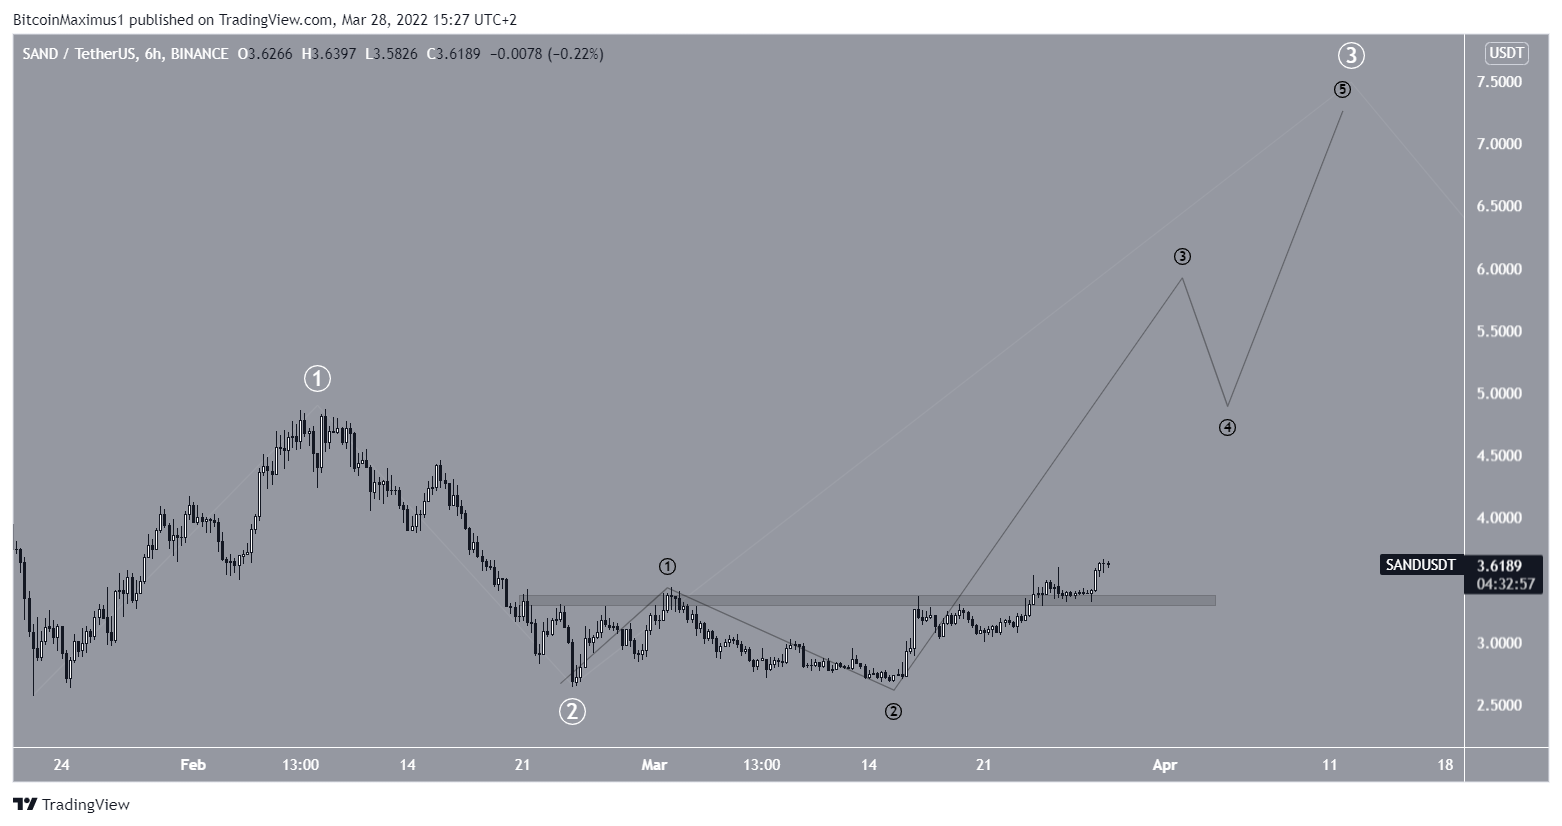
Furthermore, the six-hour chart supports this assessment, since it shows that SAND has broken out from and validated the $3.35 horizontal area as support.
Therefore, the short-term structure is also bullish.
Wave count analysis
The wave count suggests that SAND has completed an A-B-C corrective structure (white) when measuring from the aforementioned all-time high.
In it, waves A:C had an exactly 1:1 ratio, which is common in such structures.
If correct, SAND began a new bullish impulse on Jan 22.
The breakout from the parallel channel also supports this possibility.
The short-term movement suggests that SAND is currently in sub-wave three (black) of wave three (white).
Therefore, if the price manages to hold on above the $3.45 area, the rate of increase would be expected to accelerate.
For BeInCrypto’s previous Bitcoin (BTC) analysis, click here


