


In this article, we’ll look at the eight coins that have decreased the most over the past seven days (Feb. 26 – Mar. 5).
They are:
- 1Inch (1INCH) – 19.80%
- Voyager Token (VGX) – 16.68%
- Fantom (FTM) – 15.63%
- Solana (SOL) – 10.83%
- Ravencoin (RVN) – 7.75%
- Celsius (CEL) -7.29%
- Avalanche (AVAX) – 6.45%
- Huobi Token (HT) – 5.31%
1inch (1INCH)
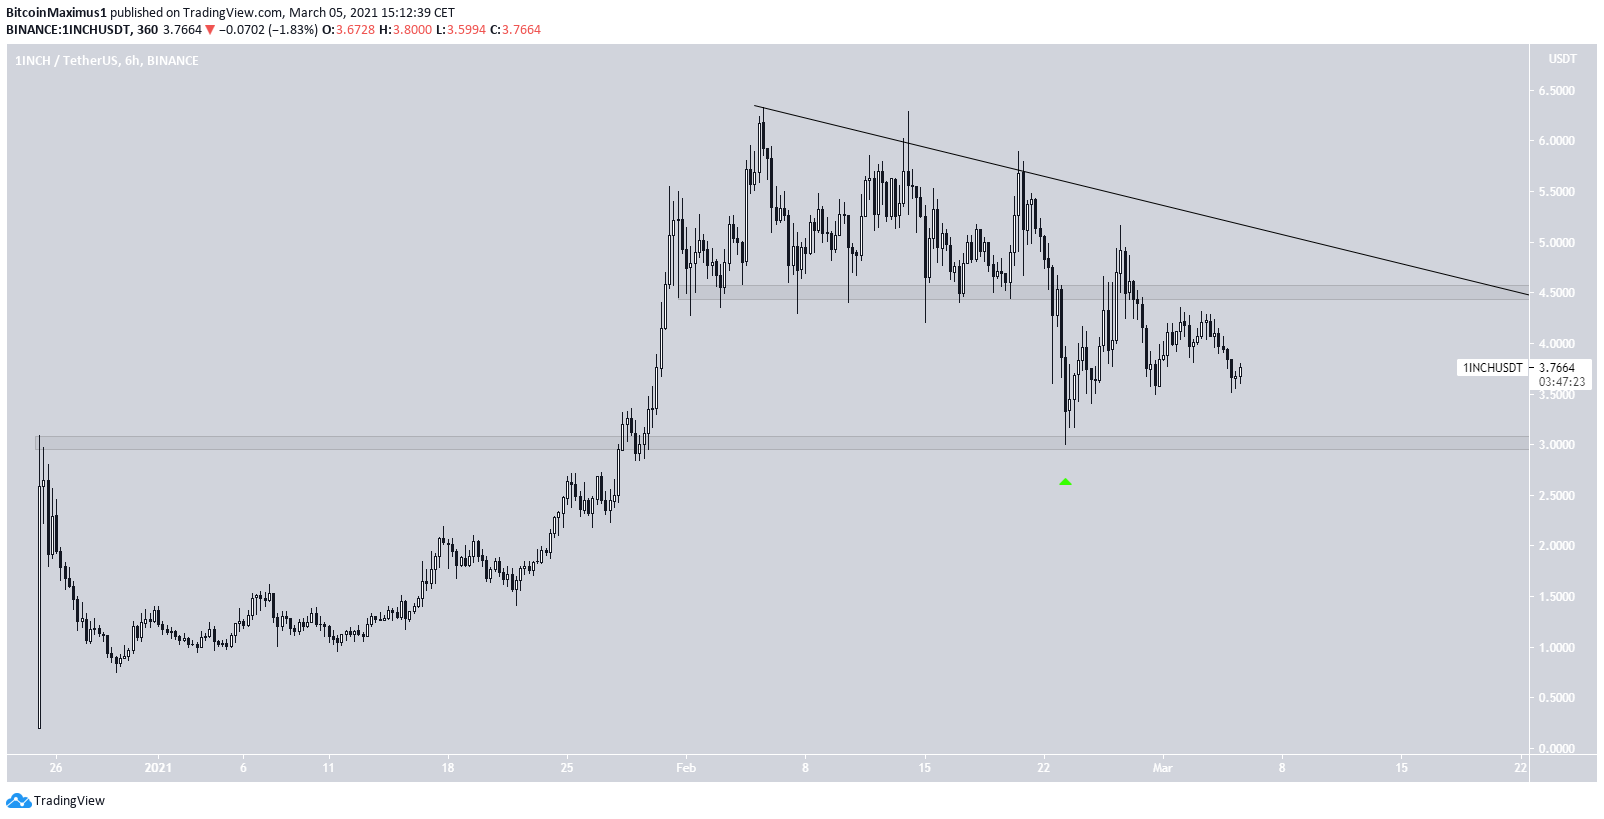
1INCH has been decreasing since Feb. 5, when it reached a high of $6.33. The drop has been gradual, accelerating slightly once 1INCH broke down below the $4.50 area, which is now expected to act as resistance.
After the drop, 1INCH bounced at the $3 support area on Feb. 23 and has been moving upwards since.
Despite the ongoing bounce, a reclaim of the $4.50 resistance area and the descending resistance line would confirm that the trend is bullish. This would likely lead to a new all-time high price.
Voyager Token (VGX)
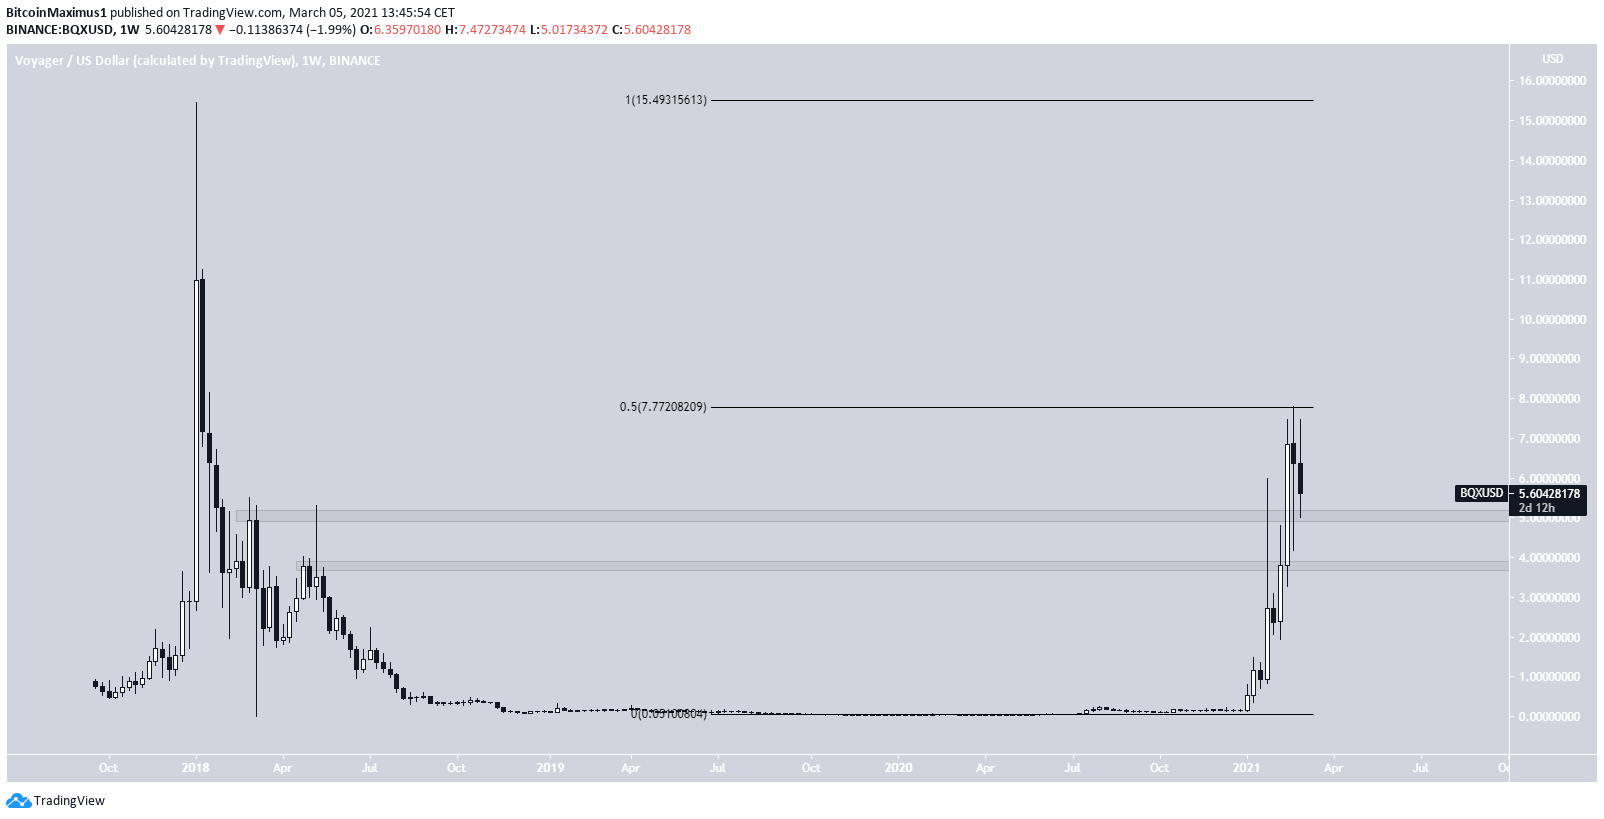
VGX has been decreasing since Feb. 25, when it reached a high of $7.81. The decrease created a long upper wick, and validated the 0.5 Fib retracement level, found at $7.77 as resistance.
Despite the drop, VGX has bounced at the $5 support area, and could potentially trade in a range between $5-$7.77.
A breakdown could take VGX all the way down to the next support area at $3.80.
Fantom (FTM)
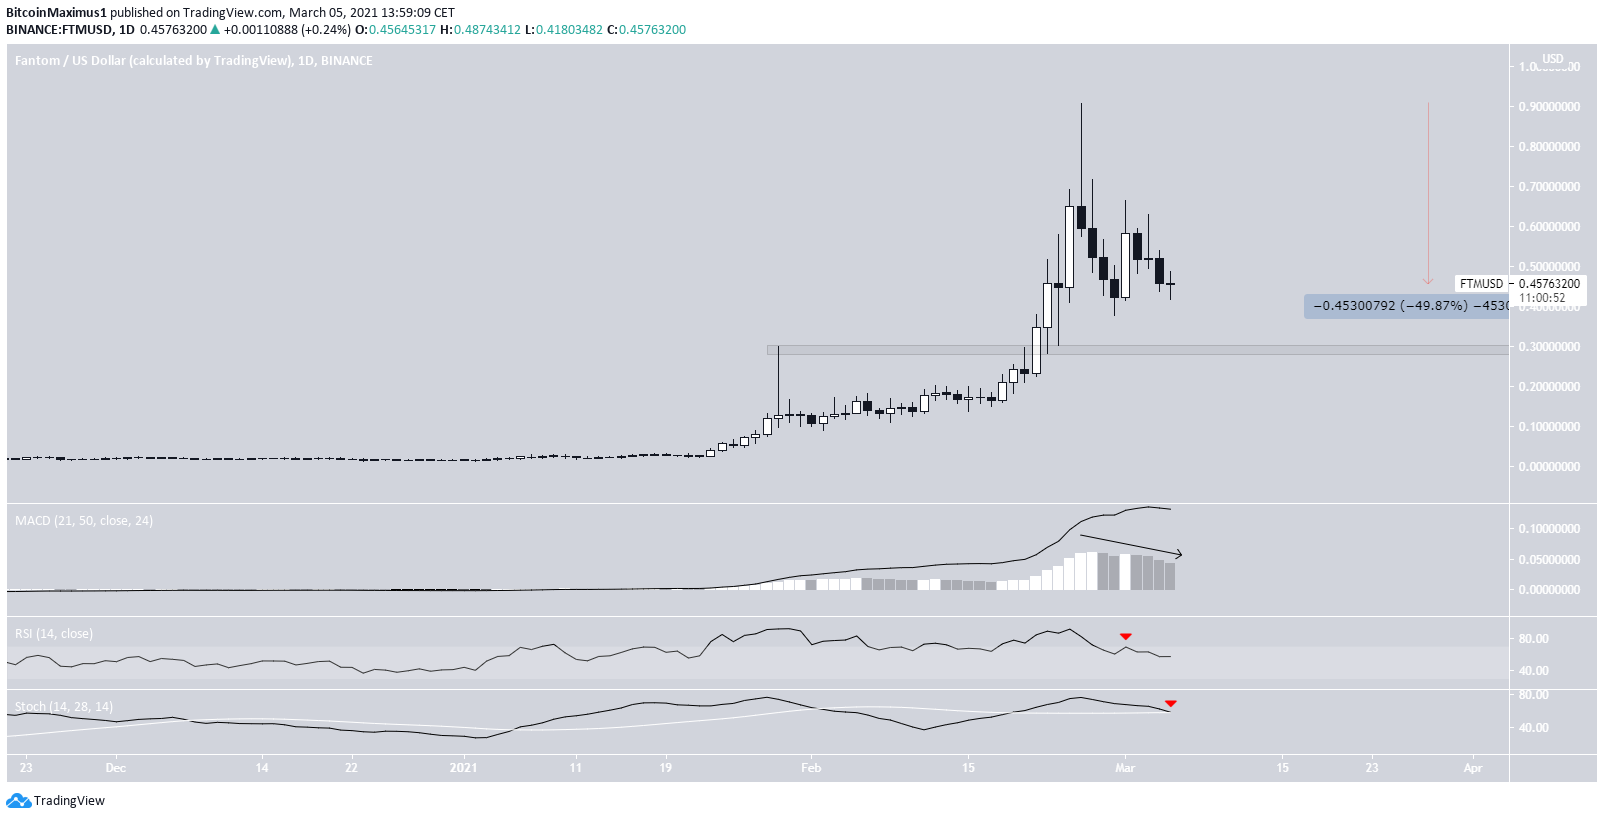
FTM has been decreasing since reaching an all-time high price of $0.,90 on Feb. 25. Since then, it has dropped by 50%, currently trading at $0.45.
Despite the significant drop, there are no signs of a bullish reversal nor a bounce. On the contrary, the Stochastic oscillator has made a bearish cross, symbolizing that the trend is bearish.
The next closest support area is found at $0.30.
Solana (SOL)
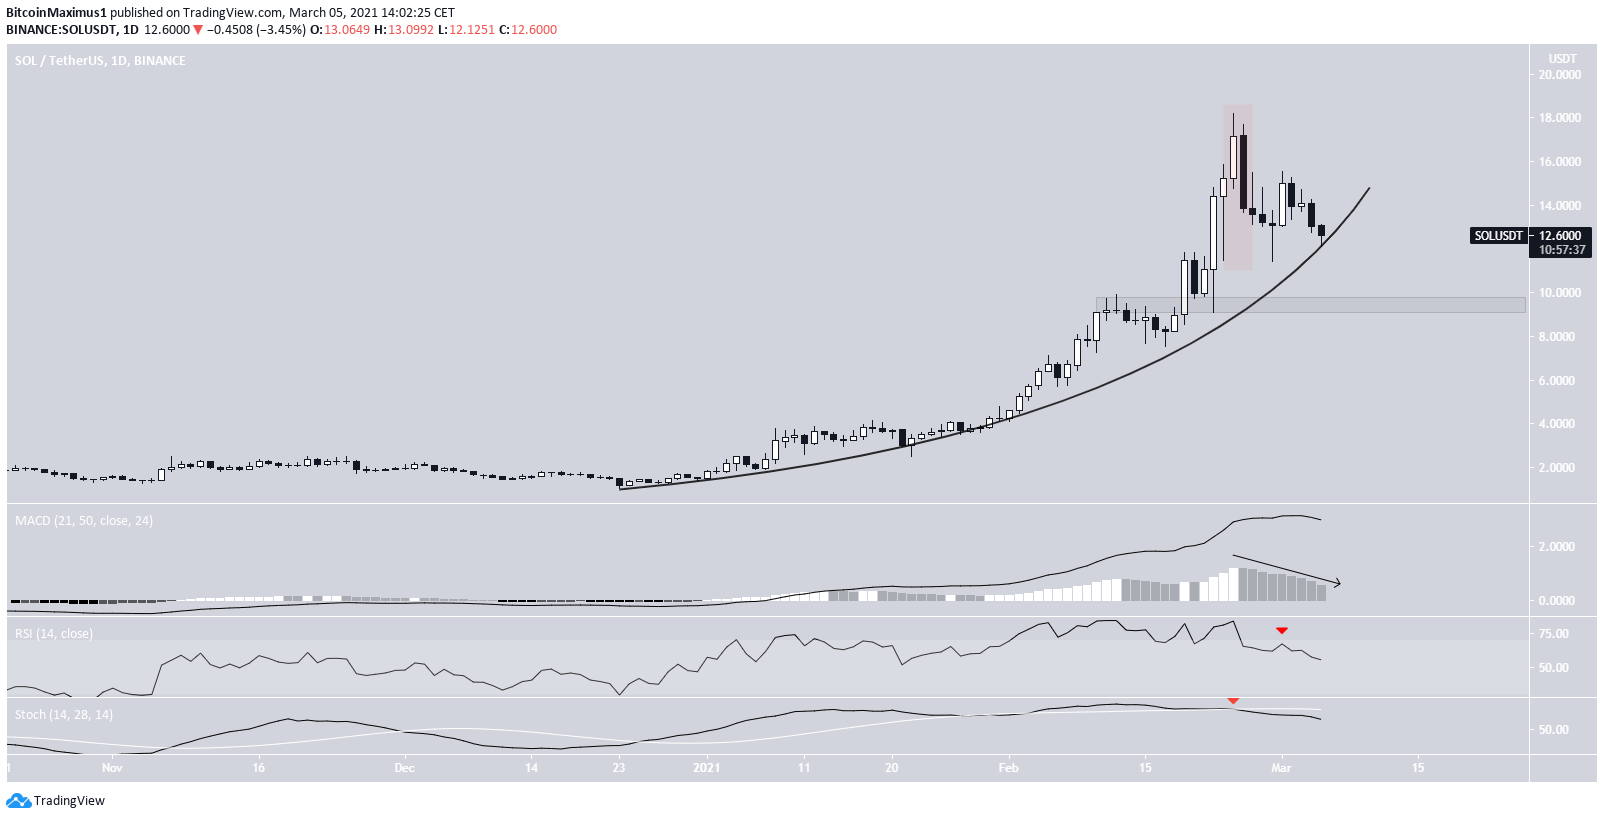
SOL has been decreasing since Feb. 24, when it reached an all-time high price of $18.20.
It created a bearish engulfing candlestick the next day and has been falling since.
Similar to FTM, technical indicators are bearish.
Furthermore, SOL is in the process of breaking down from a parabolic ascending support line, which, if confirmed, could take SOL towards the closest support at $9.50.
Ravencoin (RVN)
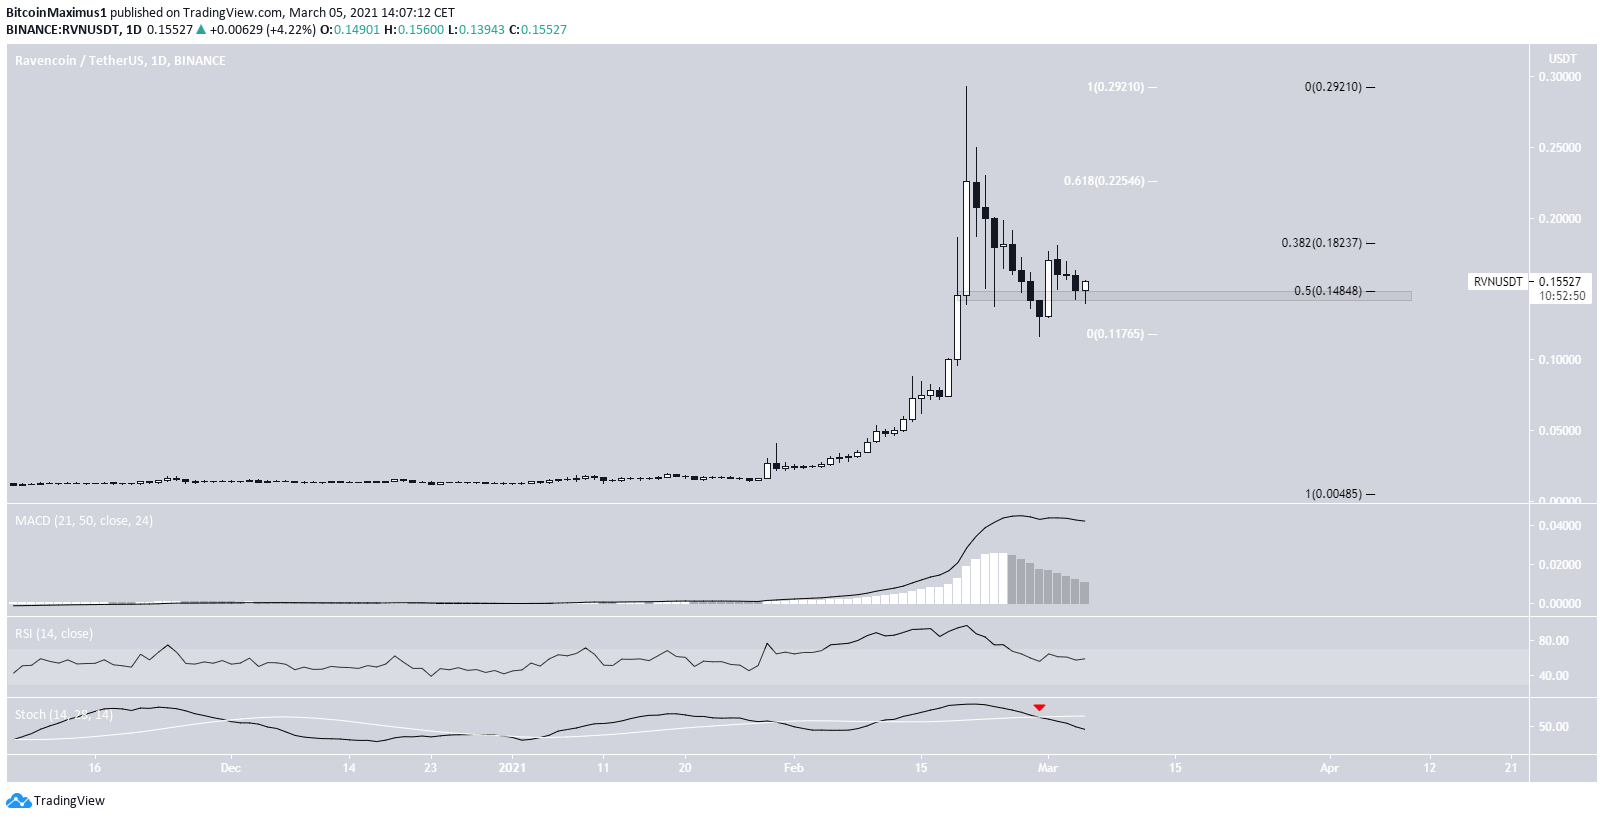
RVN has been decreasing since reaching a high of $0.29 on Feb. 20. The drop took it to a low of $0.11 eight days later, but RVN bounced immediately afterward.
Despite the bearish cross in the Stochastic oscillator and the decreasing MACD/RSI, RVN has reclaimed the $0.148 area. This is a horizontal support level and the 0.5 Fib retracement (black) of the entire upward move.
Therefore, its reclaim is a strong bullish sign, suggesting that RVN could move upwards towards the closest resistance at $0.225 (white).
Bittorrent (BTT)
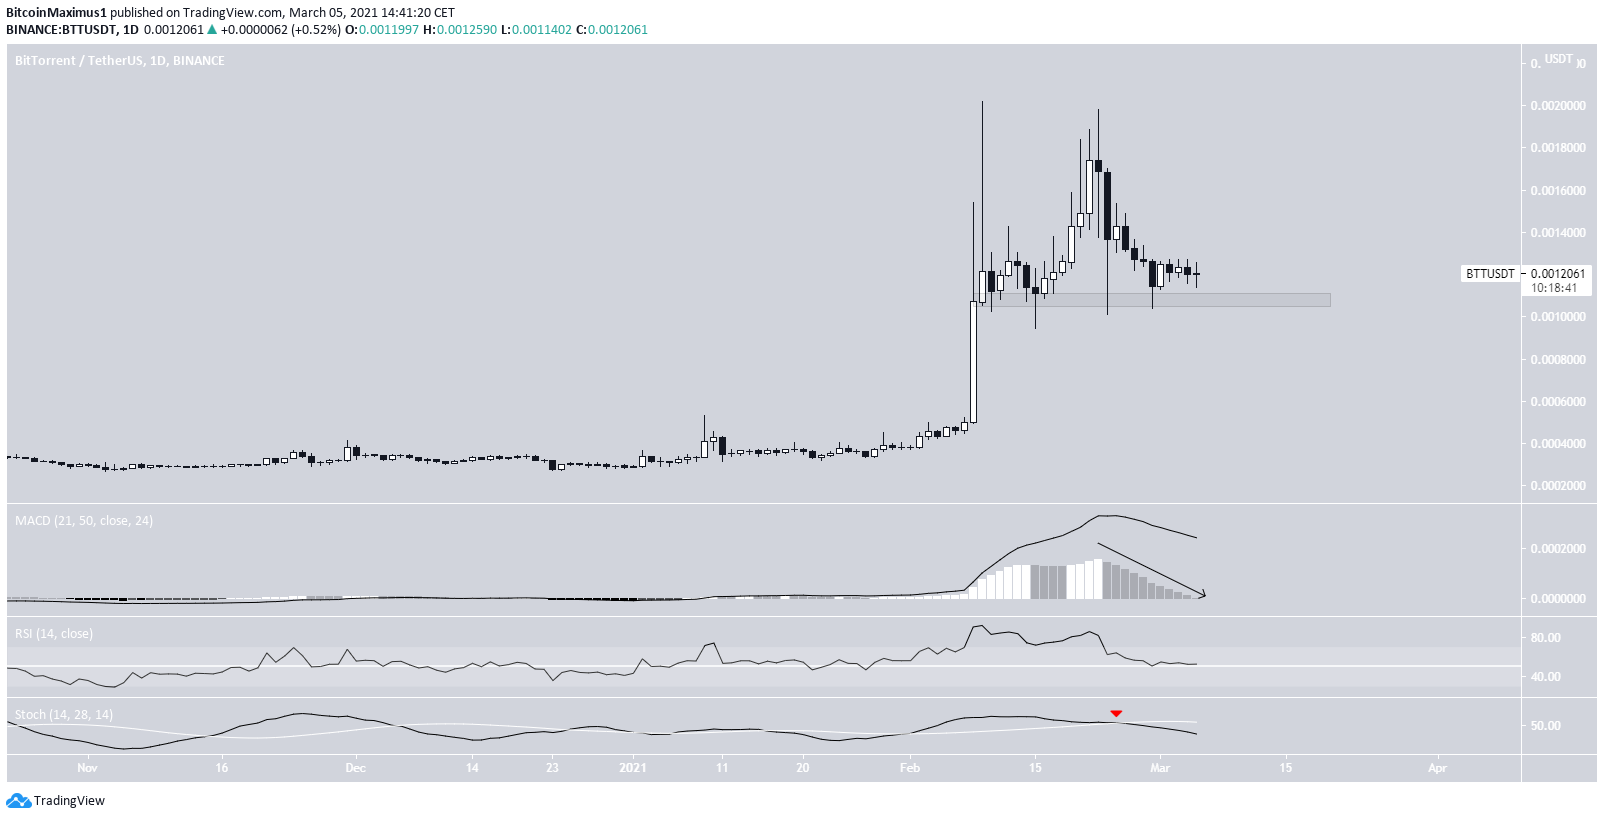
BTT reached an all-time high price of $0.002 on Feb. 9. After a short-term drop, it created a double top pattern near the same high on Feb 22 and has fallen since.
However, it is trading above support at $1.1. As long as it is doing so, the possibility of a bounce remains high.
Nevertheless, technical indicators are firmly bearish, as evidenced by the bearish cross in the Stochastic oscillator and decreasing MACD.
Therefore, even if BTT bounces, it would likely eventually lead to another lower low.
Avalanche (AVAX)
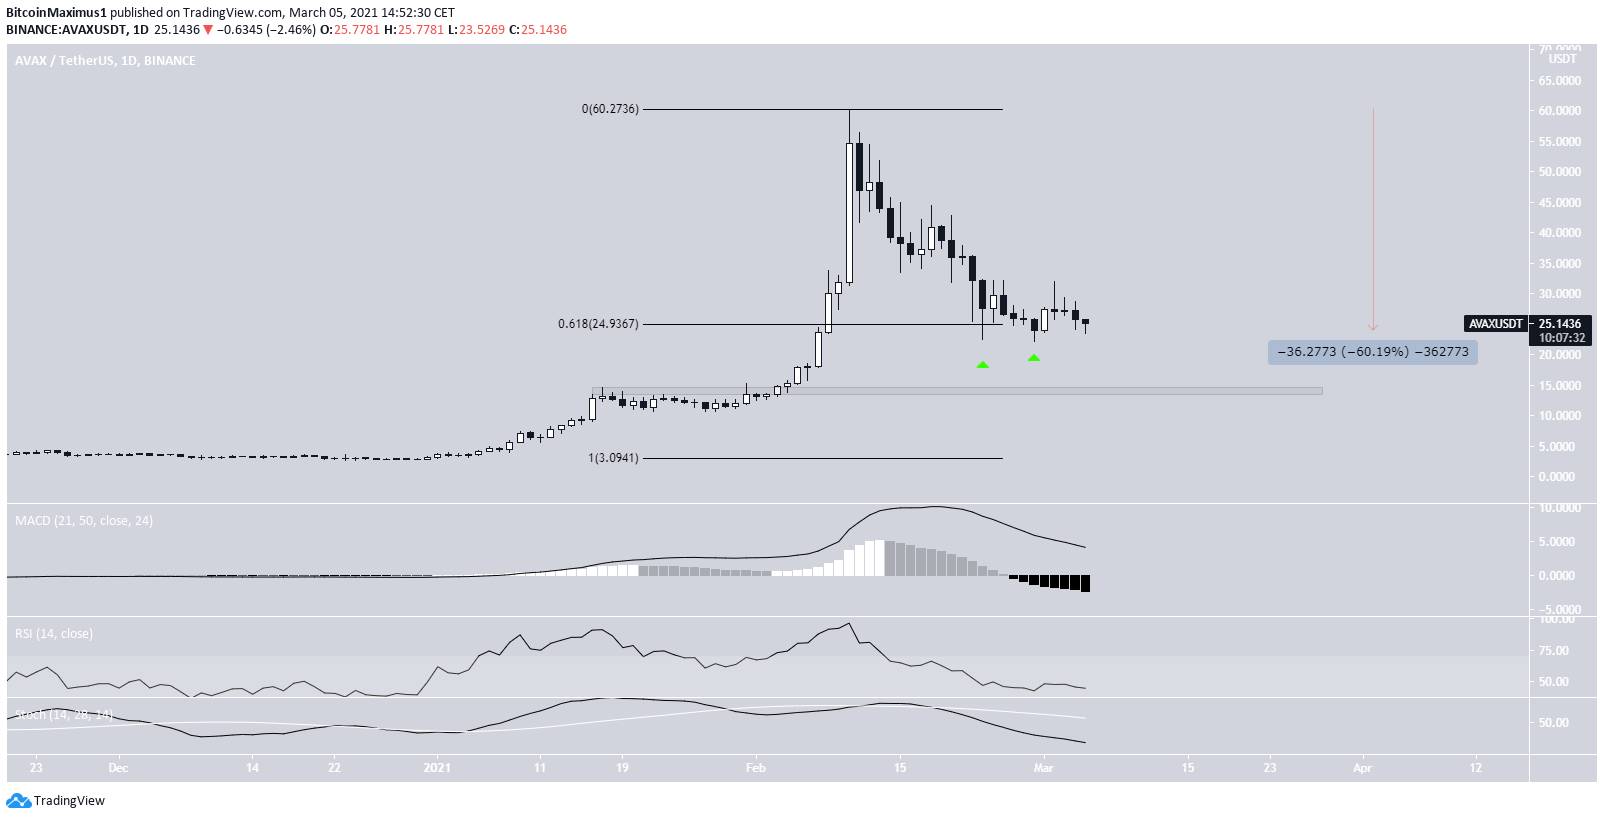
AVAX has also been decreasing since Feb. 10, when it reached an all-time high price of $60. So far, it has dropped by a full 60%.
However, AVAX is trading right at the 0.618 Fib retracement level of the most recent upward movement. However, it has touched the level thrice, and the lack of a bounce is not a good look for the bulls.
Furthermore, technical indicators are bearish, thus another drop could take AVAX all the way down to $14.
Huobi Token (HT)
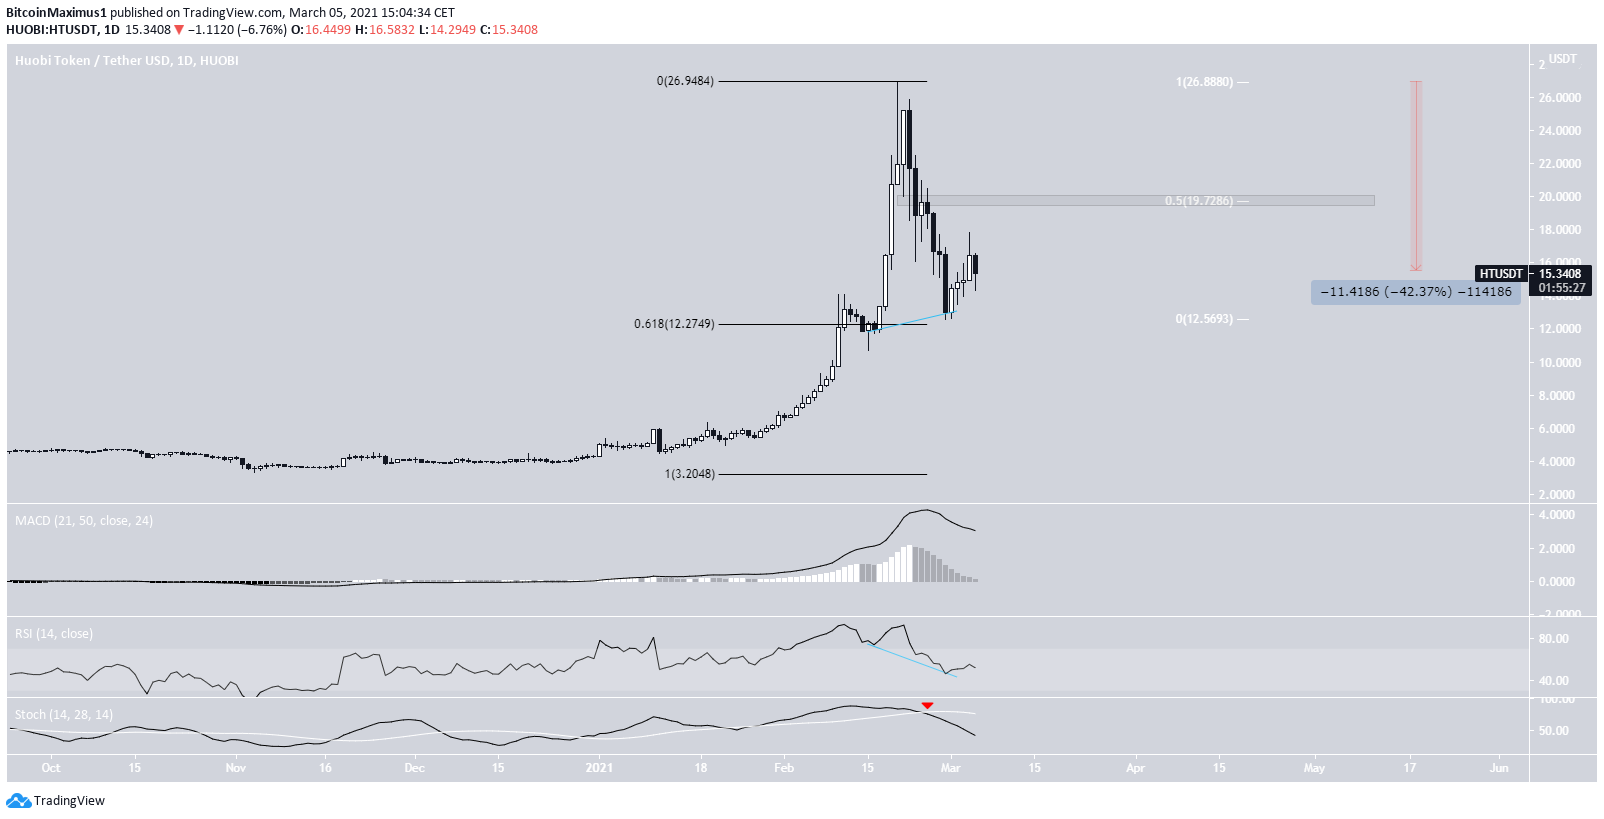
HT has been decreasing since Feb. 20, when an all-time high price of $26.89 was reached on Feb. 20. Currently, it is 42% below its all-time high price.
However, HT bounced at the 0.618 Fib retracement level on Mar. 1 and has been increasing since. The bounce was preceded by hidden bullish divergence in the RSI, a strong sign of trend continuation.
Therefore, HT could increase towards the closest resistance area at $19.72. Its reclaim would be required for the trend to be considered bullish.
For BeInCrypto’s latest Bitcoin (BTC) analysis, click here.


