


The Graph (GRT) has increased only incrementally in July but is showing preliminary signs that often precede sharp upward movements.
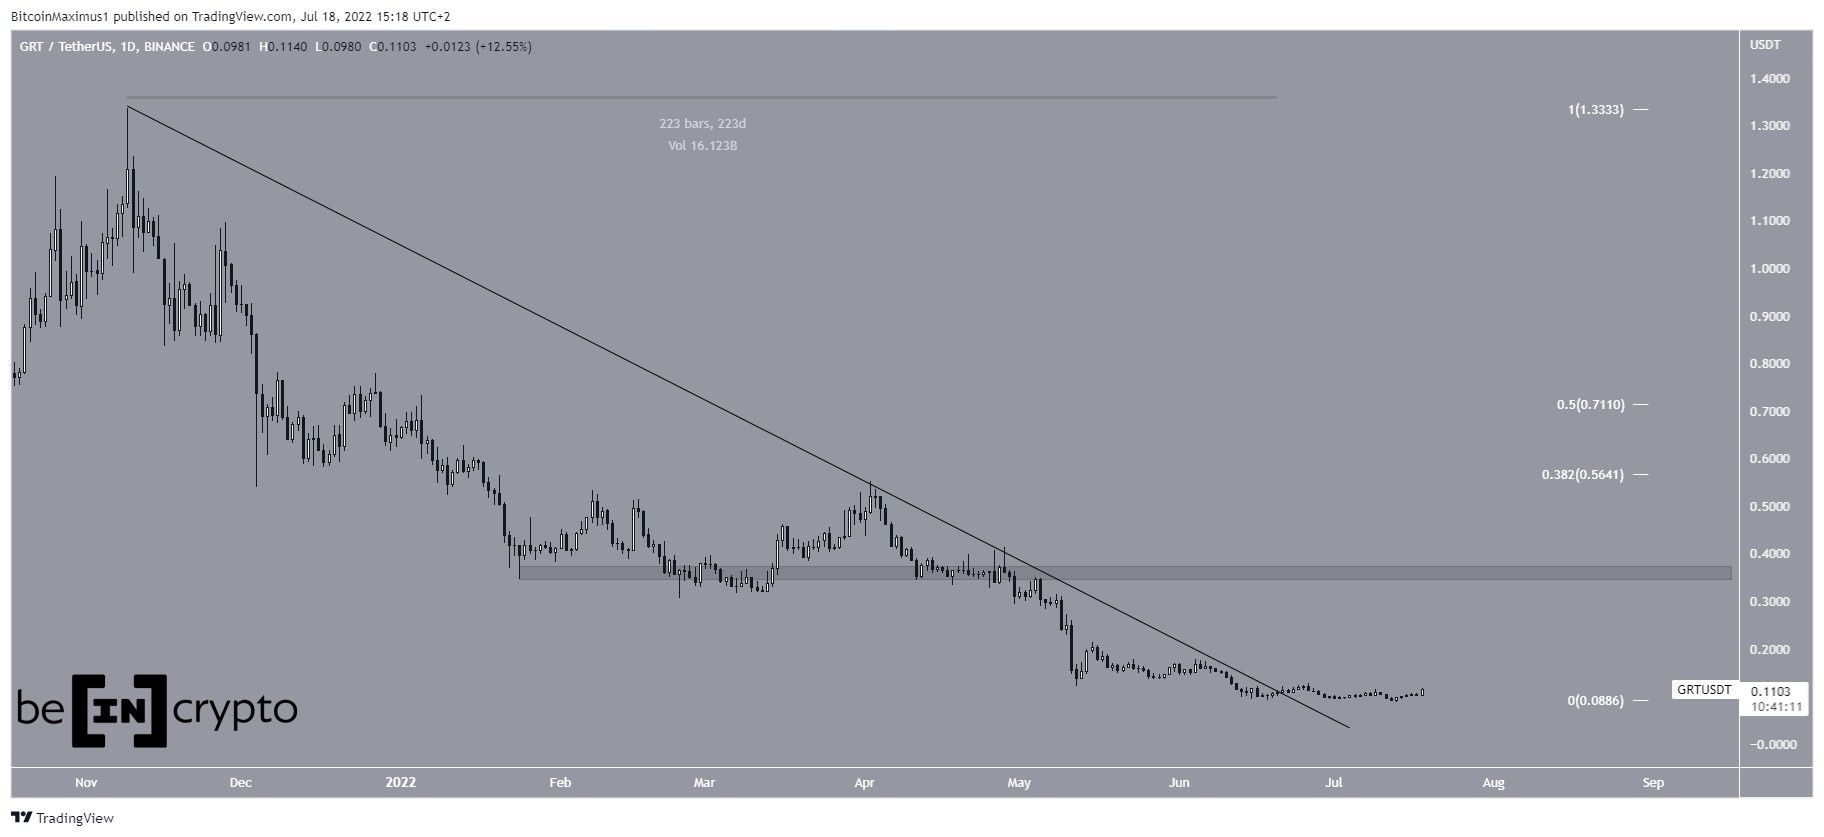
GRT had been decreasing underneath a descending resistance line since Nov. 2021. The downward movement led to a low of $0.089 in June 2022.
However, the price bounced shortly afterward and broke out from the line after five days. At the time of the breakout, the line had been in place for 223 days. Despite the breakout, it did not initiate any sort of significant upward movement and has been hovering close to $0.1 since.
The closest resistance is at $0.36. This is a horizontal resistance area that had previously acted as support. If the price is successful in moving above it, the next resistance would be at $0.54, created by the 0.382 Fib retracement resistance level.
Ongoing breakout
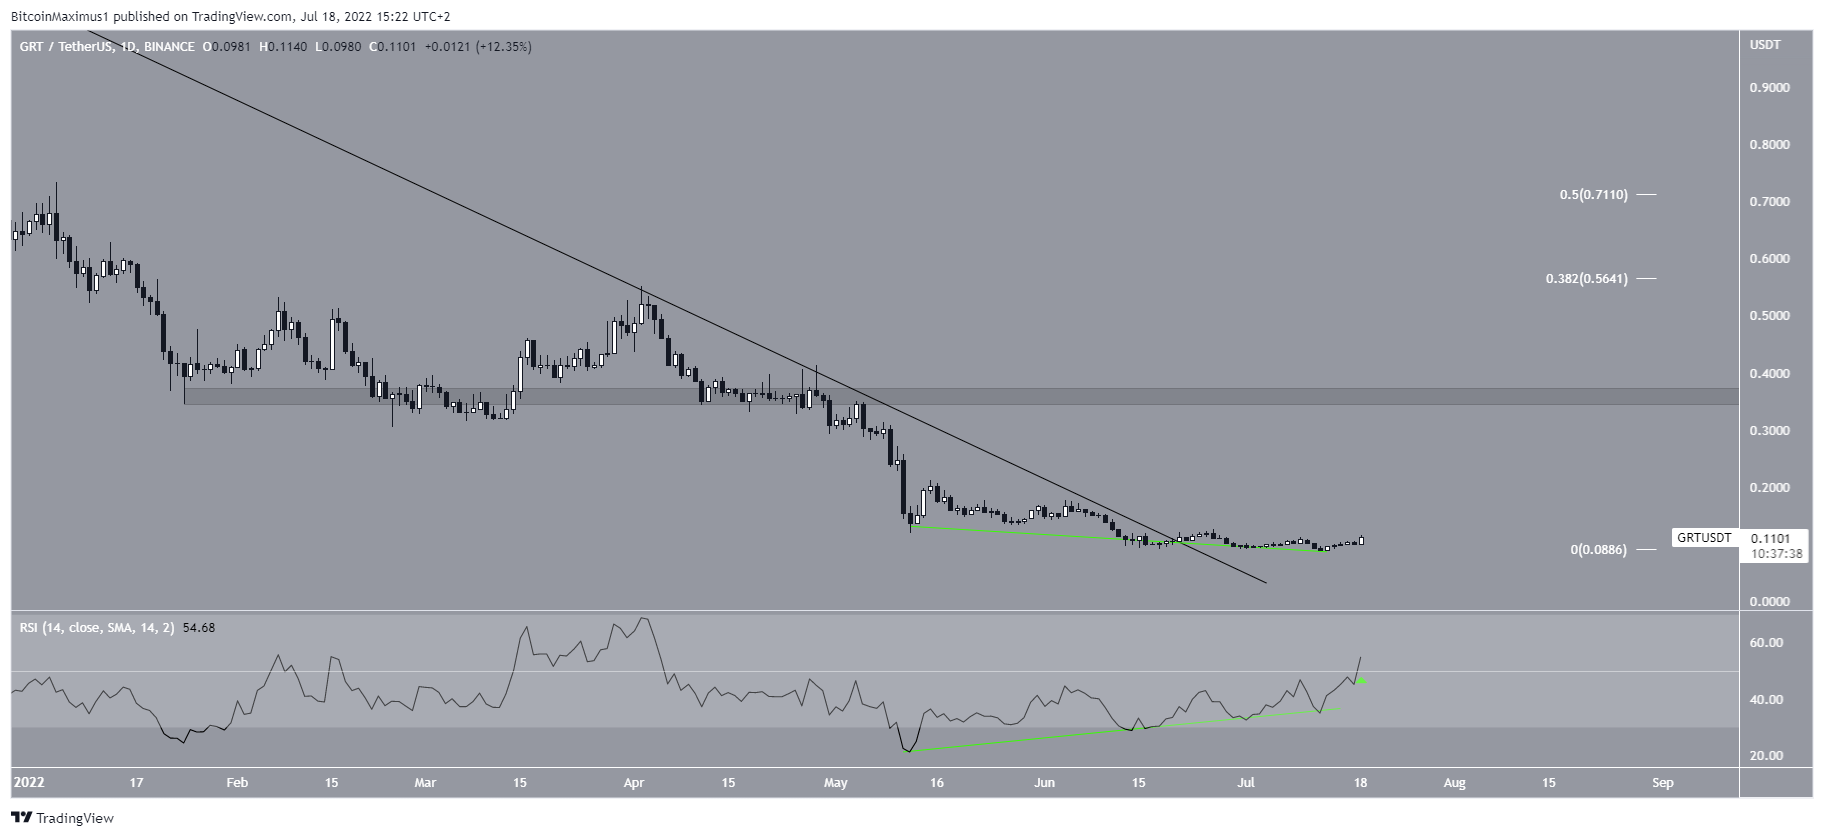
A closer look at the daily time frame supports the possibility of GRT initiating a very significant upward movement. There are two main reasons for this, both of which relate to the RSI.
The indicator has been generating bullish divergence over the past two months (green line). Furthermore, it has now moved above 50 (green icon). By doing so, it also completed a swing high pattern, which further increases the legitimacy of the bullish divergence. So, it is possible that the price will soon initiate a significant upward movement.
Short-term GRT movement
Cryptocurrency trader @isli_Stallard tweeted a chart of GRT, stating that the price could increase all the way to $0.27.
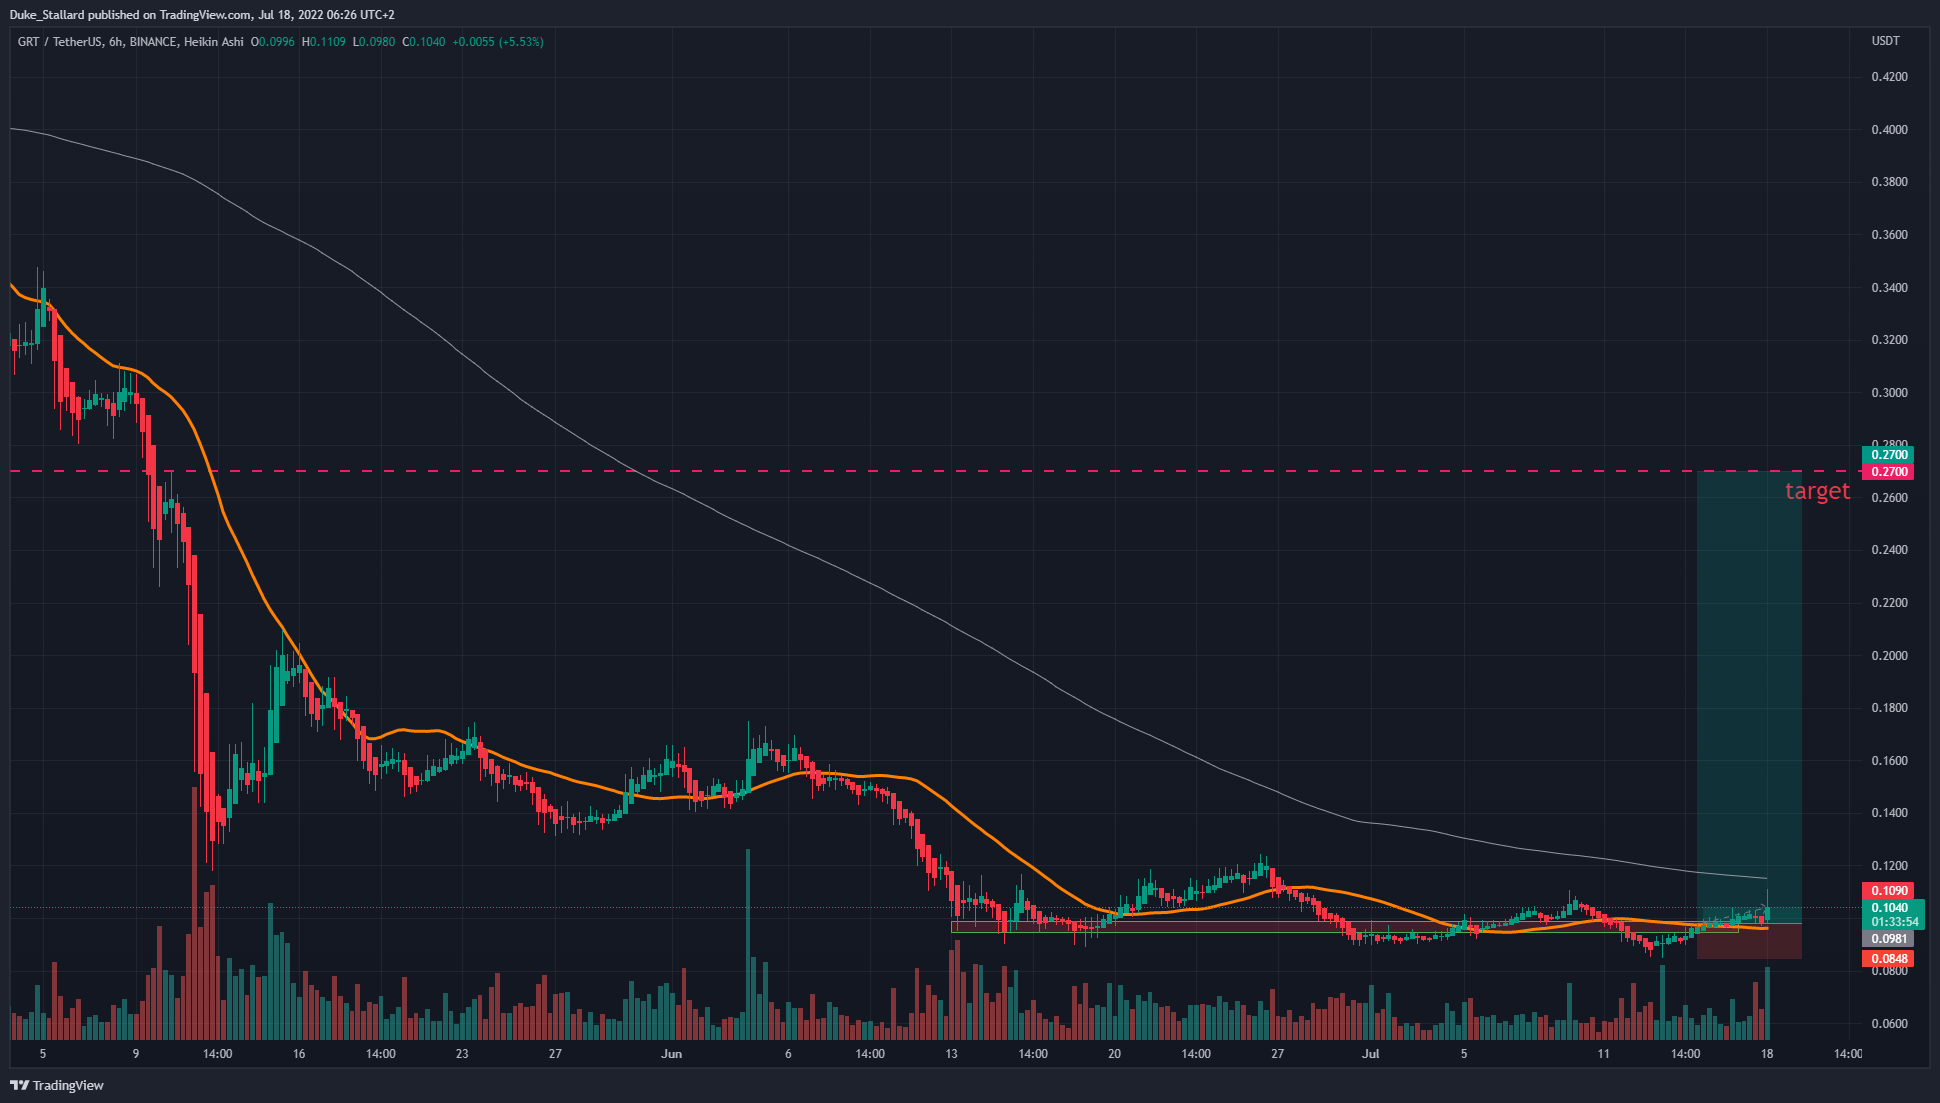
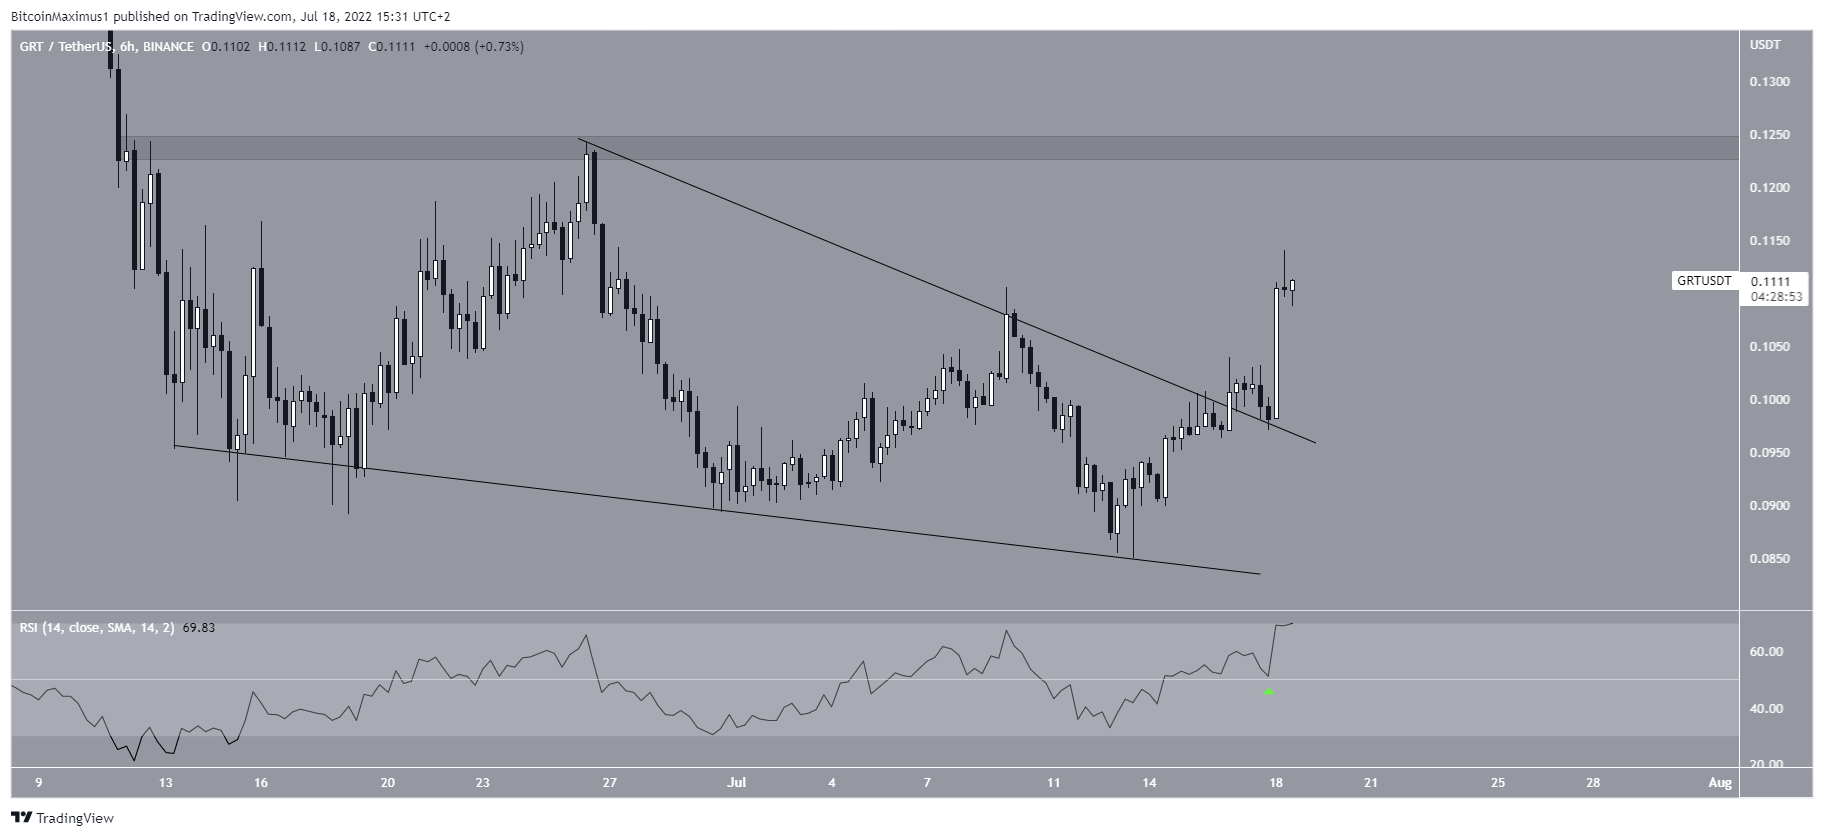
The six-hour chart also provides a bullish outlook, since it shows that the price has broken out from a descending wedge. The wedge is considered a bullish pattern, meaning that a breakout from it is the scenario that most often transpires. Furthermore, the RSI has moved above 50 in what is also considered a sign of a bullish trend.
However, there is minor resistance at $0.125 prior to the $0.27 area outlined in the tweet.
For Be[in]Crypto’s latest bitcoin (BTC) analysis, click here


