
In today’s article, BeInCrypto takes a look at the US Dollar Index and its correlation to BTC. Since the beginning of Bitcoin’s history, the two assets have mostly shown a negative correlation, which was clearly evident in the accelerated bull markets for BTC and subsequent declines.
Today, the US Dollar Index is approaching an important long-term resistance level that could initiate a bearish reversal. If this happens, it would be a very positive signal for Bitcoin to continue the bull market that began in 2020.
What is the DXY?
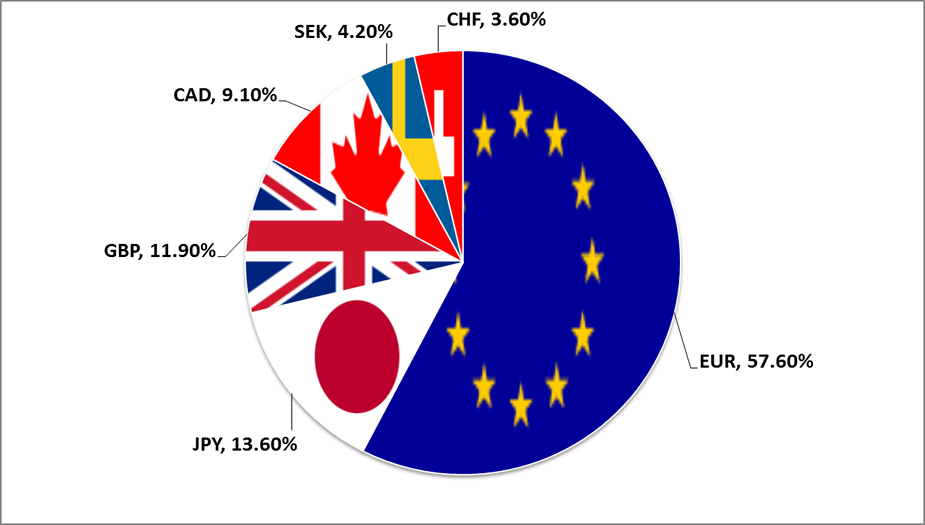
The US Dollar Index (DXY or “Dixie”) measures the value of the US currency (USD). It is calculated relative to a basket of geometrically weighted averages of the world’s 6 largest currencies: the euro (EUR), Japanese yen (JPY), British pound (GBP), Canadian dollar (CAD), Swedish krona (SEK) and Swiss franc (CHF).
The DXY began trading in 1973, starting at a value of 100. The index was established shortly after the Bretton Woods Agreement was dissolved. According to the agreement made in 1944, the world economies agreed to settle their balances in the US dollar, which was the reserve currency. This in turn was fully convertible into gold at a rate of $35 per ounce.
This is why the start of the US dollar index coincides with the abandonment of the gold standard. The dollar became a fiat currency, forex ceased to be controlled by governments, and the laws of the free market began to regulate currency exchange.
DXY approaches resistance level
Looking at the daily chart of the US Dollar Index in 2020-2021, we find several important resistance/support levels. Of course, the beginning of this period coincided with the global turmoil around the COVID-19 pandemic, which strongly affected the DXY. Initially, the dollar lost heavily and found a bottom at the support area at 94.5 (red line). However, by mid-March, it had already rallied to find resistance at 103 (orange circle).
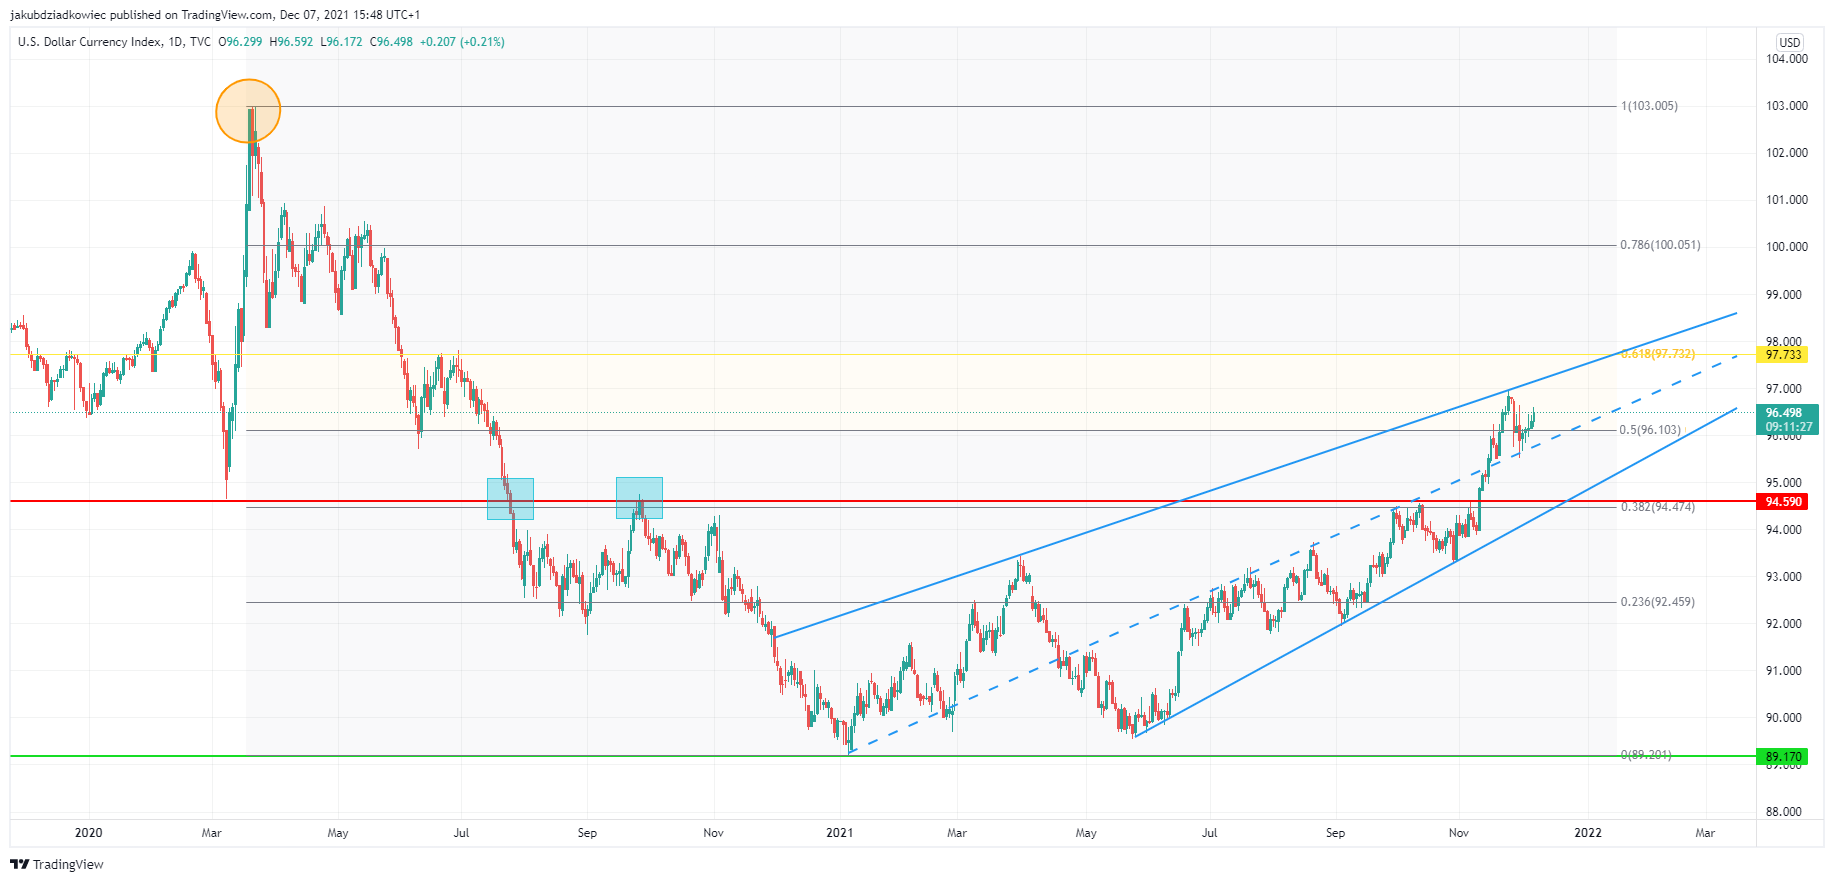
From this peak began a year-long decline of the DXY, which only found support at 89.1 (green line). Meanwhile, there was a sharp break below 94.5 in July 2020 and the subsequent validation of this area as resistance in late September 2020 (blue squares).
The entire year 2021 was mainly marked by consolidation in the 89.1-94.5 range. However, about a month ago, in early November 2021, there was a breakout above the red line and a continuation of the uptrend.
Currently, the DXY is approaching an important resistance level at the 0.618 Fib retracement, measuring for a long-term downward move. This golden pocket level usually indicates where the correction ends and the preceding trend resumes. Interestingly, the red line coincides with the 0.382 Fib retracement level.
Furthermore, the price action generated a rising wedge structure with a clear median (blue lines). This is typically a bearish reversal pattern, after which the price resumes its downward movement. Reaching the peak of the wedge, which will converge with the 0.618 Fib level, is possible in mid-January 2022.
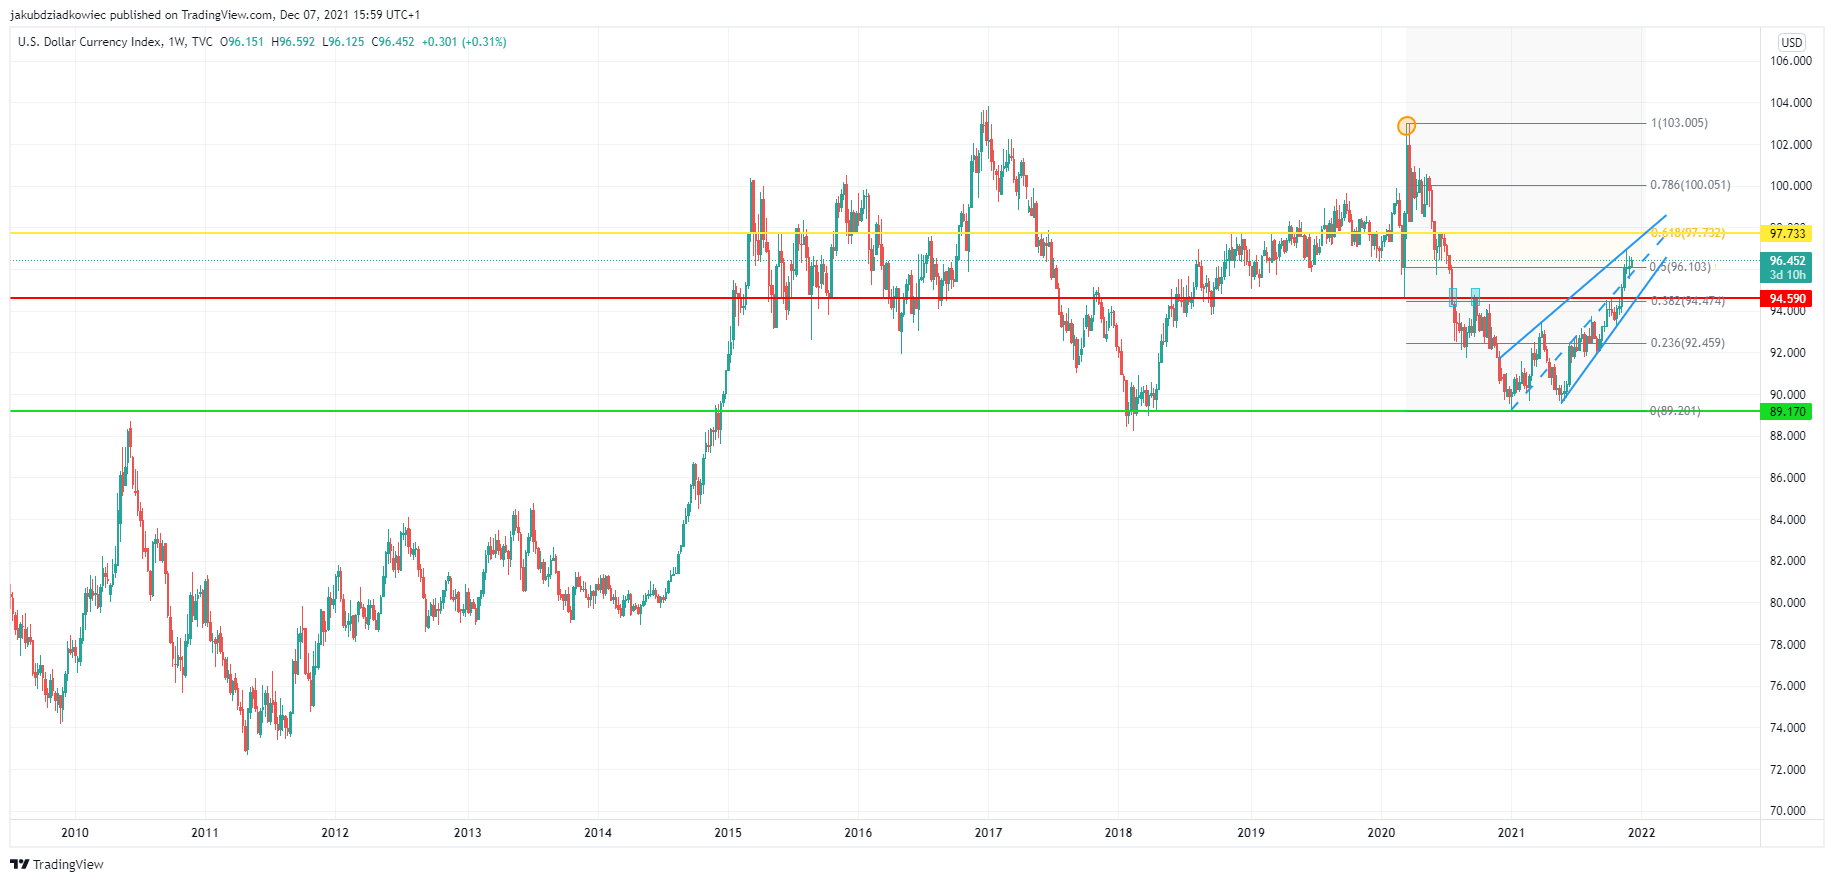
A glance at the long-term DXY chart shows the historical significance of the aforementioned levels. The green line at 89.1 has already acted as support during the declines in 2017-2018 and resistance for the uptrend in 2010. Also, the red line at 94.5 and the gold line at 97.7 have acted as resistance/support many times.
Correlation with Bitcoin
Since the beginning of Bitcoin’s trading, one can notice a negative correlation of the BTC price with the DXY. It has not always been clear, in some periods it was not present at all, and sometimes it was even positive. Despite this, the long-term trend is clear: if the DXY price falls, BTC rises – and vice versa.
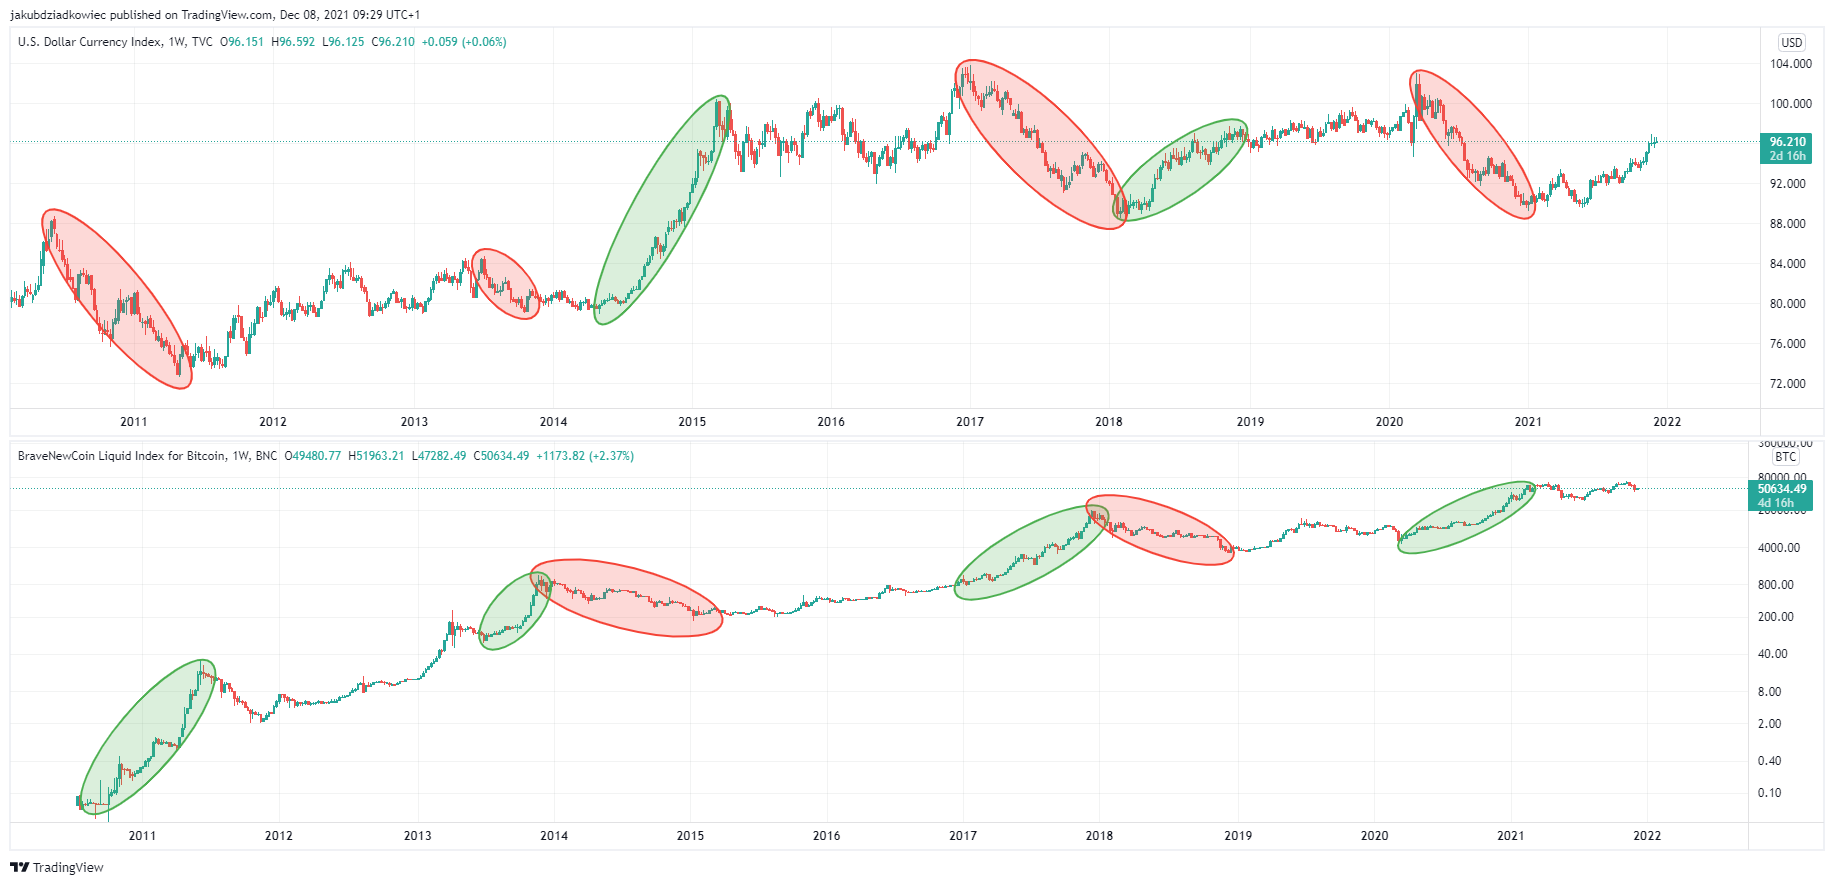
This situation was evident in every cycle: from the genesis to the recent bull market of March 2020-February 2021. The sharp increases in the BTC price in 2010-2011, 2013, 2017 and 2020-2021 were correlated with sharp declines in the US dollar index. In contrast, when the DXY recovered quickly, BTC was mostly in a bear market (2014 and 2018).
However, looking at the correlation coefficient indicator (blue chart) on the daily time frame for the last 1.5 years, we see a more subtle relationship. The negative correlation persisted until early 2021 (blue rectangle).
After that, the chart became more complicated. Most of the time it showed no correlation or little positive and negative correlation. During this time, Bitcoin set its historical ATH in April (orange circle) and started a 3-month correction in May-July 2021.
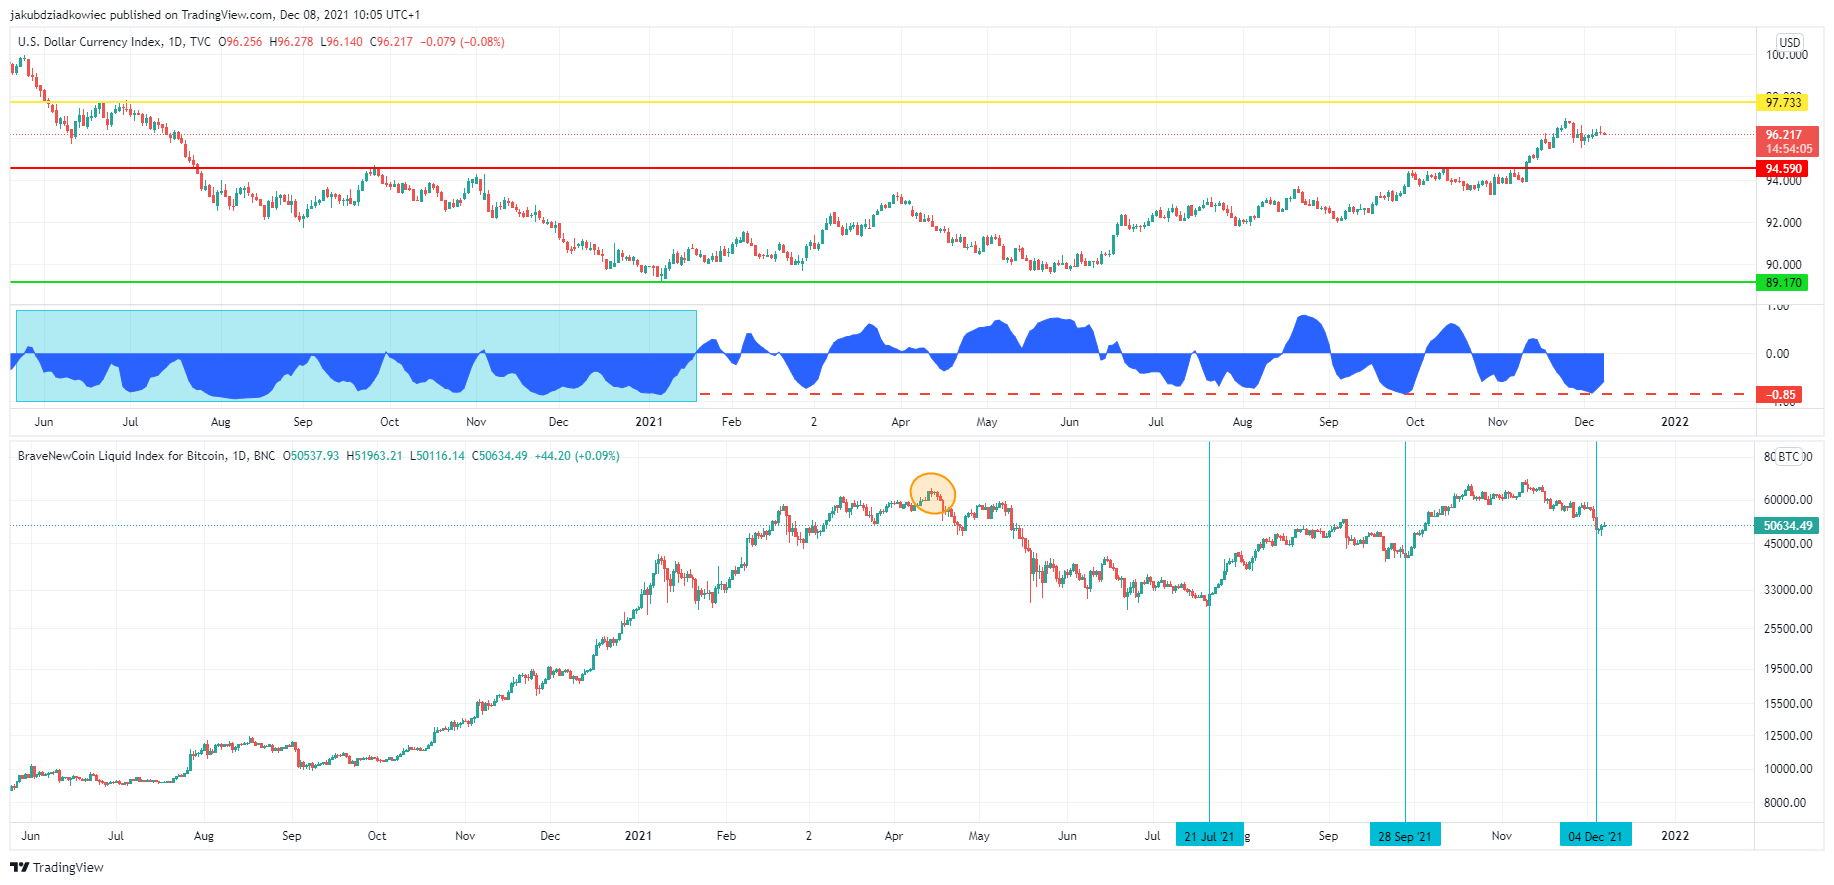
After the end of the BTC correction, both the DXY and BTC charts move upwards, but again they do so in a mostly negative correlation. It is an interesting phenomenon that the peaks of this negative correlation (red dashed line) usually fall on the local lows of the BTC price (blue vertical lines). The most recent such bottom was found on December 4, when BTC correlation reached -85%.
Conclusion
The US Dollar Index is approaching a long-term resistance level at the 0.618 Fib retracement (yellow line). If it is rejected from this area and starts a decline, this could be very positive for Bitcoin. The condition is to maintain the long-term negative correlation with Bitcoin.
Also short-term, on the daily time frame, the high negative correlation of DXY and BTC has been a signal for a BTC bottom in recent months. If this is the case, we can expect DXY to consolidate below the 0.618 Fib resistance in the coming weeks, which could coincide with increases in the BTC price.
For BeInCrypto’s latest Bitcoin (BTC) analysis, click here.
