


The Tezos (XTZ) price reached a new all-time high after breaking out over the previous high two weeks ago. XTZ was unable to sustain the higher prices and has fallen back below its previous resistance.
Unless the price is successful in reclaiming this resistance, the outlook remains bearish.
XTZ Can’t Hang
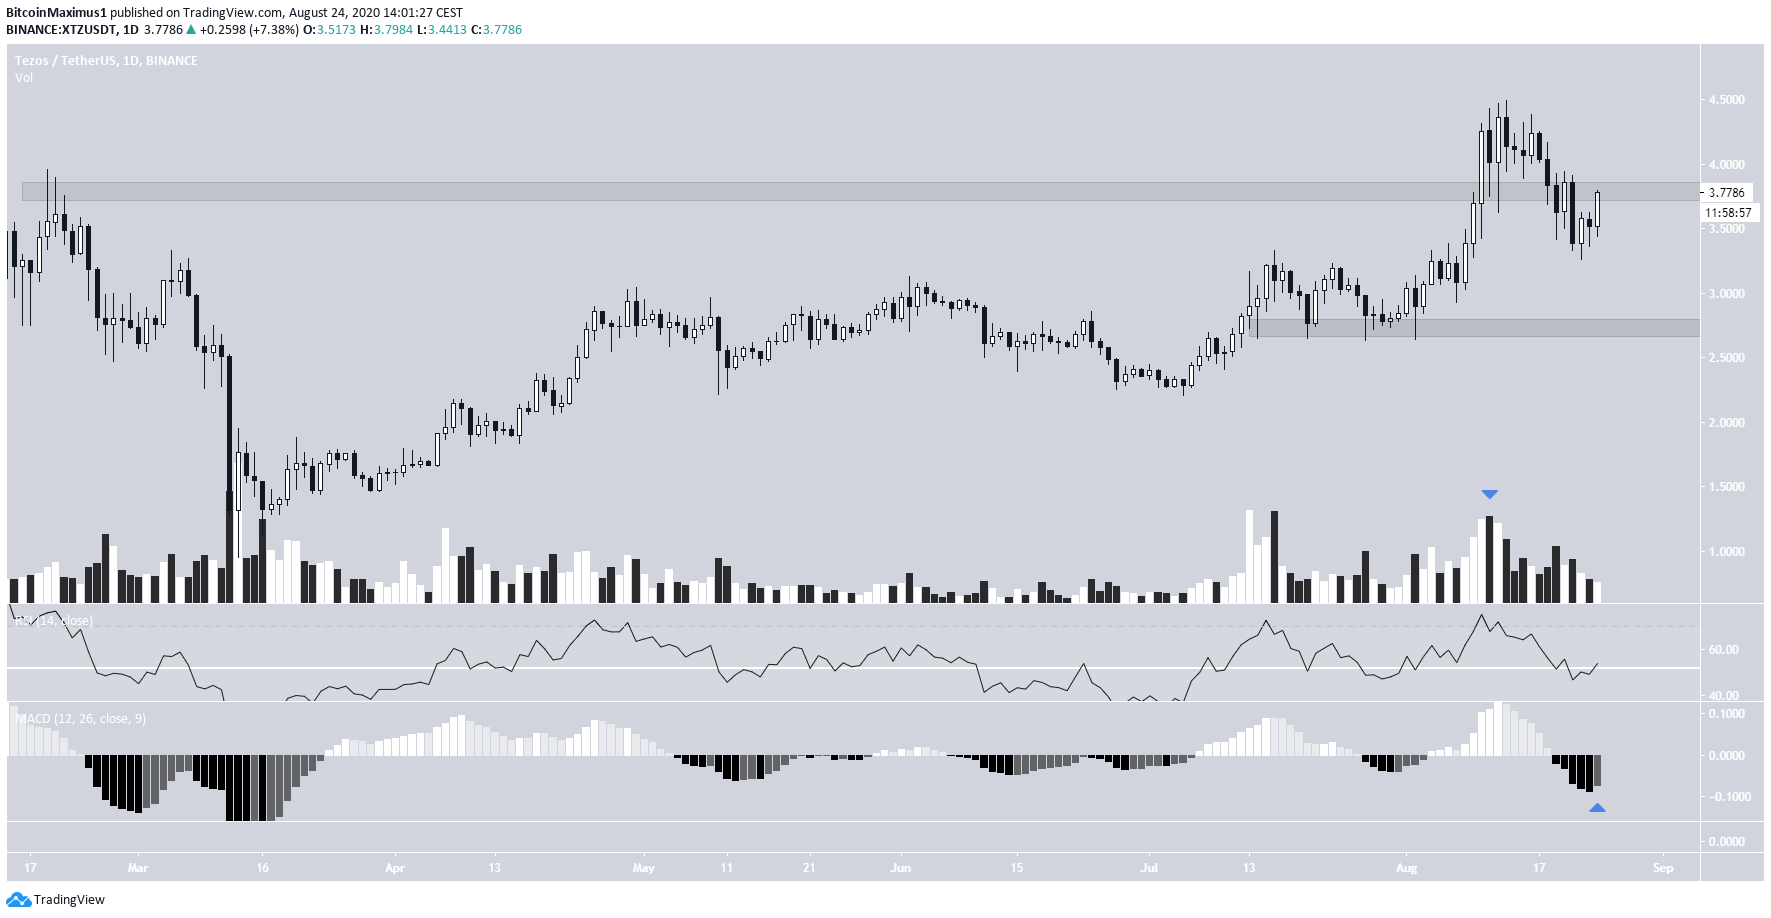
The XTZ price has been increasing since the beginning of March. On Aug 10, the price broke out from the $3.80 resistance from its previous all-time and finally reached a peak of $4.56 on Aug 13.
However, the higher prices could not be sustained, and XTZ fell back below the area without validating it as support. At the time of press, it was in the process of validating it as resistance.
Technical indicators are neutral. The RSI is trading at 50, and the MACD is negative but possibly wants to move upwards. Volume has been slightly higher on bearish candlesticks.
If the price begins decreasing, the closest support area would likely be found at $2.60.
Long-Term Weakness
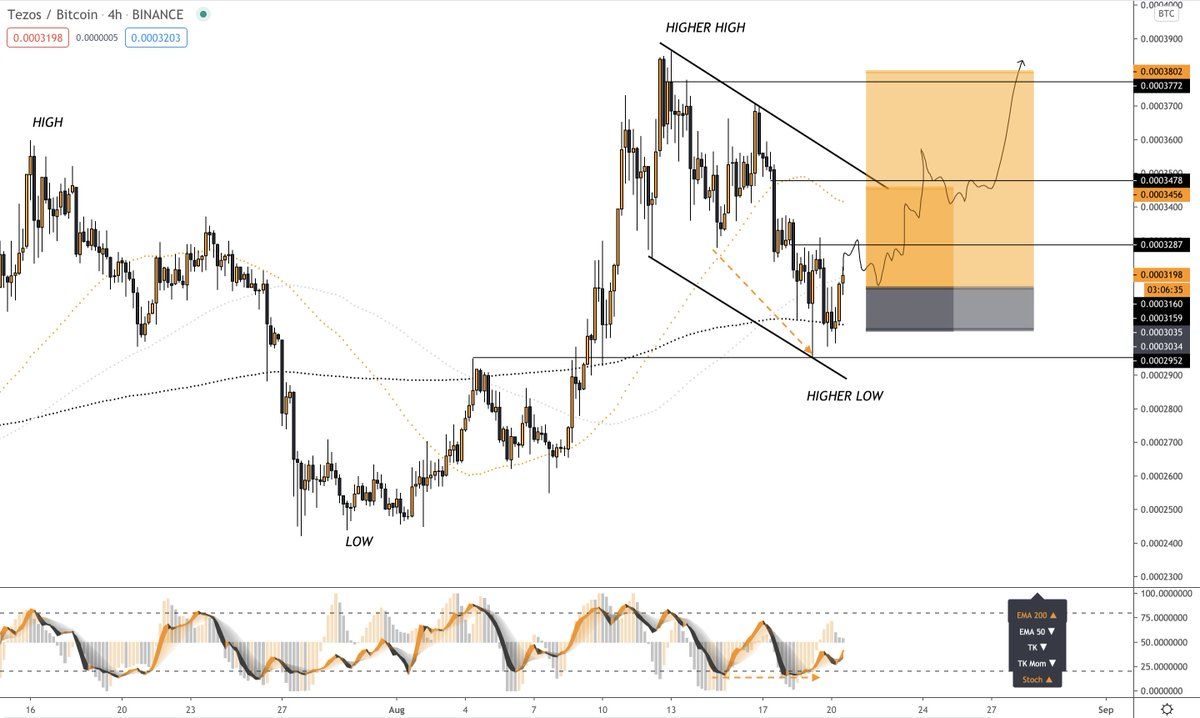
Cryptocurrency trader @Crypto_birb believes that XTZ will reclaim the lost support and soon reach new all-time highs:
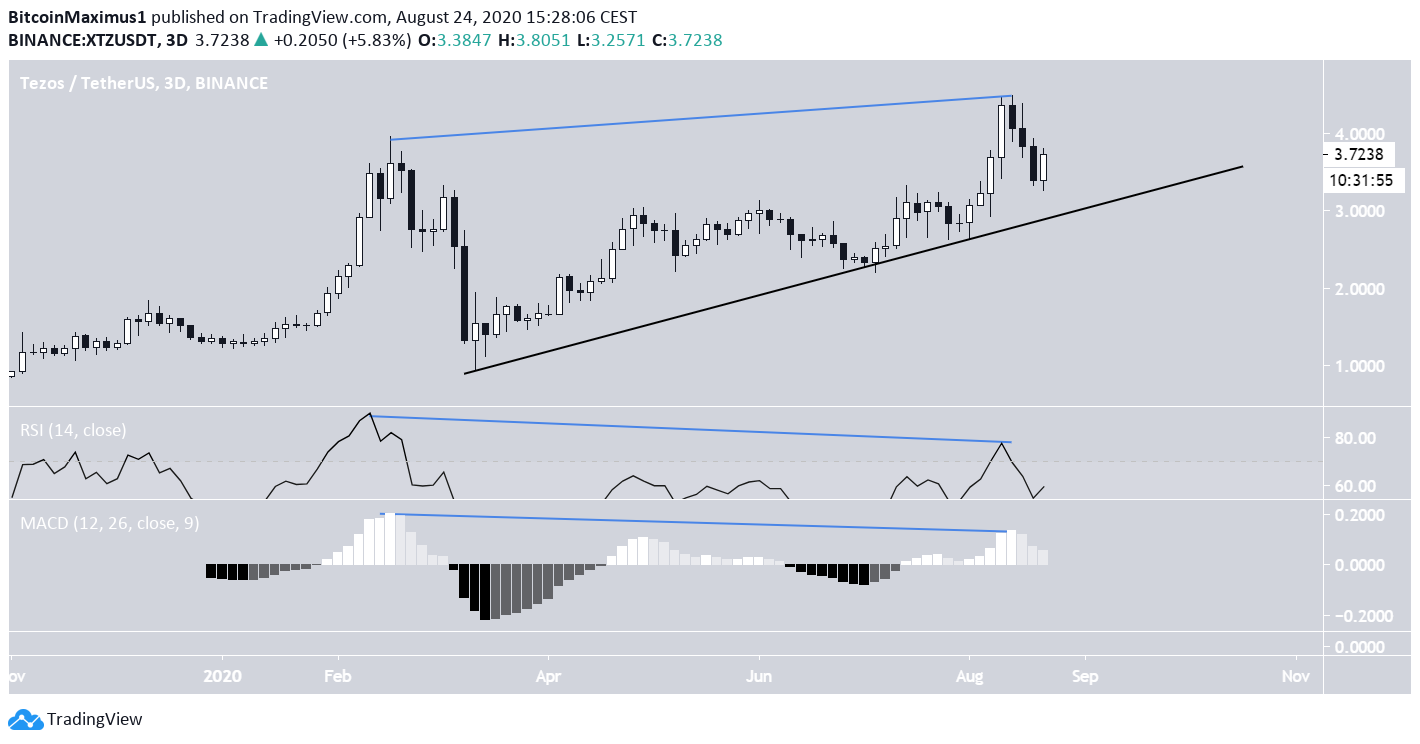
In the meantime though, the long-term chart shows considerable weakness in the form of bearish divergences present in both the RSI and the MACD. The divergence is present when comparing the previous all-time high reached on Feb 19 with the new high from August 13.
In addition, we can see that the price is following an ascending support line, which coincides with the previously mentioned $2.60 support area.
Since the divergence is present in higher time-frames, any decrease that occurs, as a result, could cause a breakdown from this line and confirm that the trend is bearish.
On the other hand, reclaiming the resistance area at $3.80 would invalidate the bearish outlook.
To conclude, while XTZ recently reached a new all-time high, the failure to sustain higher prices combined with the considerable bearish divergence indicates a weakness in the trend.
Unless the price reclaims the $3.80 resistance area, the outlook remains bearish.


