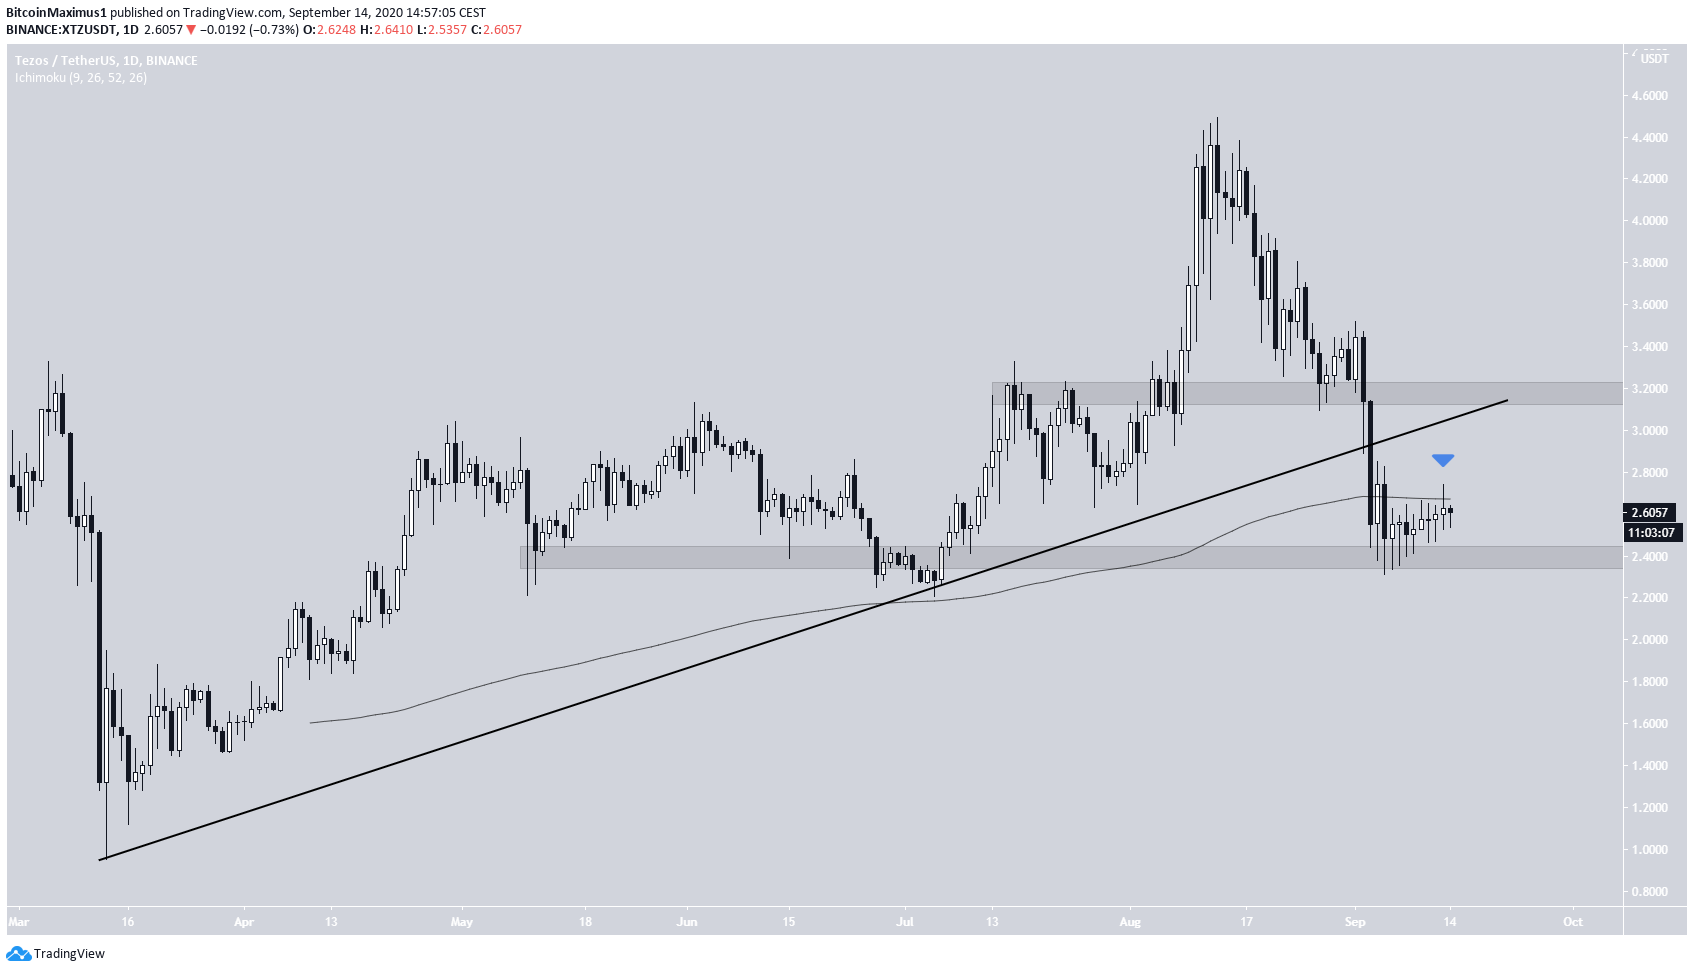
The Tezos (XTZ) price has broken down from an ascending support line that had been in place since March.
While the price has bounced at a minor support area, XTZ may eventually make another low before beginning a new upward move.
Breakdown From Long-Term Support
The XTZ price has been falling since August 13, when it reached a high of $4.49. The decline accelerated on September 1.
Two days later, the price broke down from an ascending support line that had previously been in place since March 13. A breakdown form such a long-term structure often indicates a change in the trend.
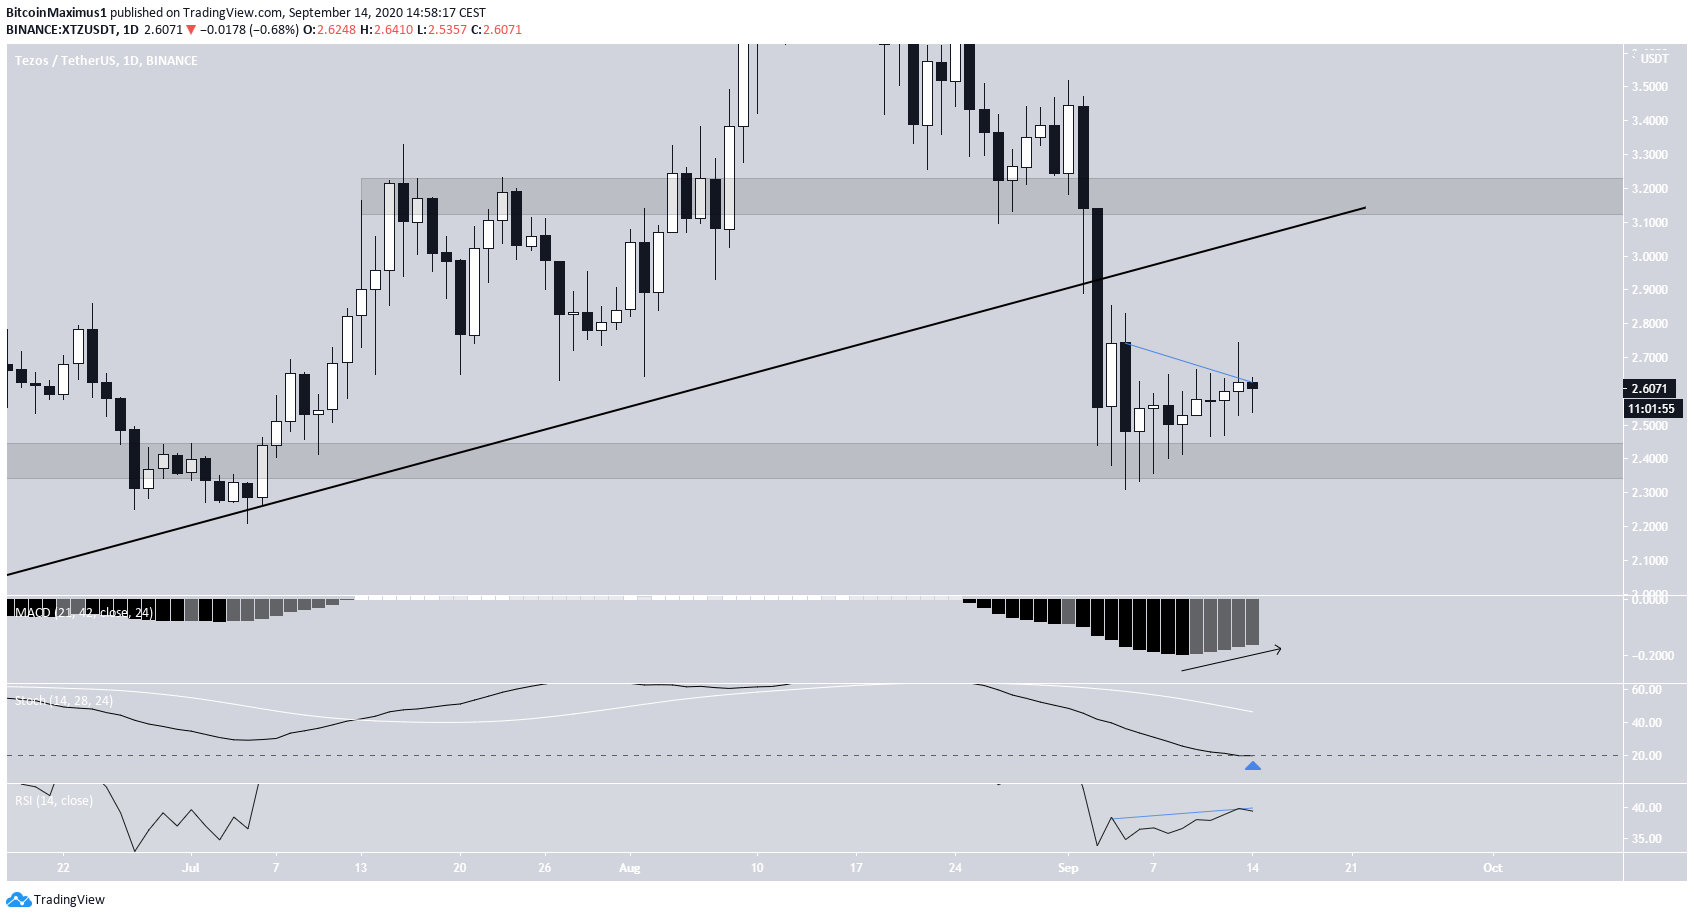
In addition, the price has fallen below the 200-day moving average (MA) and possibly validated the line as resistance. The closest support and resistance levels are found at $2.40 and $3.20. The former has already initiated a bounce.
Technical indicators are also neutral. The MACD is increasing, and the Stochastic oscillator is oversold, possibly getting ready to rally.
However, there is hidden bearish divergence on the RSI, which suggests a drop is likely.
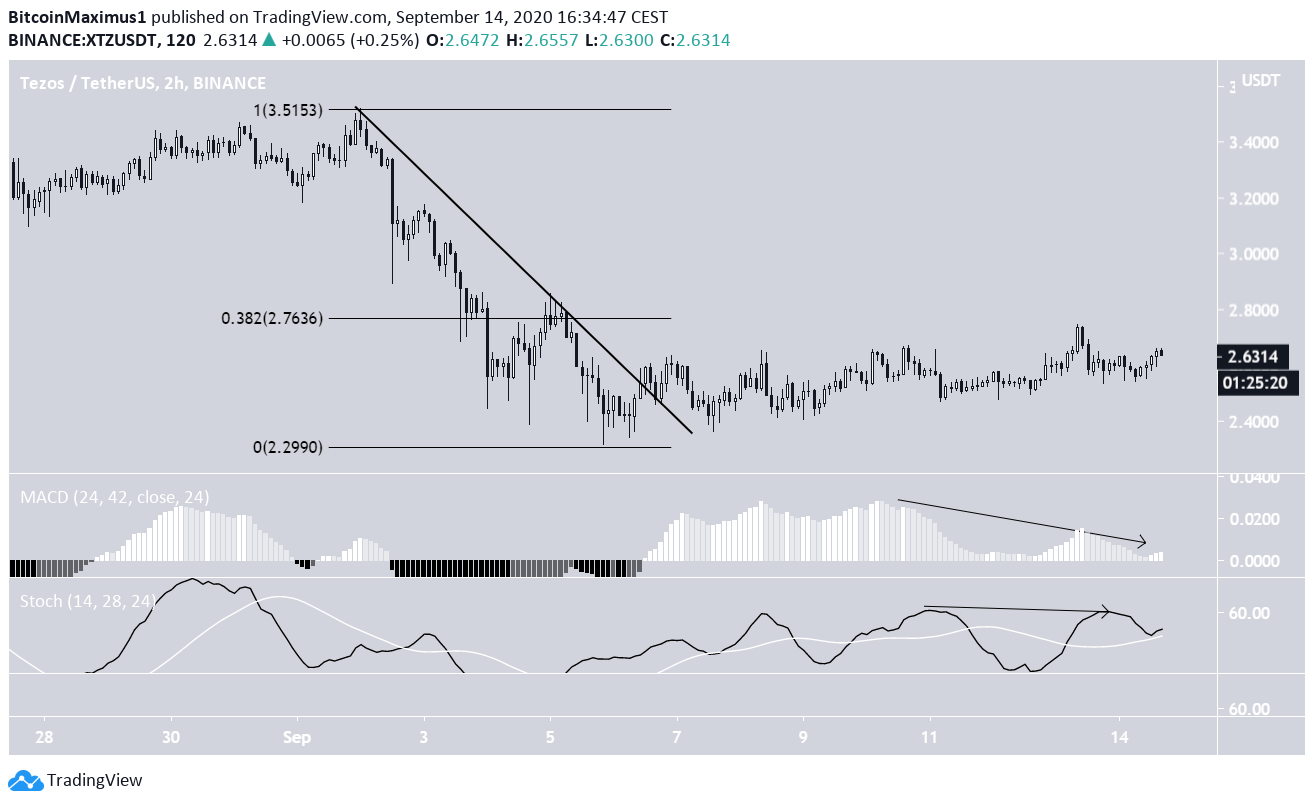
Short-Term Movement
Cryptocurrency trader @scottmelker outlined an XTZ chart, stating that he is going long in response to a breakout from the current descending resistance line.
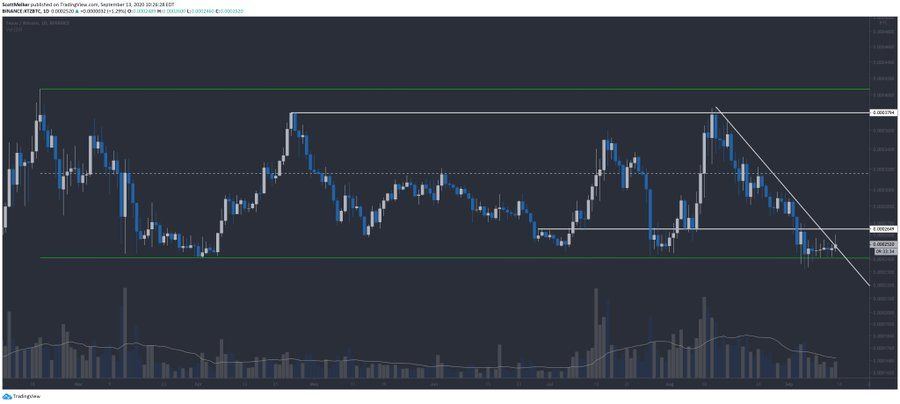
While the price has indeed broken out from a descending resistance line, it has failed to initiate a bullish impulsive move as a result. On the contrary, the price has been consolidating near the breakout level and has not even attempted to move above the 0.382 Fib level of the entire previous decline.
Also, there is a growing bearish divergence on the Stochastic oscillator and the MACD, the former possibly making a bearish cross. This suggests that a fall towards support at $2.40 is more likely before the price possibly initiates another upward move.
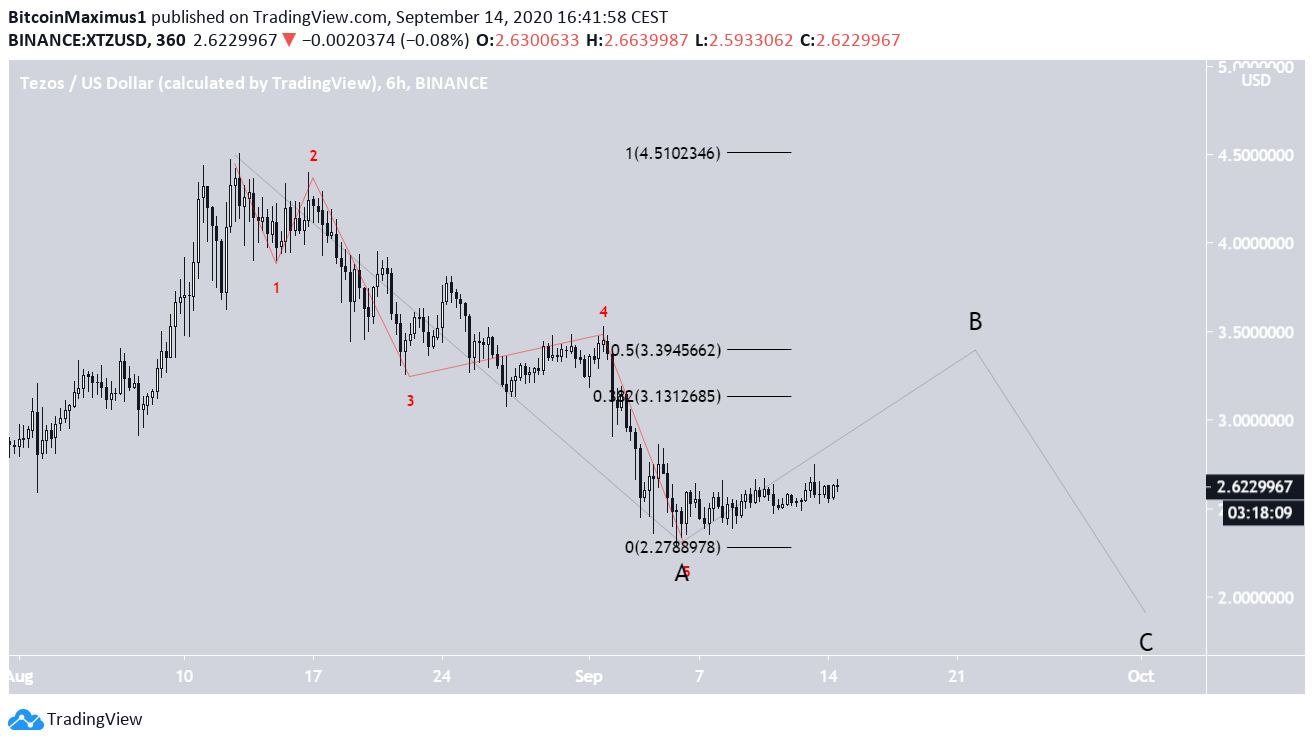
XTZ Wave Count
Beginning on March 12, it seems that XTZ started a bullish impulsive formation, which concluded with the August 13 high. The decline since then has touched the 0.618 Fib level of the entire move, a possible level for the correction to end.
However, the correction has been very short, so it’s possible that only a part of it has concluded.
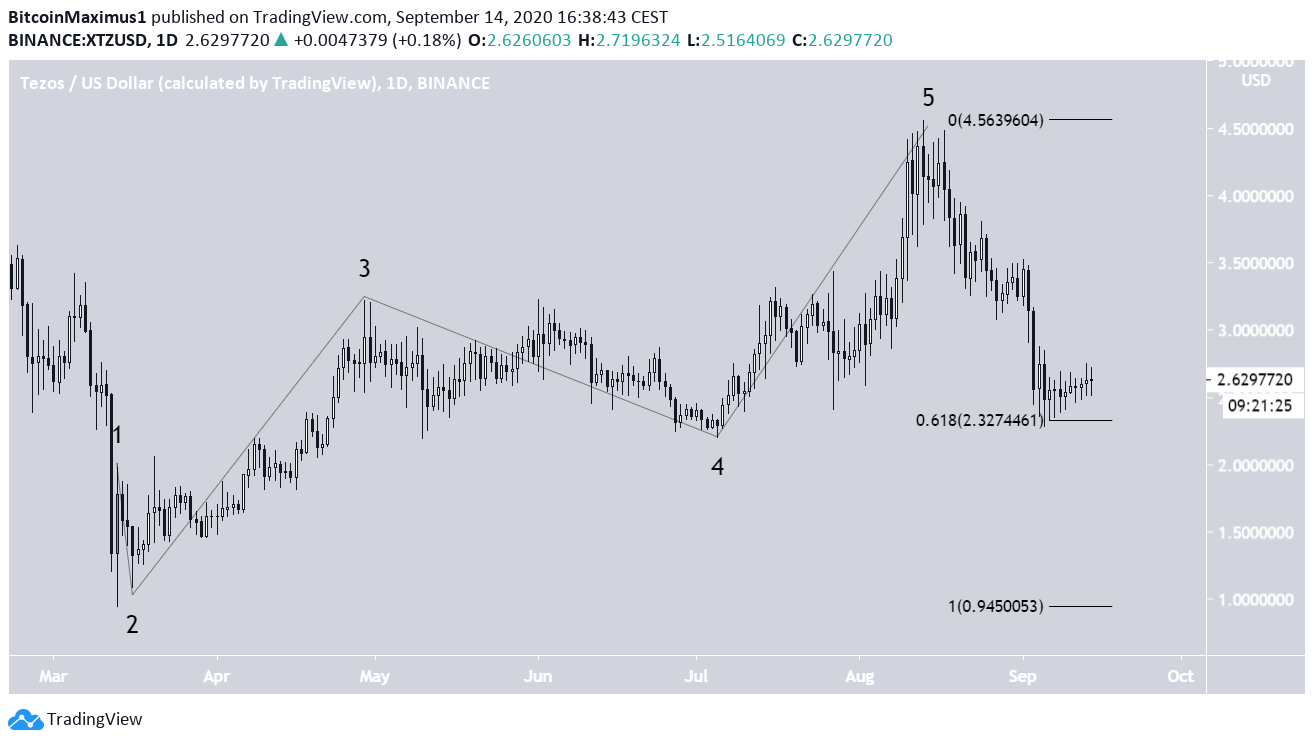
A closer look at the structure since the August 13 high reveals five completed waves moving down (in red below). This makes it more likely that the decline has only been the A (black) wave of an A-B-C correction, which would likely create a lower low.
If correct, this would mean that the price is in the B wave, which could take it near the $3.2 resistance area before XTZ drops again.