


![Tezos May Have Completed Its Market Cycle, Notes Analyst [Premium Analysis]](/_mfes/post/_next/image/?url=https%3A%2F%2Fassets.beincrypto.com%2Fimg%2F40V0oO-XCTC0gw7BUR79bMGbMuI%3D%2Fsmart%2F4ee33e5367f147b192a8cea80757c4ca&w=1920&q=75)
The Tezos price has possibly completed the fifth and final wave of its current upward move. A corrective period should ensue until the price decreases to one of the support areas outlined.
The Tezos price has increased by roughly 80% since the beginning of November. However, its current rally seems to be losing strength, as evidenced by the readings of several technical indicators.
Well known trader @LomahCrypto stated that he re-entered the long trade for Tezos. In addition, he warned that a daily price close below 2800 satoshis would indicate that the price is heading lower.
Re-entered some of the position here.
D3 close below 2280 and I think we'll have a steep pullback for another buying opp. pic.twitter.com/PPvC7sRLub
— Loma (@LomahCrypto) December 18, 2019
Where will the Tezos price go to next? Continue reading below in order to find out.
Tezos Upward Move
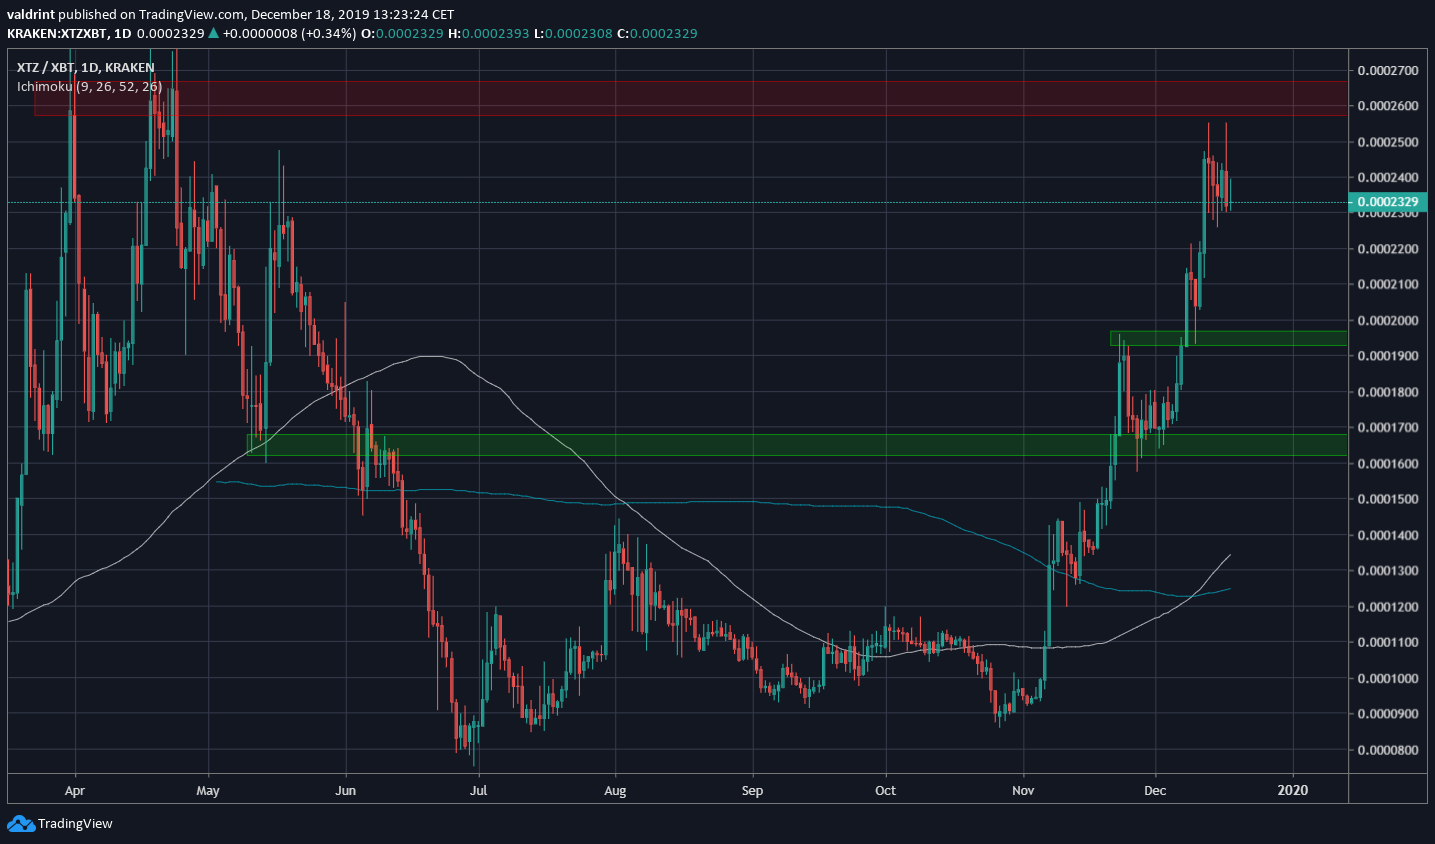
The Tezos price has been increasing significantly since the beginning of November. The main resistance area is found between 2600 and 2700 satoshis. There is minor support at 1950 and major support at 1650 satoshis.
The relatively long-term 100- and 200-day moving averages (MA) have made a bullish cross, likely indicating that a bullish market cycle has begun.
However, the price failed to reach a new all-time high above the current one of 2825 satoshis and has created two long upper wicks on the daily time-frame. This is a bearish development that suggests that the price is close to reaching a top and might soon decrease.
Due to the fact that the price has yet to validate the MAs as support, it could decrease significantly and do so, yet still be considered bullish due to the fact that it is above both.
Elliott Formation
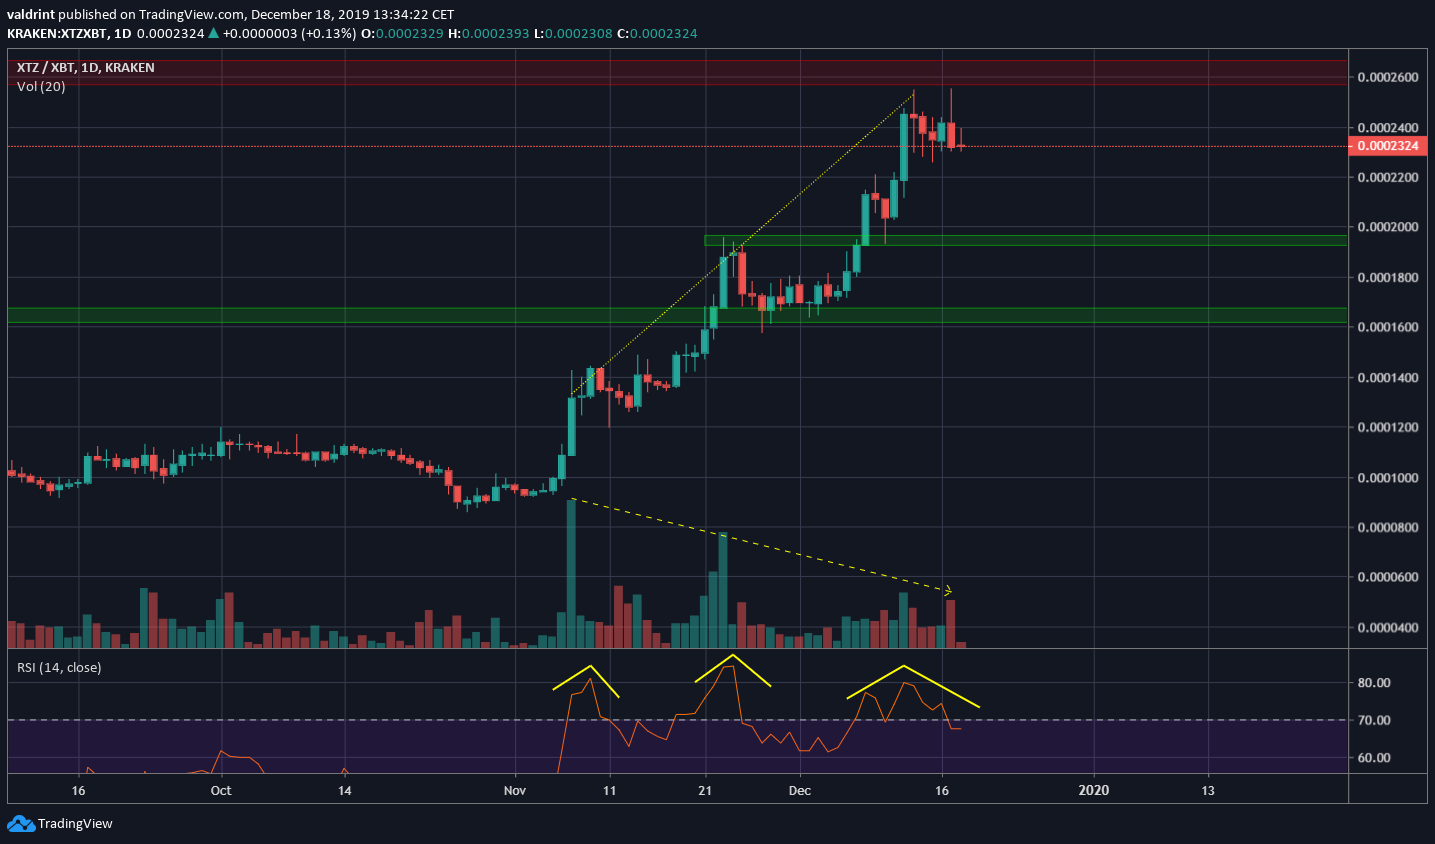
Throughout this entire move, there are two interesting characteristics from technical indicators.
Volume has been consistently decreasing through each upward move, and the RSI is oversold and has generated bearish divergence. Furthermore, it looks to have completed a head and shoulders pattern, after which a decrease should occur.
These characteristics and the number of waves in the price movement eerily resemble a five-wave Elliot formation. If so, the price will make a high near the resistance area, (if it has not already made one), then will decrease towards the first minor support area, completing the (A) wave of the correction.
After the (B) upward wave, the price should continue its correction until it reaches the second support area between 1600 and 1700 satoshis.
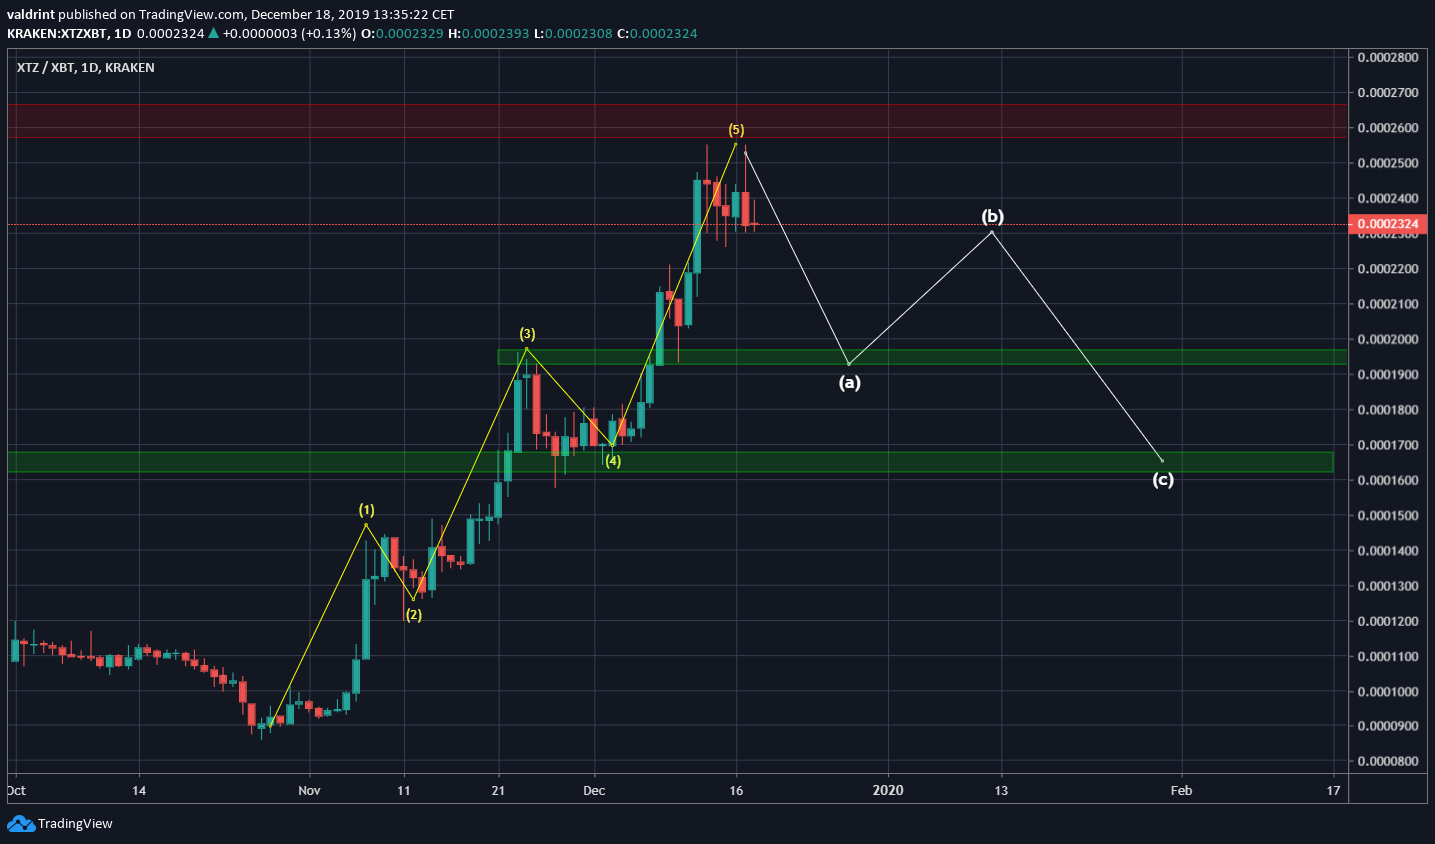
To conclude, we believe the XTZ price has reached a top or is very close to reaching one. A corrective period is to be expected in the near future.


