Tezos Highlights
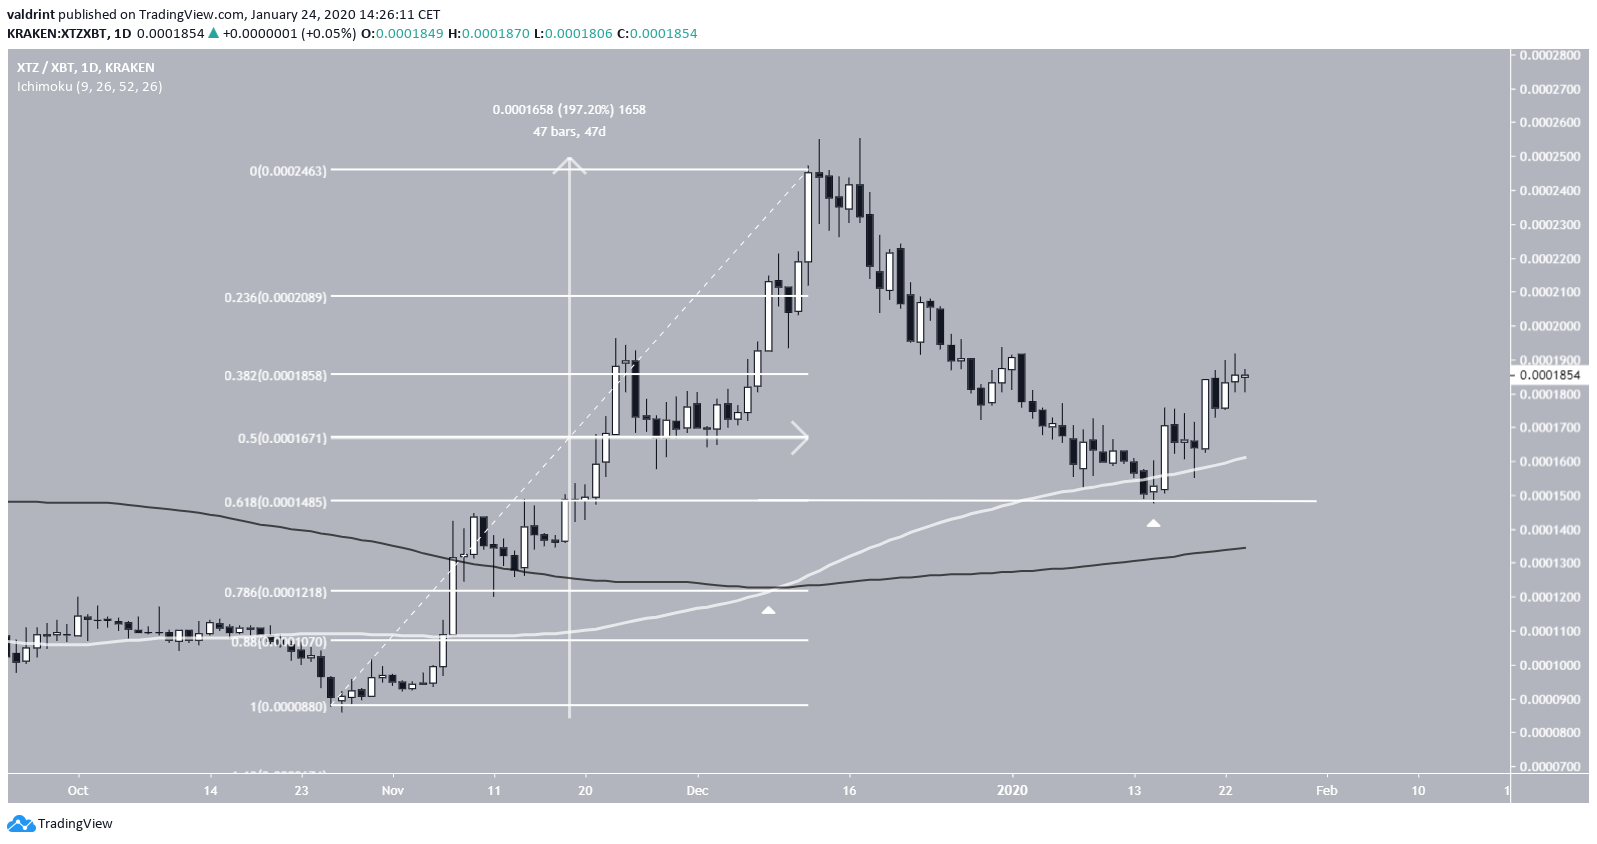
- The XTZ price has retraced to the 0.618 fib level.
- The price is likely in a long-term upward trend.
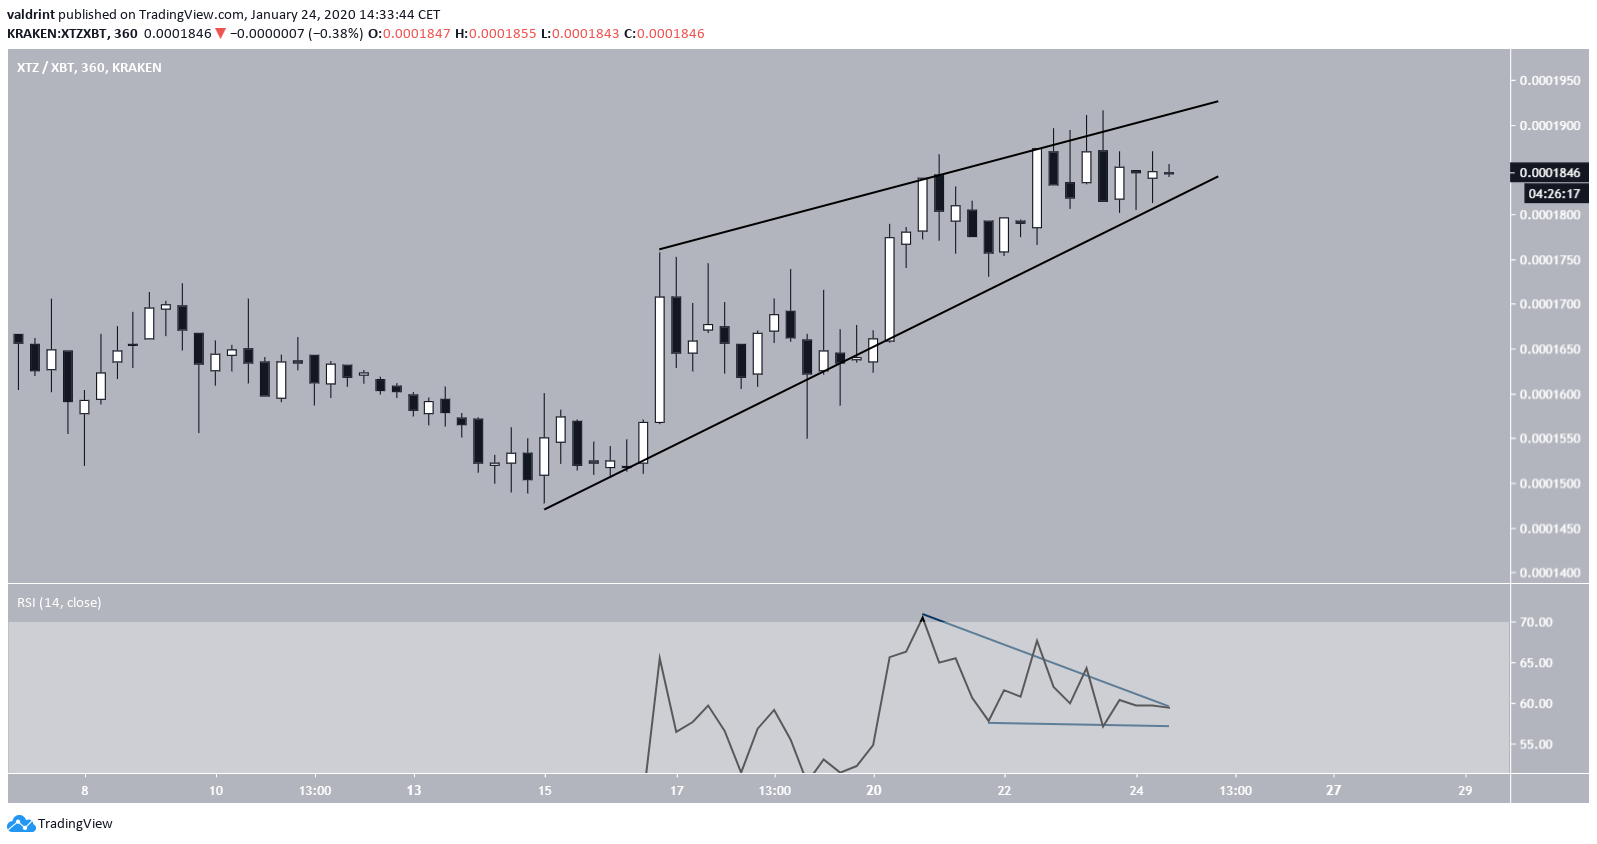
- It is trading inside an ascending wedge.
- Short-term indicators are bearish.
- There is support at 1750 and 1620 satoshis.
Will Tezos break down? If so, where will it go? Keep reading below if you want to find out.$XTZ | $BTC Update
— Lenny (@TraderLenny) January 23, 2020
Looks like we might be getting that breakdown.
While it might still get bought back up, it's important to note that you should always keep your emotions in check.
Euphoric bulls often ignore bearish patterns.
Remain flexible. pic.twitter.com/XCRZwIdHoP
Current Correction
The XTZ price was in an upward trend for 47 days, increasing by 197% in the process. The rally ended on December 17, 2019, with a high of 2552 satoshis. Afterward, the price decreased until January 15, 2020, when it made a low of 1477 satoshis. This coincided with the 0.618 fib level of the entire upward movement. It is possible that the price completed the correction and reversed on January 15 hence beginning another upward move. This possibility is supported by the previous bullish cross of the 100- and 200-day MAs and the fact that the price is trading above them. This suggests that the price is in a long-term upward trend.
Ascending Wedge
There indeed is a wedge in the short-term movement as outlined in the tweet. The price is nearing the projected end of the wedge. XTZ looks likely to break down from the wedge due to several factors. First, the RSI has generated bearish divergence and created a possible descending triangle, out of which a breakdown is expected. In addition, the price has created several long upper wicks near the resistance line of the wedge and followed them by a price decrease. This is a sign that the price does not have enough strength to push upward. Combining this with the fact that the ascending wedge is a bearish pattern, a breakdown seems more likely.
XTZ Future Movement
The price is expected to possibly continue trading within the wedge before breaking down. If that occurs, the closest support areas are found at 1750 and 1620 satoshis. The price is likely to reach at least one of them, depending on the severity of the breakdown. To conclude, the XTZ price is trading inside a bearish pattern out of which a breakdown is expected. In the long-term, the price is likely in an upward trend.
Disclaimer
In line with the Trust Project guidelines, this price analysis article is for informational purposes only and should not be considered financial or investment advice. BeInCrypto is committed to accurate, unbiased reporting, but market conditions are subject to change without notice. Always conduct your own research and consult with a professional before making any financial decisions. Please note that our Terms and Conditions, Privacy Policy, and Disclaimers have been updated.


