The Tezos (XTZ) price is approaching an important support level that could reverse the ongoing bearish trend. The reversal would be confirmed with a breakout above the current descending resistance line.
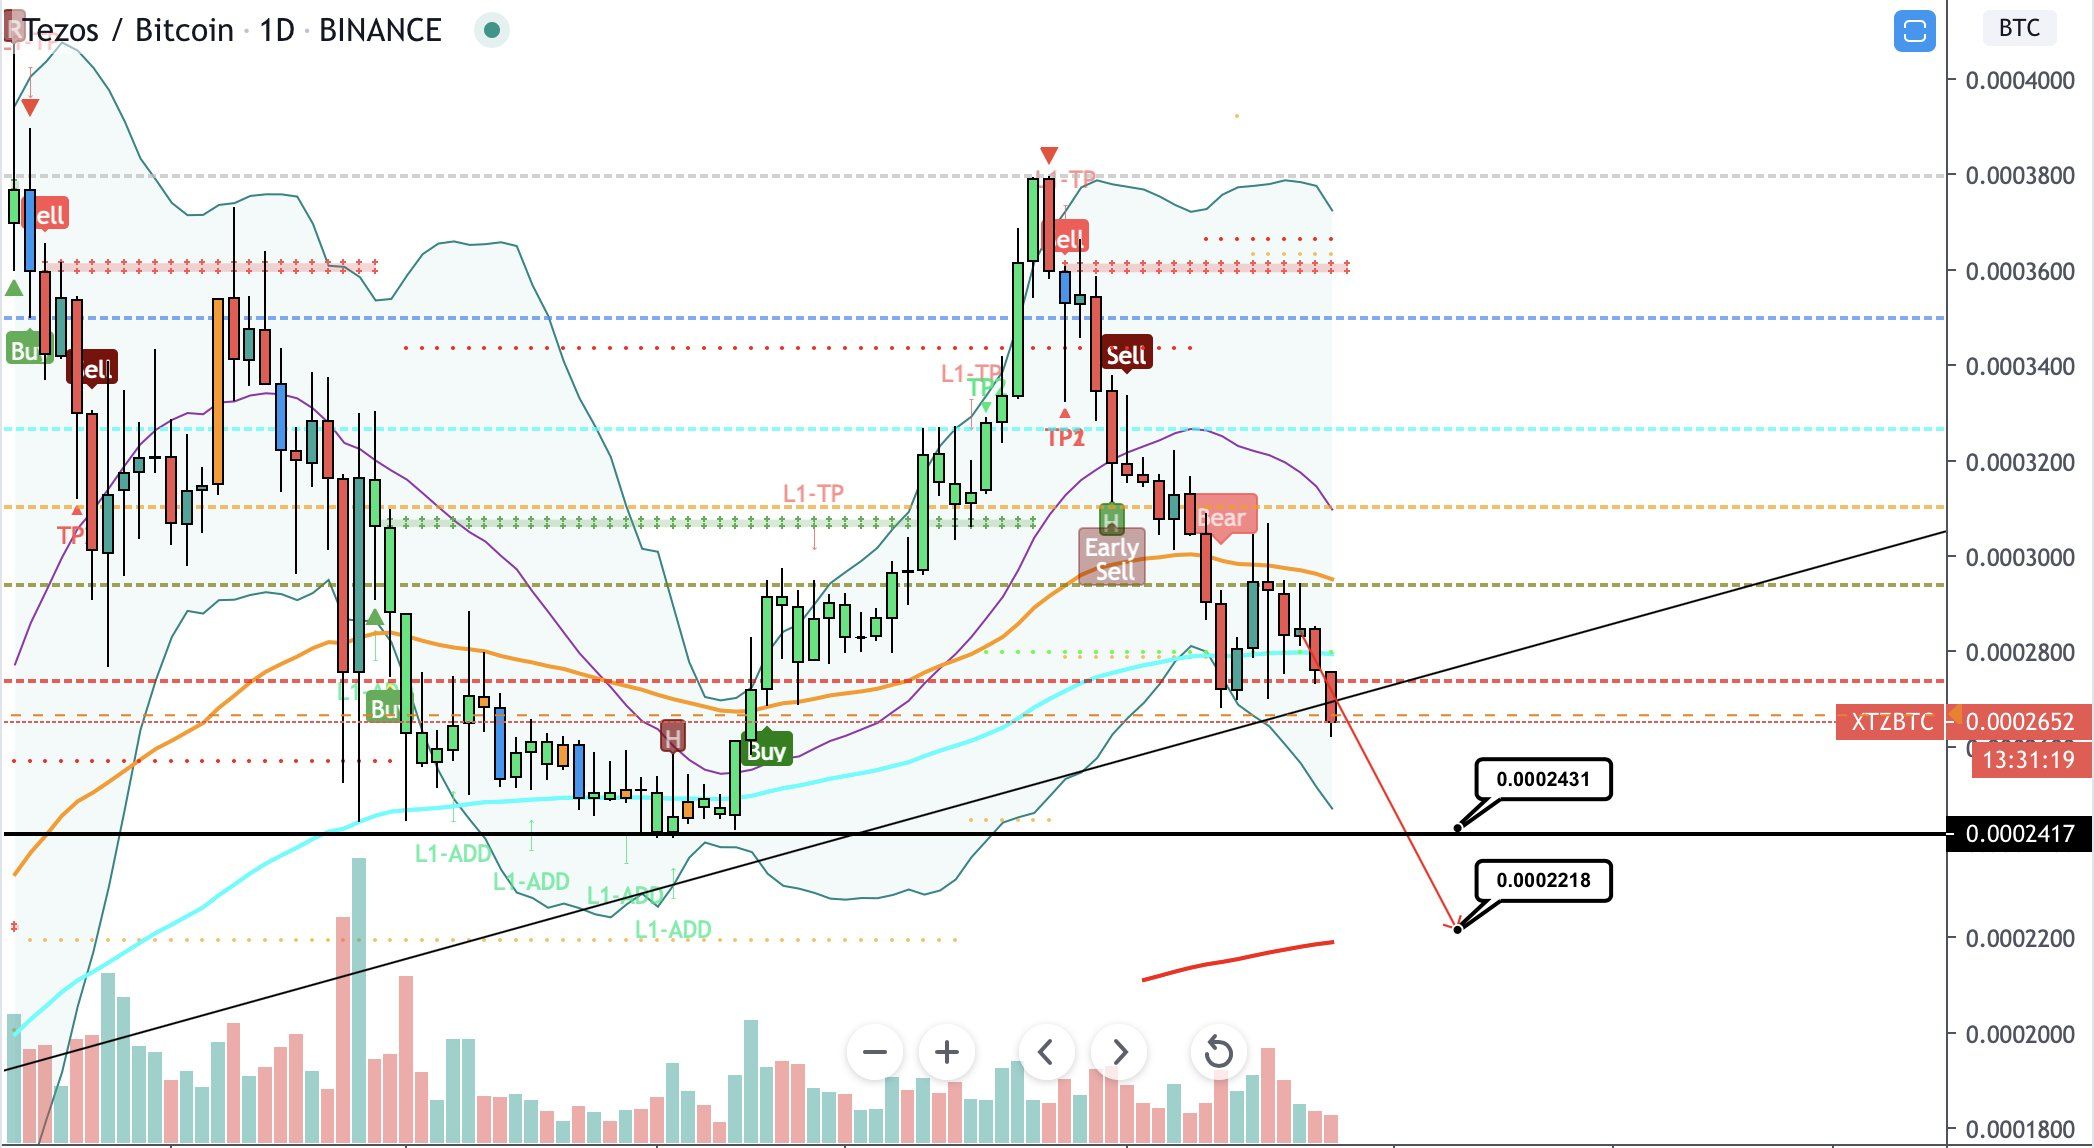
The Tezos price has been decreasing at an accelerated rate since reaching a high of 37,930 satoshis on April 26. The price did not stop its descent even as it reached an important support level. Cryptocurrency trader @CryptoNewton posted a Tezos (XTZ) chart, outlining the ongoing downward trend and giving targets of 24,000 and 22,000 satoshis
In this article, we will take a closer look at the XTZ price movement in order to determine if it is likely to reach the targets given above.
Ascending Support Line
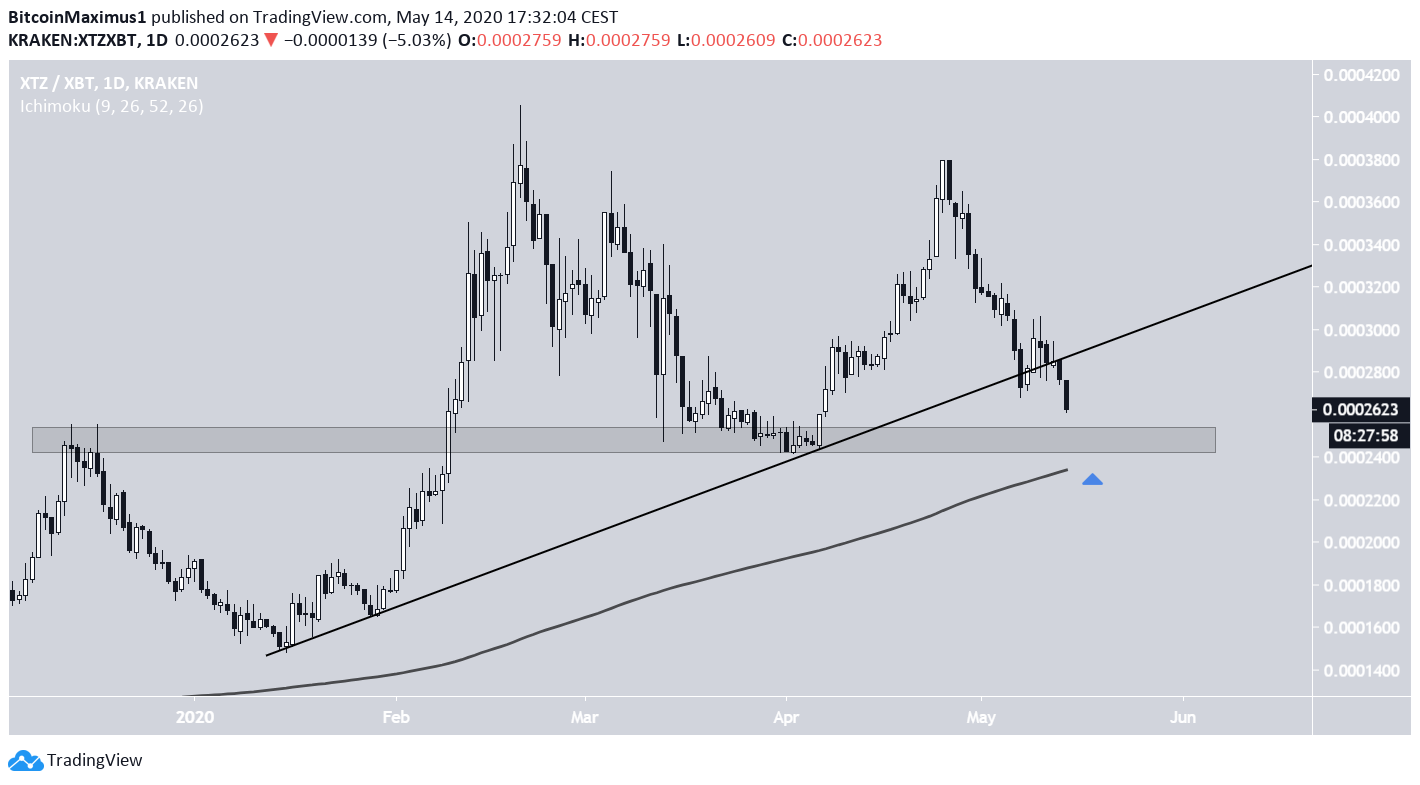
The XTZ price had been following an ascending support line since Jan. 14. However, on May 7, the price broke down from this support line, possibly indicating that the upward trend has ended.
If the decrease continues, the closest support area is found at 25,000 satoshis. This area has previously acted as both support and resistance and is strengthened by the presence of the 200-day moving average (MA).
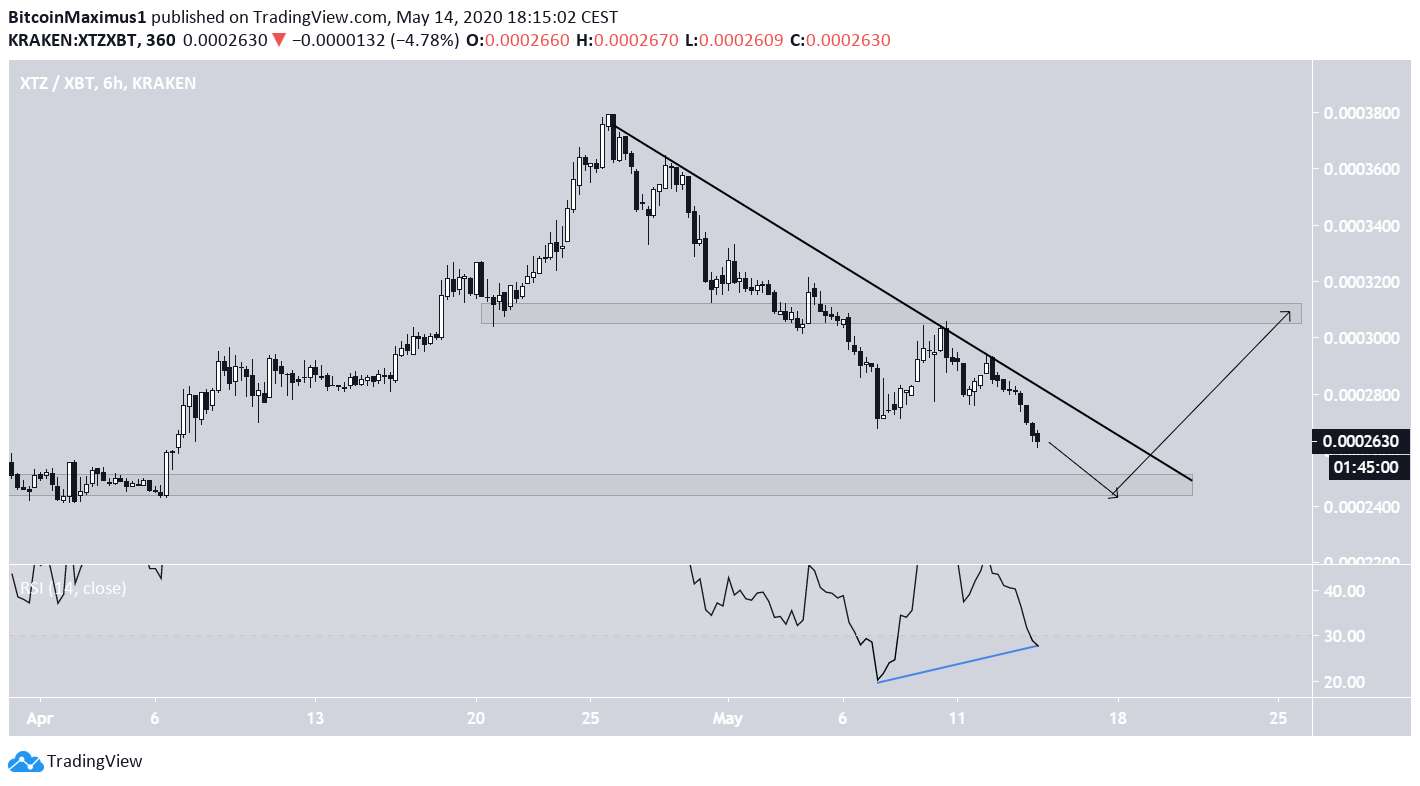
In the short-term, XTZ has been following a steep descending resistance line, having validated it four times until now. If the price continues decreasing at the rate predicted by this line, it will reach the aforementioned support area on May 18 at the latest.
Once it gets there, a bounce seems likely. The RSI has been generating bullish divergence, a sign that the downward trend might soon come to an end. If the price breaks out above this resistance line, it is likely to increase until it reaches 30,500 satoshis.
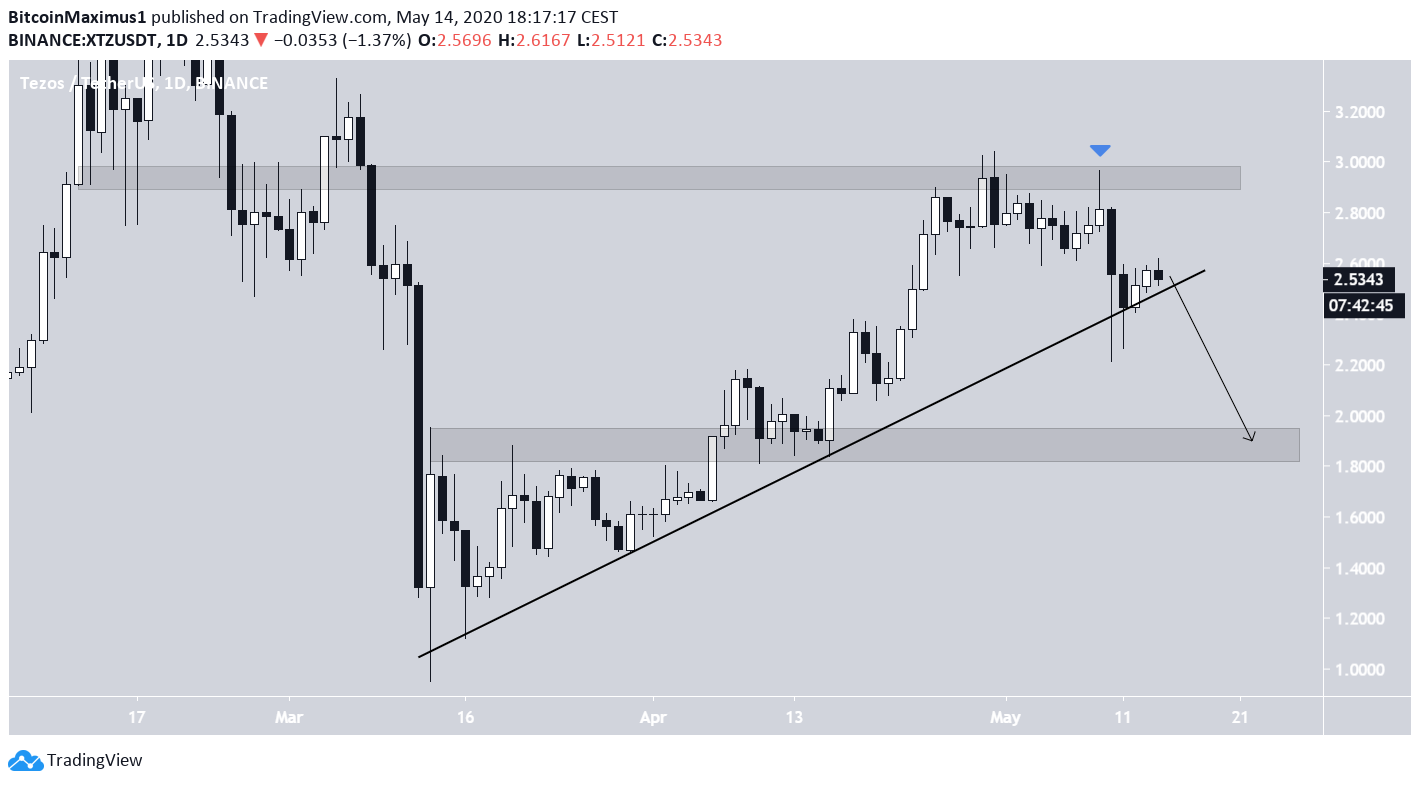
Tezos/Dollar
As for the XTZ/USD chart, its ascending support line is still intact. The price was rejected by the $3 resistance area and began a downward move that took it straight to the support line. If the price breaks down, there is a lack of support all the way to $1.9, so we could see a very sharp drop.
Technical indicators are neutral, so the possibility of a decrease largely rests on whether the price of Bitcoin will drop.