


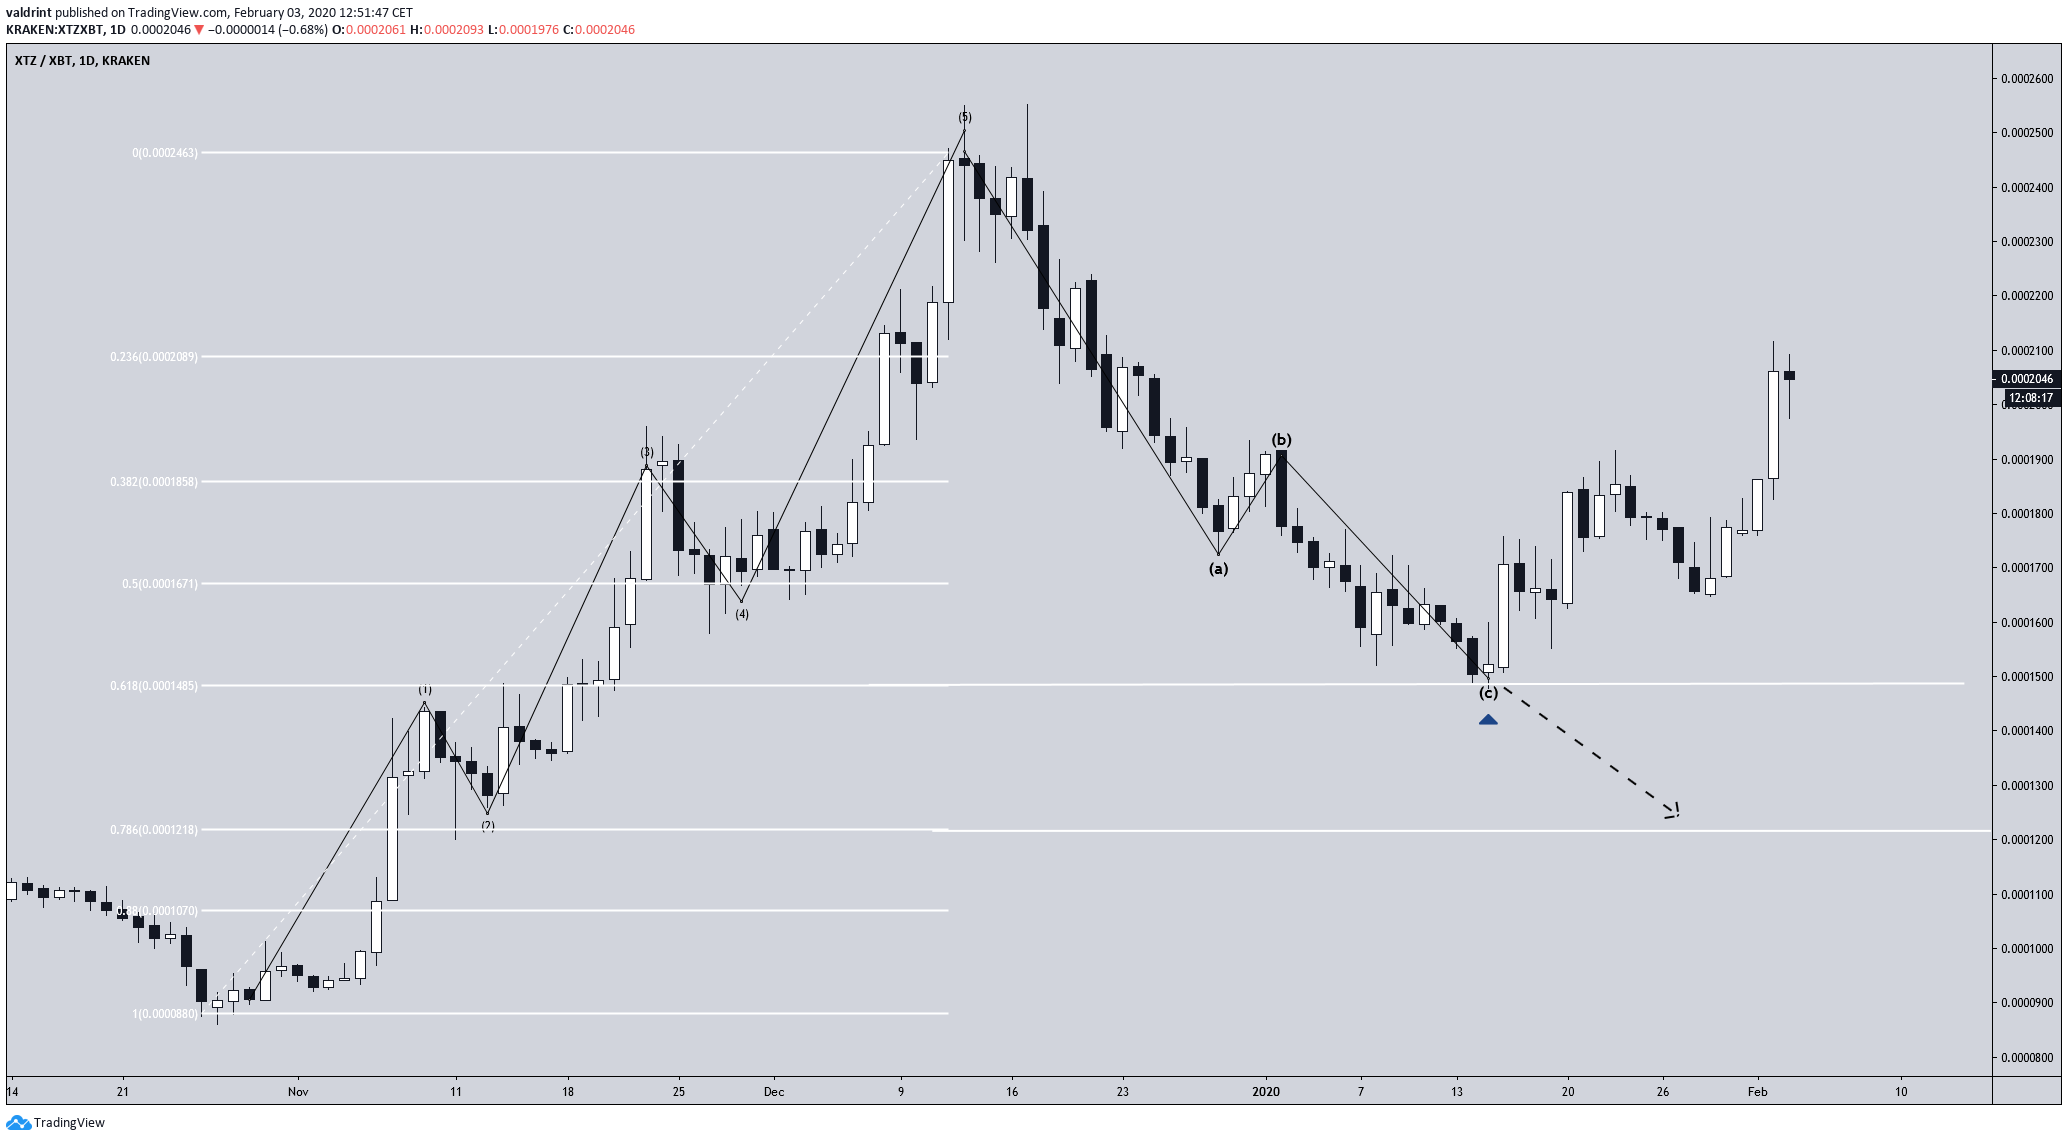
On January 15, the Tezos (XTZ) price completed its correction with a low of 1477 satoshis. The price has been increasing since — moving above an important resistance area.
Tezos Price Highlights
- XTZ has possibly finished an A-B-C correction.
- There is support at 1900 satoshis.
- There is resistance at 2550 satoshis.
- The price has moved above its 50-week moving average (MA).
Trader @TraderLenny tweeted a Tezos price chart while suggesting that, due to its recent price movement, the XTZ has begun another leg upwards.
Price literally exploded right after successfully reclaiming the 1771 sats S/R area.
It's safe to say we've been treated on another leg up. 🚀 pic.twitter.com/RiBnfWYUJm
— TraderLenny (@TraderLenny1) February 2, 2020
How long will the Tezos price continue to increase? Where are the closest targets located? Keep reading below if you are interested in finding out.
End of the Correction
Beginning on October 27, 2019, the Tezos price followed an upward trend for 47 days. The move ended once the price reached a high of 2550 satoshis on December 13. This was an increase of 197 percent. The entire move transpired in five waves.
Afterward, the price began a corrective move that lasted until January 15, 2020, when XTZ made a low of 1477 satoshis. This low coincided with the 0.618 Fib level of the previous upward move — making it a very suitable level to end the correction. This correction transpired in three waves.
Initially, it was not certain whether the price would make a lower low towards the 0.785 Fib level and create an extended C wave. However, the current price increase has invalidated that possibility — suggesting that the correction has likely completed.
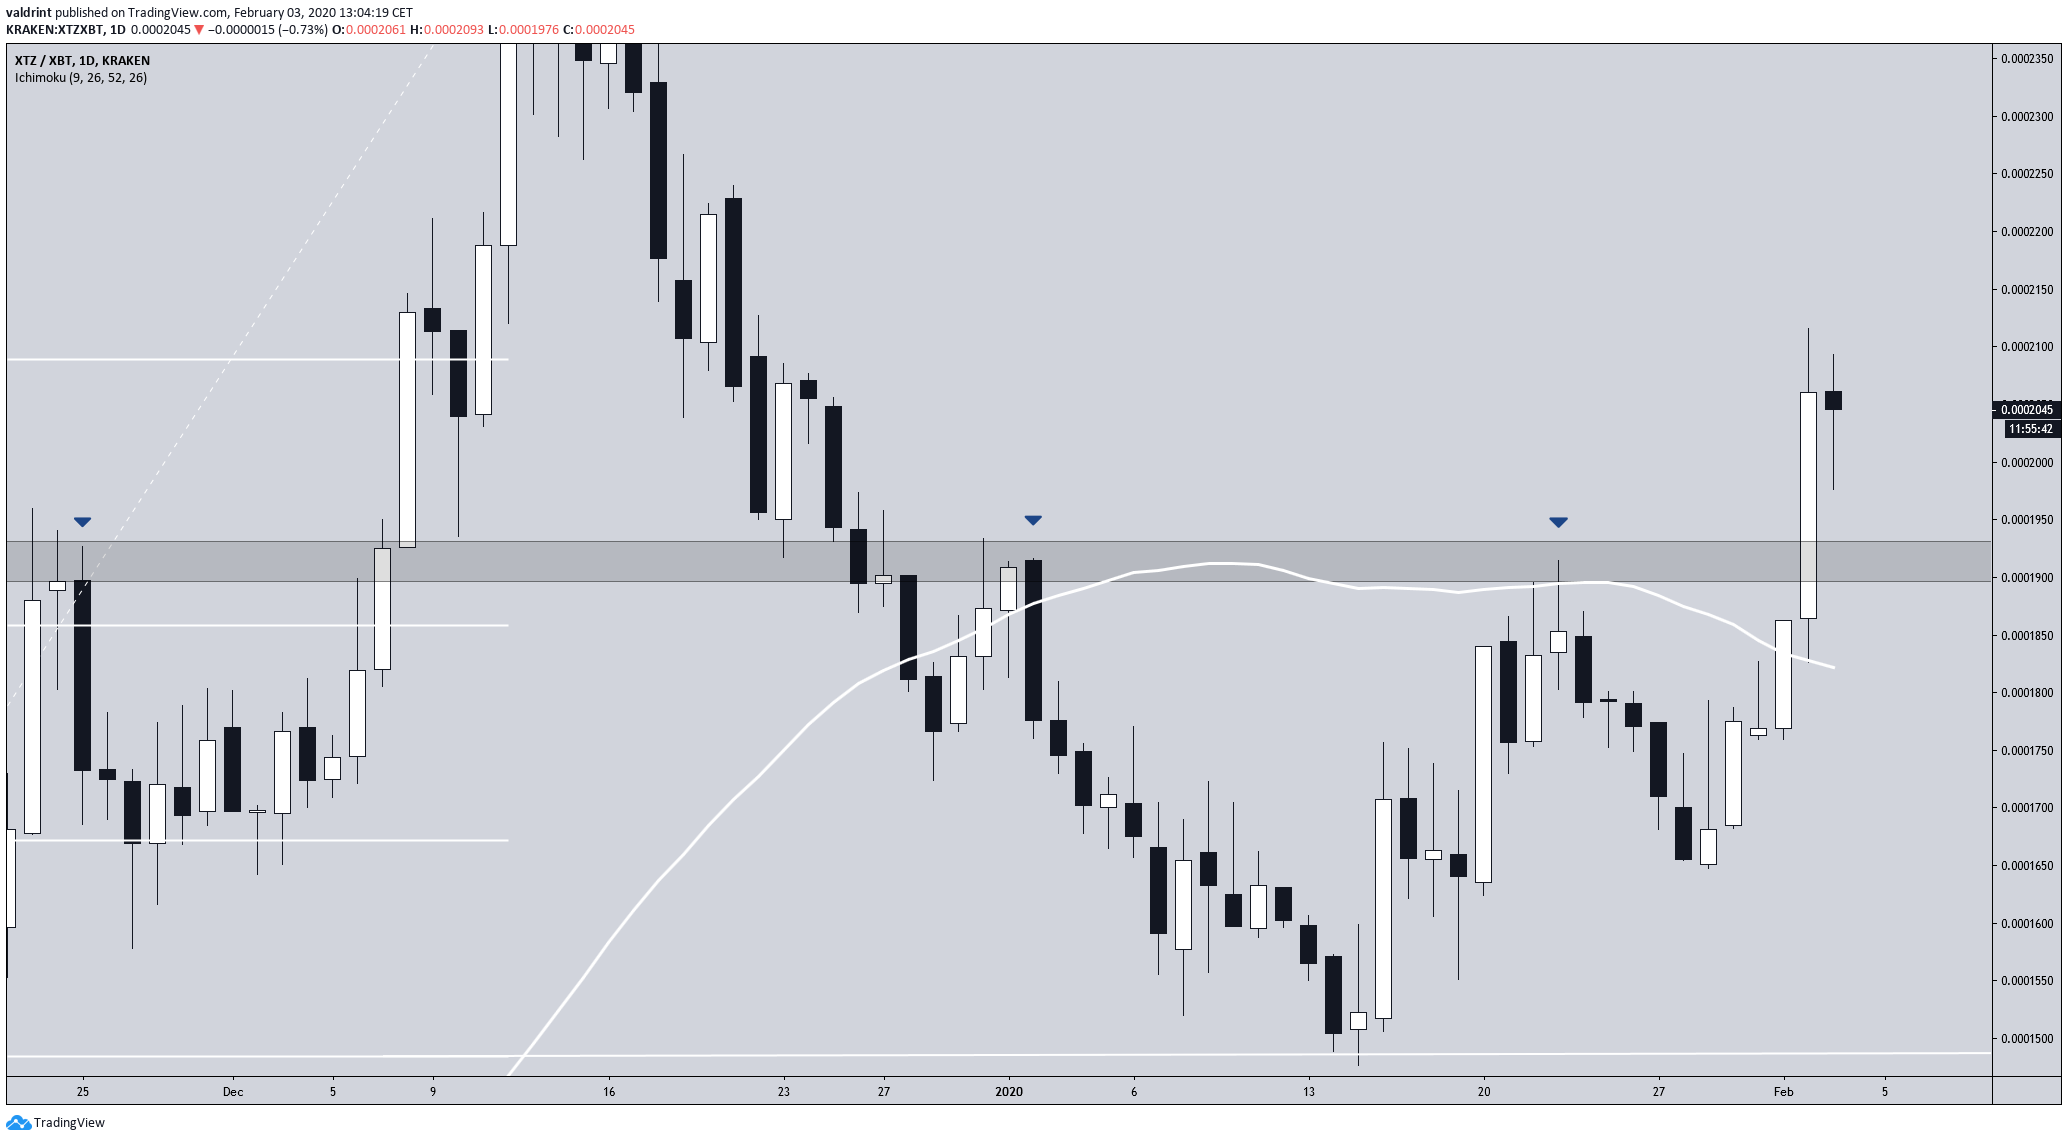
Significant Resistance
The most significant area in the short-term is found at 1900 satoshis — an area strengthened by the presence of the 50-day moving average (MA). The price has confirmed it as resistance several times prior.
Yesterday’s bullish engulfing candlestick was successful in moving above this resistance area. The price has yet to return and validate it as support.
Future XTZ Movement
Since we believe the correction has completed, the ensuing upward move could take the price to new highs. The daily RSI movement supports the hypothesis that the correction is completed — since the RSI moved above the 50-line afterward, where it has been throughout the previous increase.
After a possible decrease to validate the aforementioned 1900 satoshi area, the price could head to its December high of 2550 satoshis. A price increase towards an all-time high of 3000 satoshis is not ruled out.
However, whether the price is successful in getting there remains to be seen and will likely depend on signs of weakness — such as a double/triple top or bearish divergence — once the price reaches the 2550 resistance area.
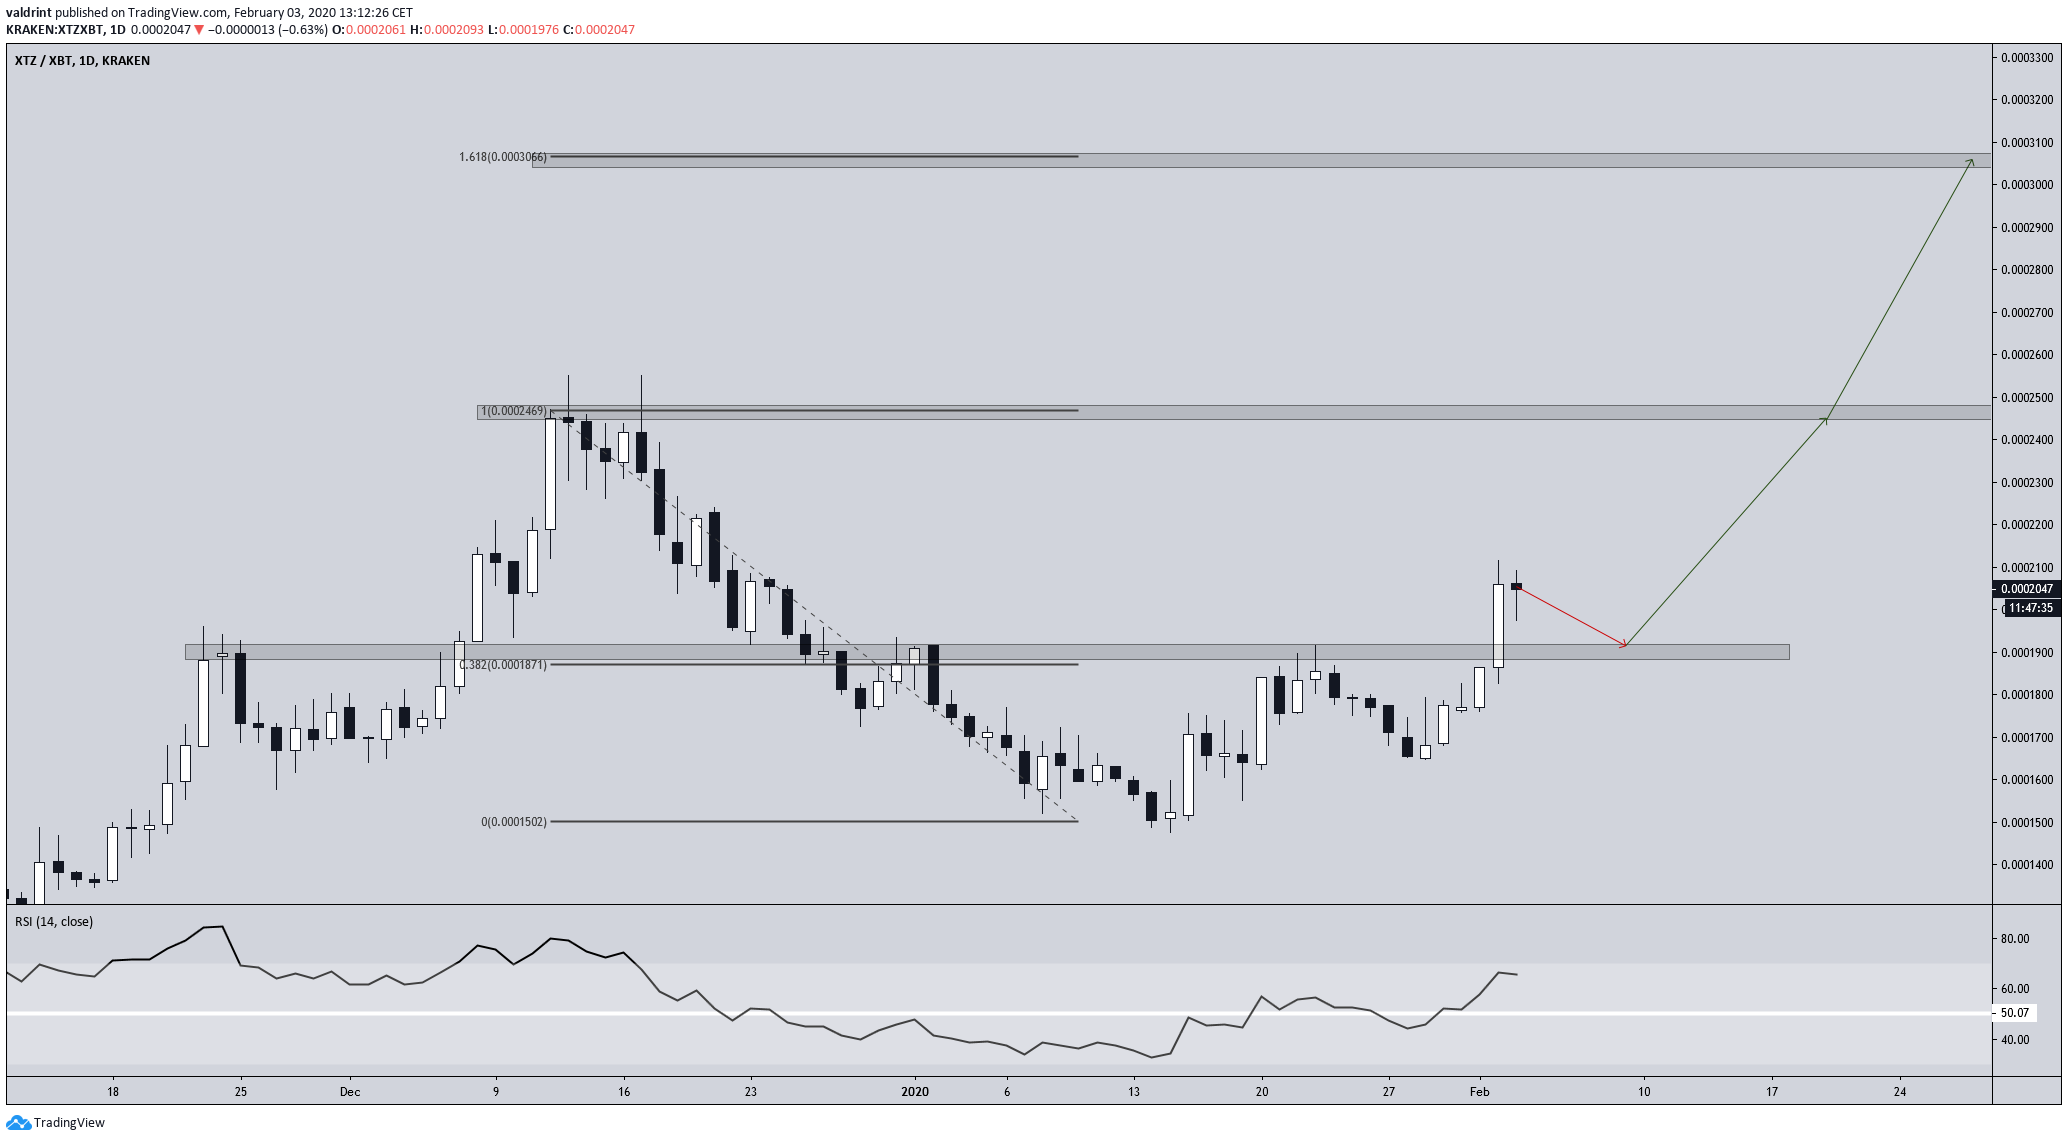
To conclude, the XTZ price has likely finished its correction and begun a new upward move. We are expecting it to eventually revisit the 2550 satoshi highs and possibly be successful in breaking out above.


