


Tezos (XTZ) has dropped considerably since its all-time high, but is still trading above long-term support.
While XTZ is still trading above horizontal and diagonal support, the direction of the trend is unclear.
Long-term XTZ drop
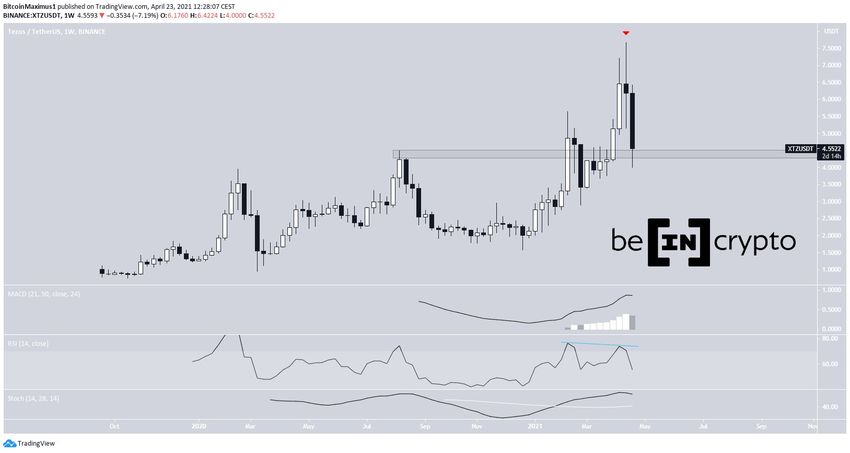
On April 17, XTZ reached a new all-time high (ATH) price of $7.67. However, it dropped shortly afterwards, creating a bearish doji candlestick. It has followed that up, with another bearish candlestick, taking it back to the $4.50 support area.
While the RSI has generated considerable bearish divergence, a drop has already occurred as a result. In addition, both the MACD and Stochastic oscillator are still bullish.
Therefore, as long as the token is trading above $4.50, the trend can still be considered bullish.
XTZ ascending support line
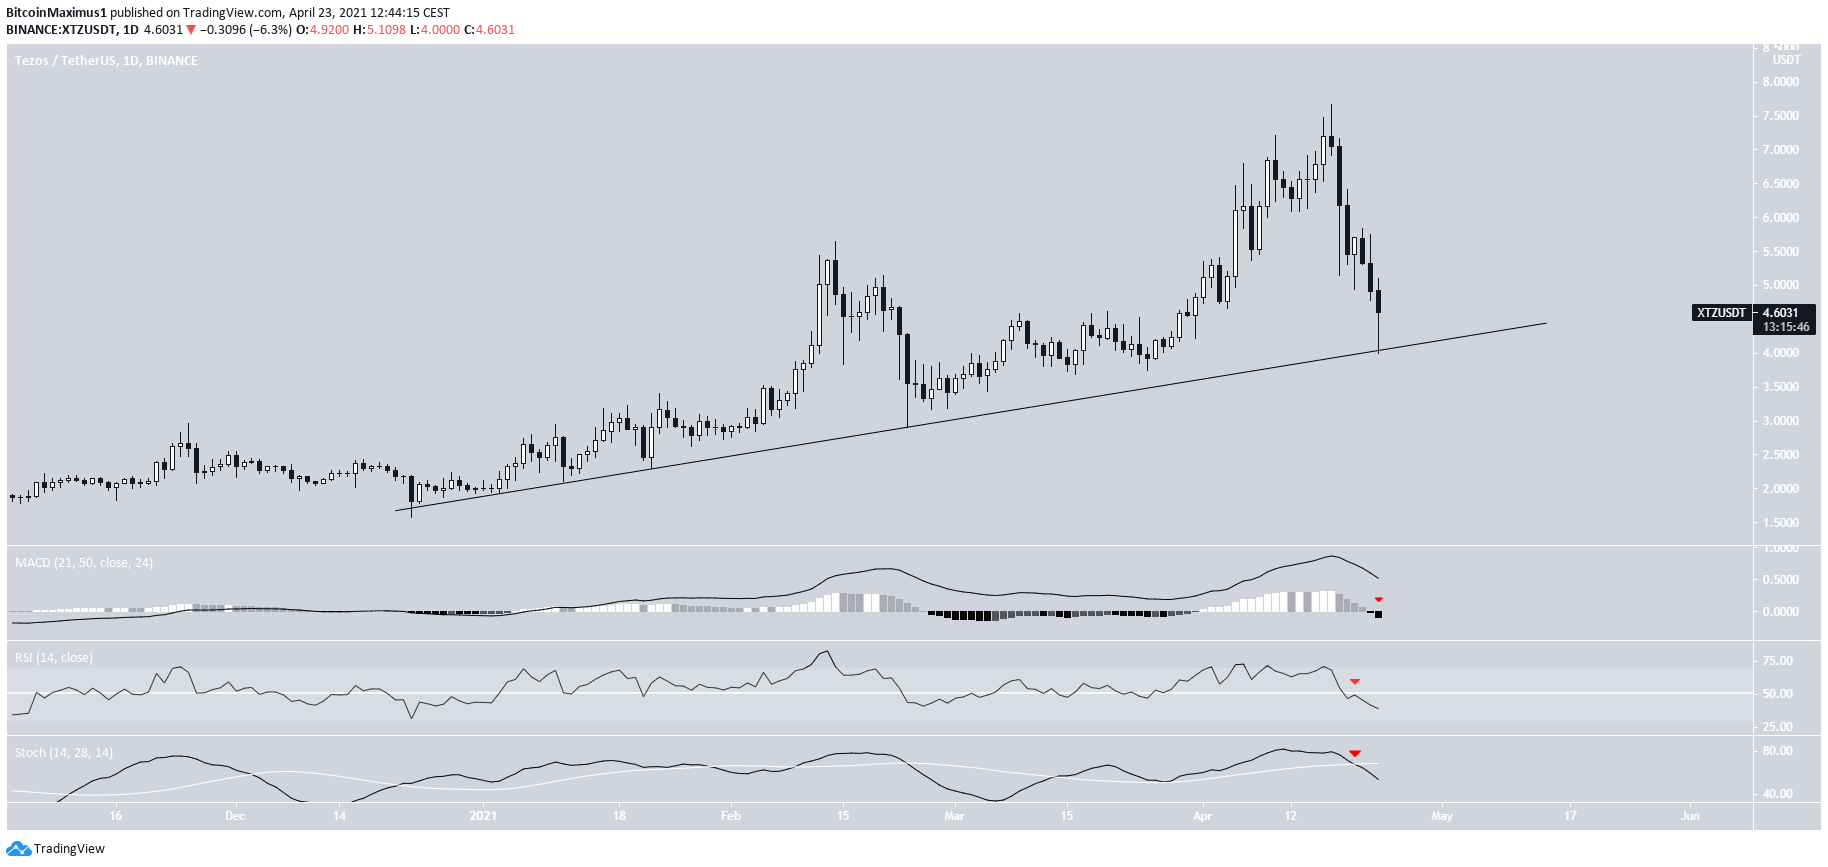
The daily chart shows an ascending support line that has been in place since December 2020. So far, the line has been validated five times, most recently on April 23.
However, despite the bounce, technical indicators are bearish. Therefore, despite the price action still being bullish, we cannot determine the direction of the trend.
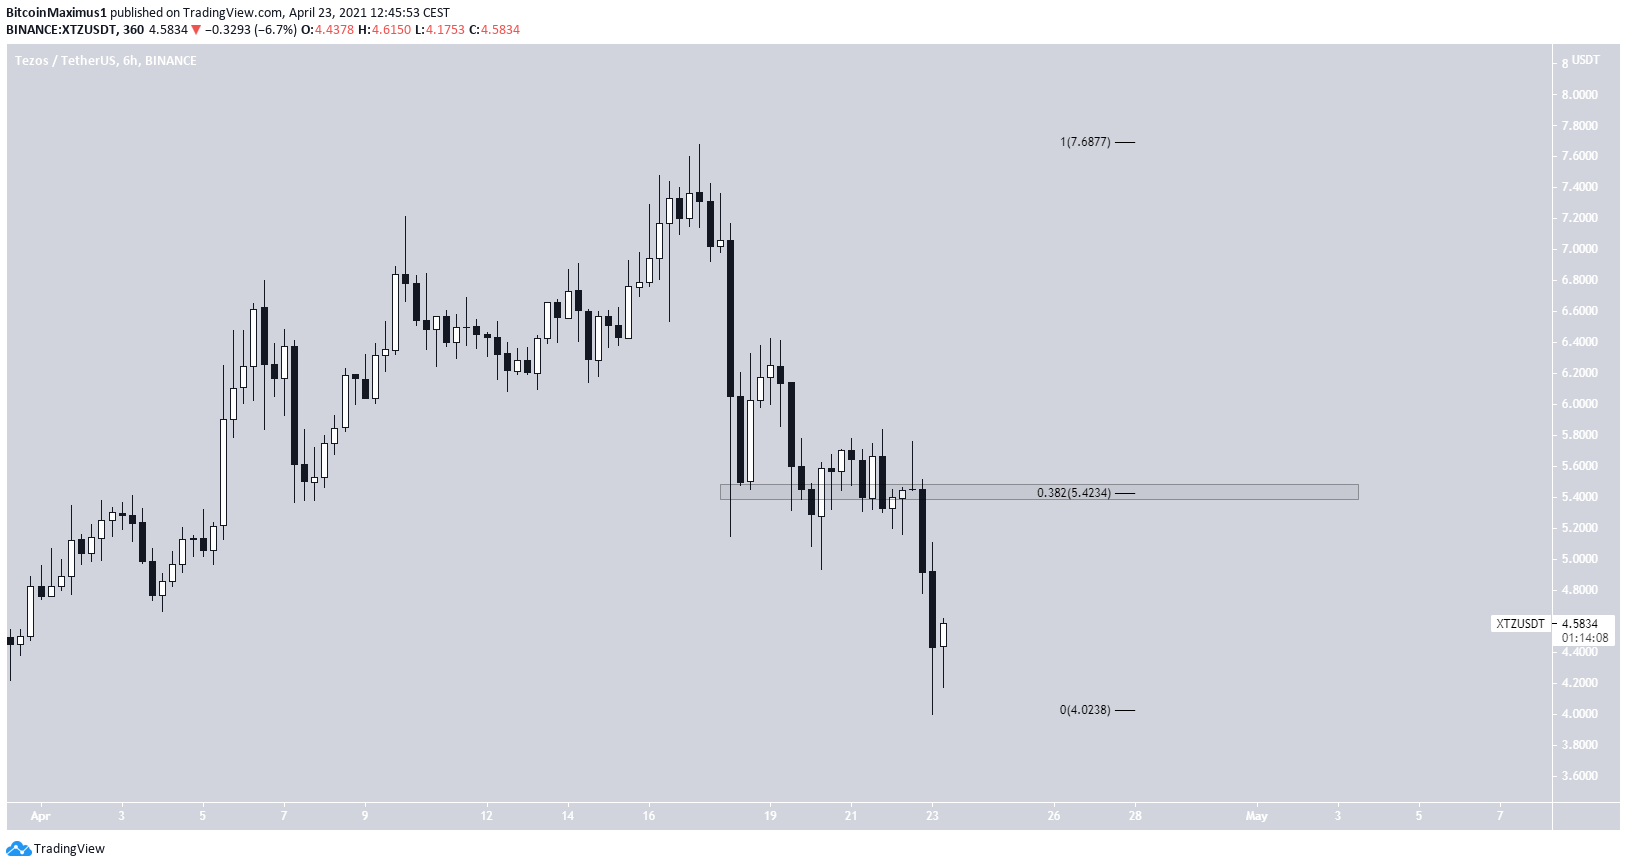
The six-hour chart provides the first minor resistance area, found at $5.42. This is both a horizontal resistance area and the 0.382 Fib retracement level when measuring the entire downward movement.
Until this level is reclaimed, the trend cannot be considered bullish in any way.
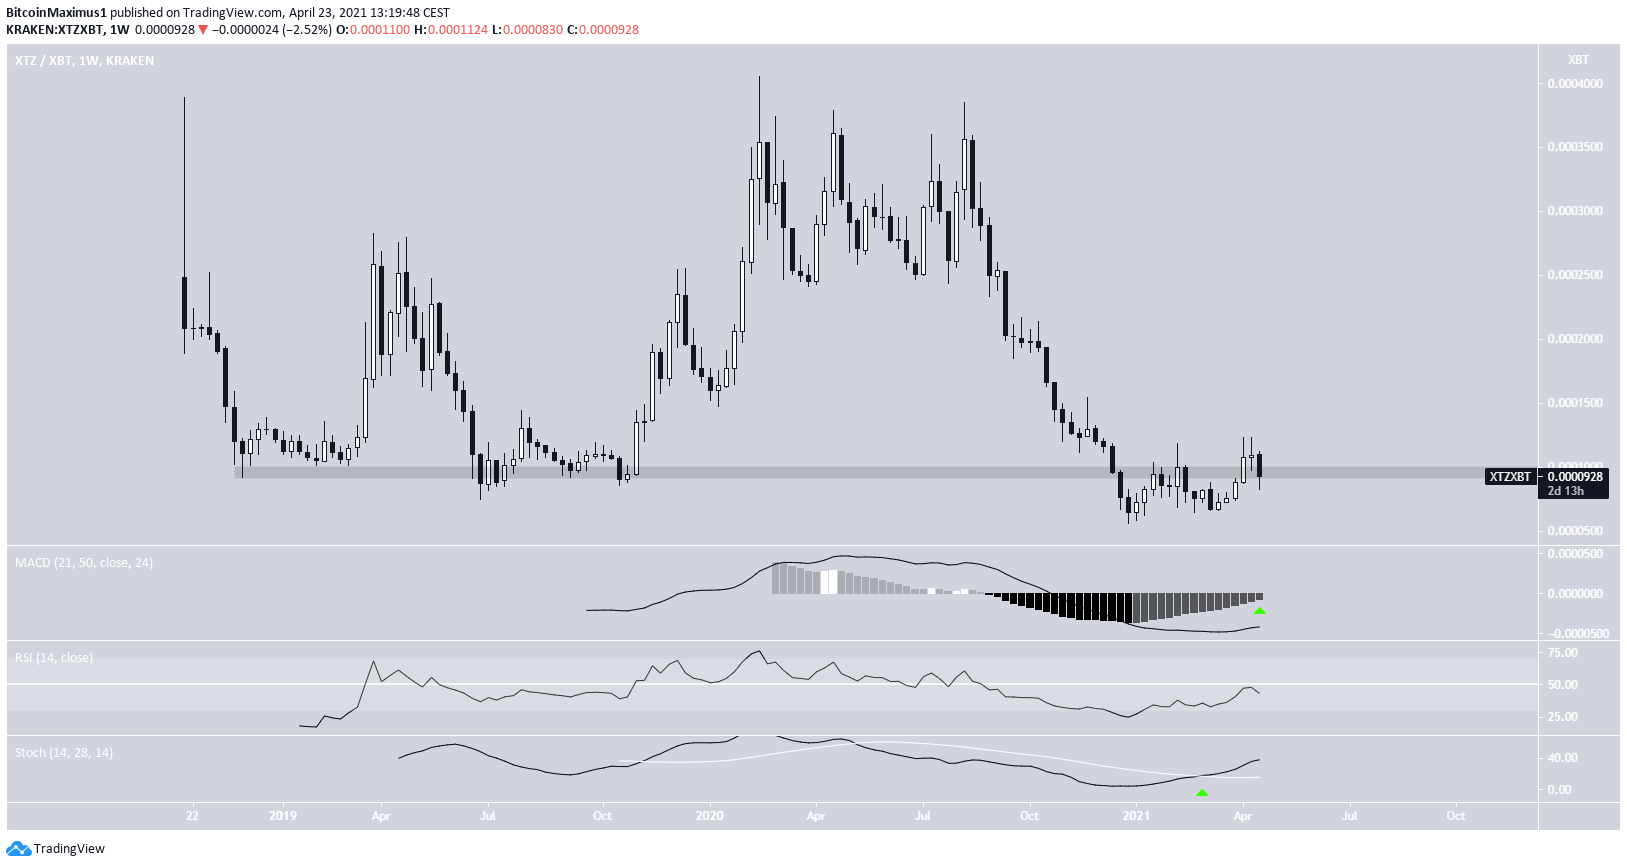
XTZ/BTC
Cryptocurrency trader @PayneCrypto outlined a XTZ/BTC chart, which shows an ongoing breakout from the 12,000 satoshi area.
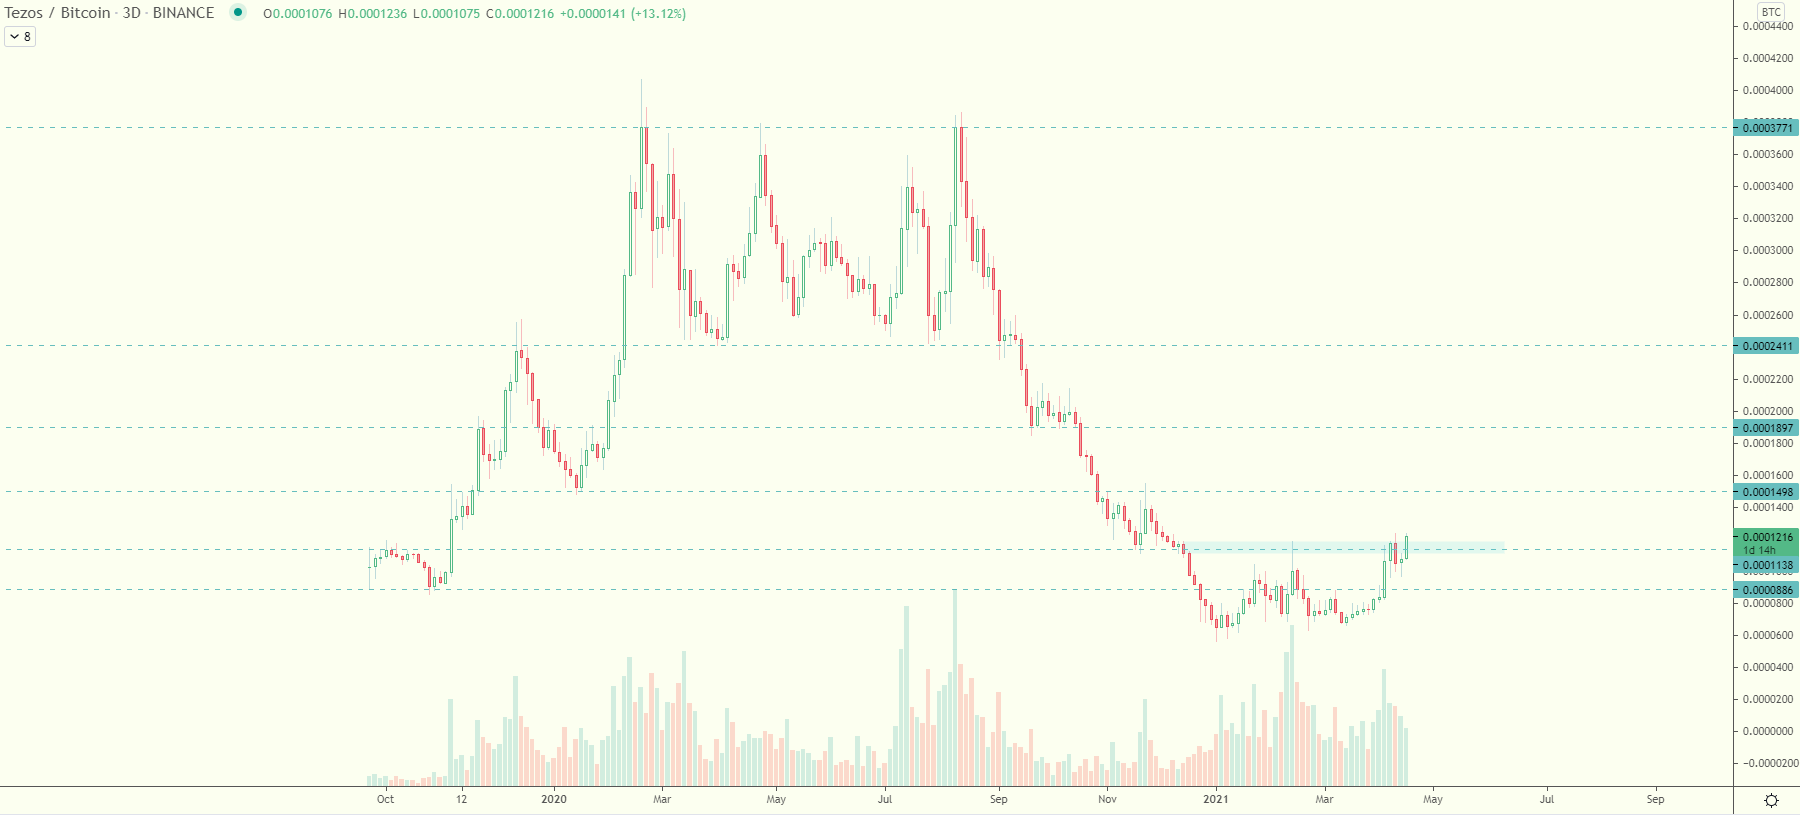
However, since the tweet, the token has fallen below this level. Currently, it is attempting to reclaim the 9,500 satoshi area as support.
This is an important level since it has previously acted as the all-time low support level. If it is successful in doing so, it could be the catalyst for a very significant upward movement.
Technical indicators support the beginning of this move.
To conclude, despite trading above numerous supports, the direction of the XTZ/USD trend is unclear.
XTZ/BTC is attempting to reclaim the 9,500 satoshi area.
For BeInCrypto’s latest bitcoin (BTC) analysis, click here.


