On June 11, the prices of both Tezos (XTZ) and Chainlink (LINK) created bearish engulfing candlesticks that caused breakdowns from their respective long-term ascending support lines. It’s possible that both have just begun a corrective phase.
Tezos (XTZ)
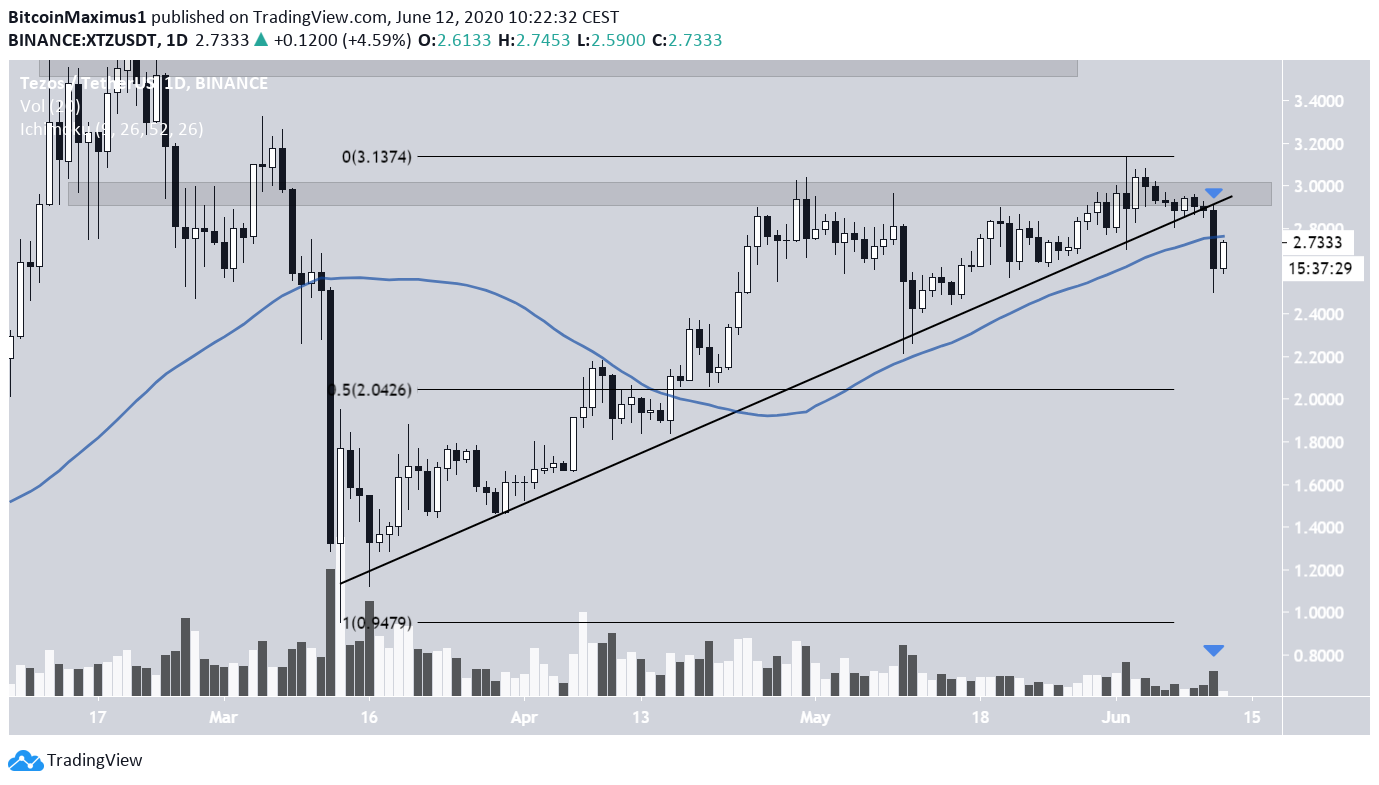
On June 11, the XTZ price created a bearish engulfing candlestick that caused it to break down from the long-term ascending support line, which had previously been in place since March 13. In addition, the price lost the support of the 50-day moving average (MA), above which it had been trading since April 16.
The breakdown occurred with significant volume and took place after the price failed to move above the main resistance area at $3, even though it had previously moved slightly above it in the form of a long upper wick.
Since such a long-term support line has been broken, it’s possible that the price has begun a longer-term correction. If so, it will decrease all the way to the 0.5 Fib level of the entire movement at $2.05.
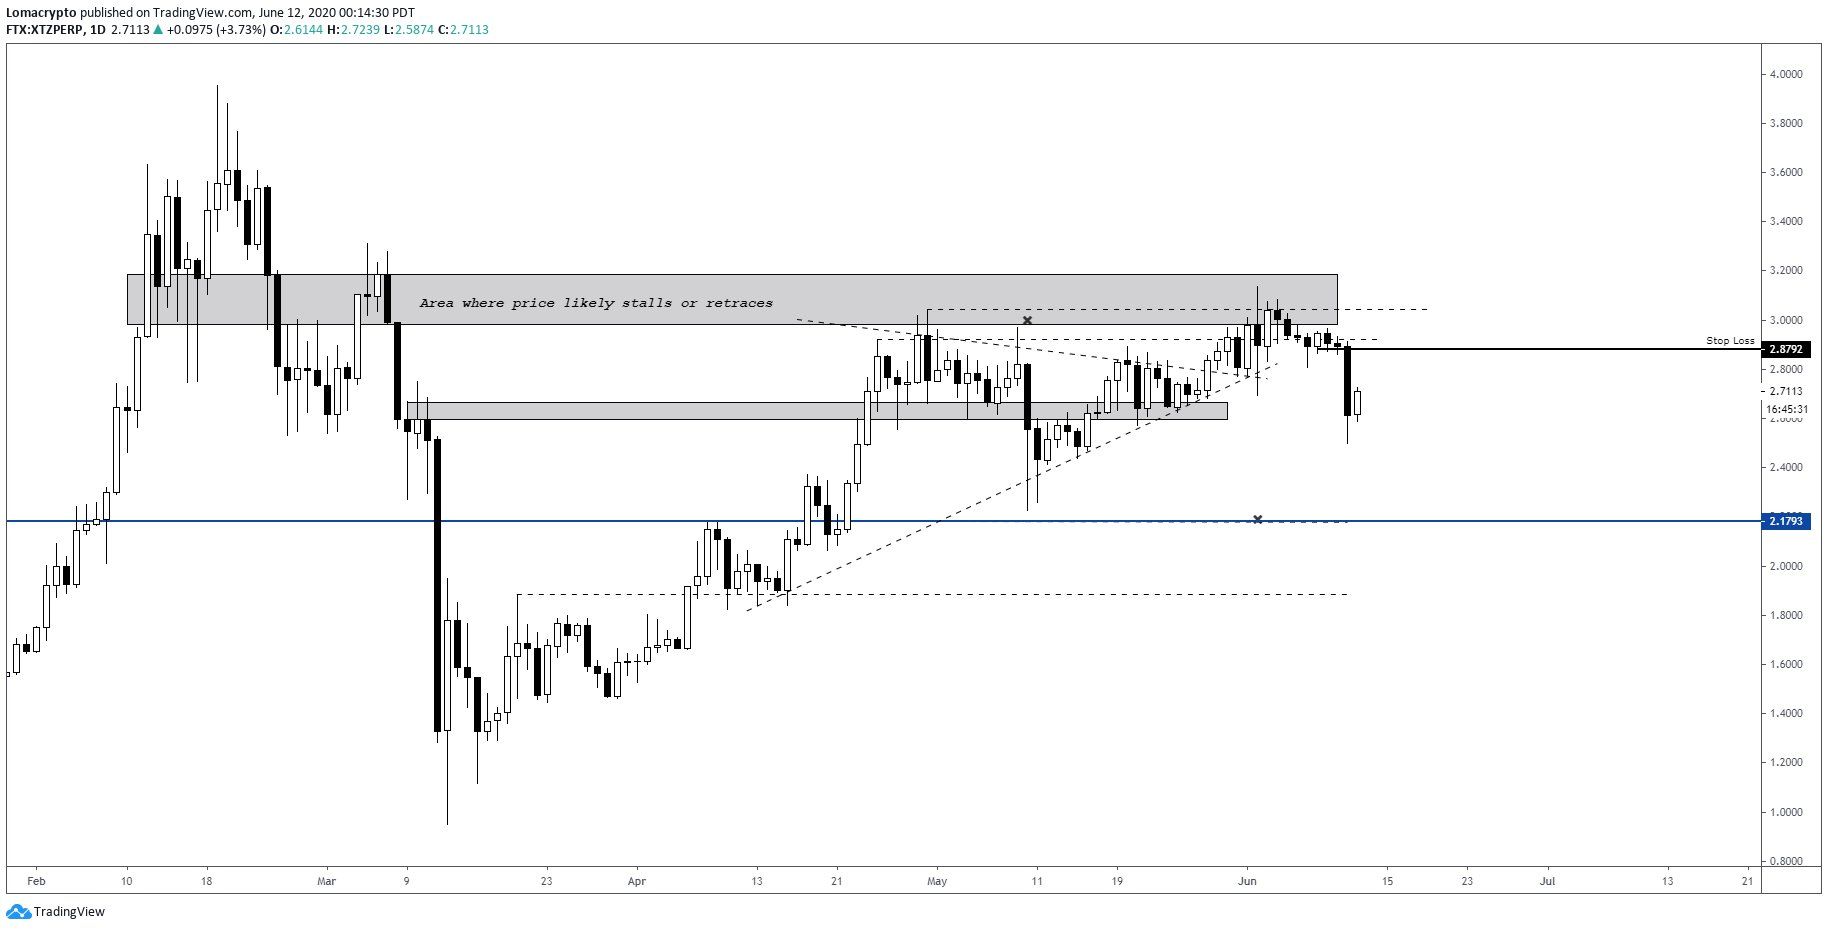
Cryptocurrency trader @Lomahcrypto stated that he had exited the remainder of his long position. He also outlined a major support area at $2.17, very close to ours:
Stopped out of remainder of my position at $2.88.
And that’s why it’s important to re-evaluate your stops/exits as the setup progresses.
If you’re up big on a trade and end up having it run all the way back and stopping you out for 1-2%… that’s a tragedy.
Chainlink (LINK)
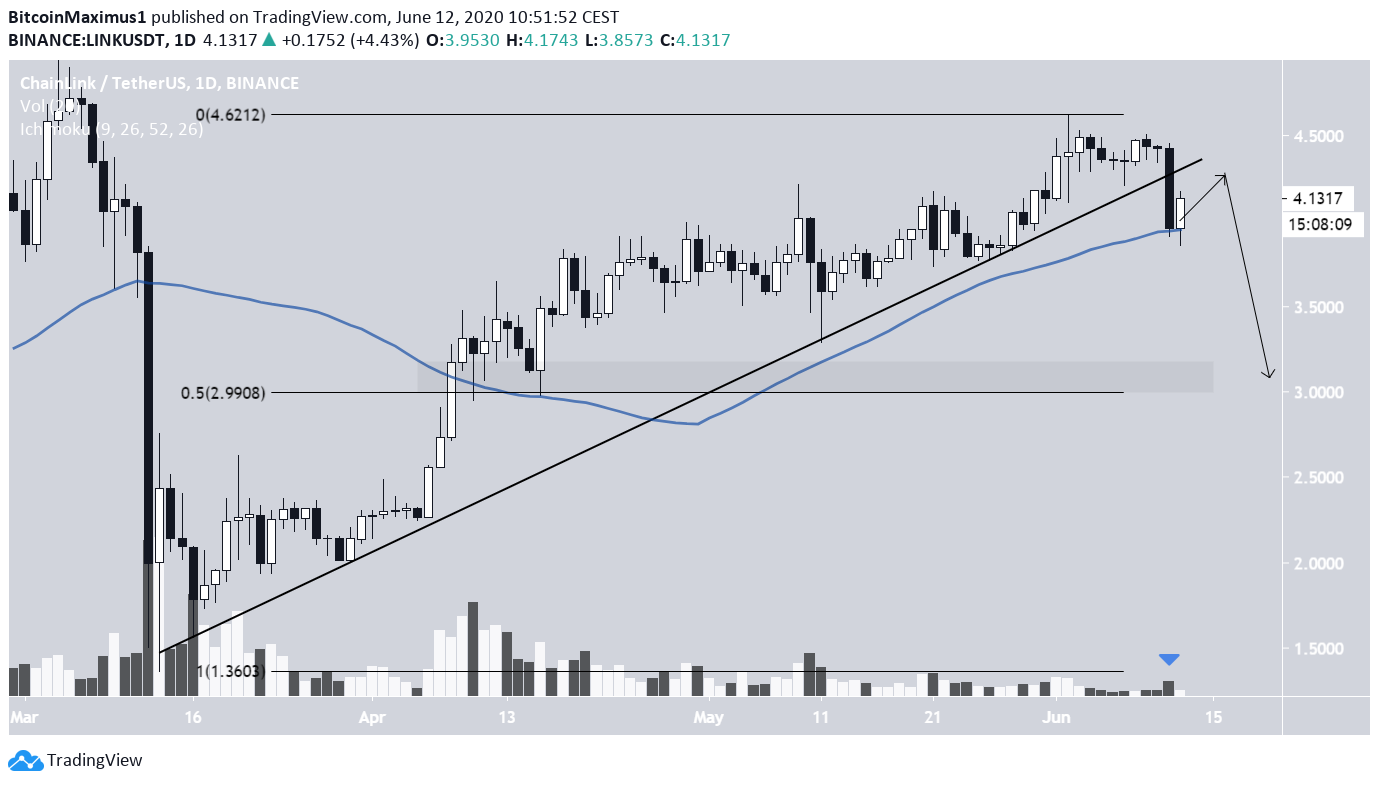
Similar to XTZ, the LINK price has created a bearish engulfing candlestick on June 11. It broke down from an ascending support line it had been following since March 13. However, unlike XTZ, the price has found support above the 50-day MA.
Bulls supported the price here, and it initiated a bounce, validating the ascending support line near $4.3. It did, however, eventually resume its decline towards $3, the 0.5 Fib level of the entire upward move.
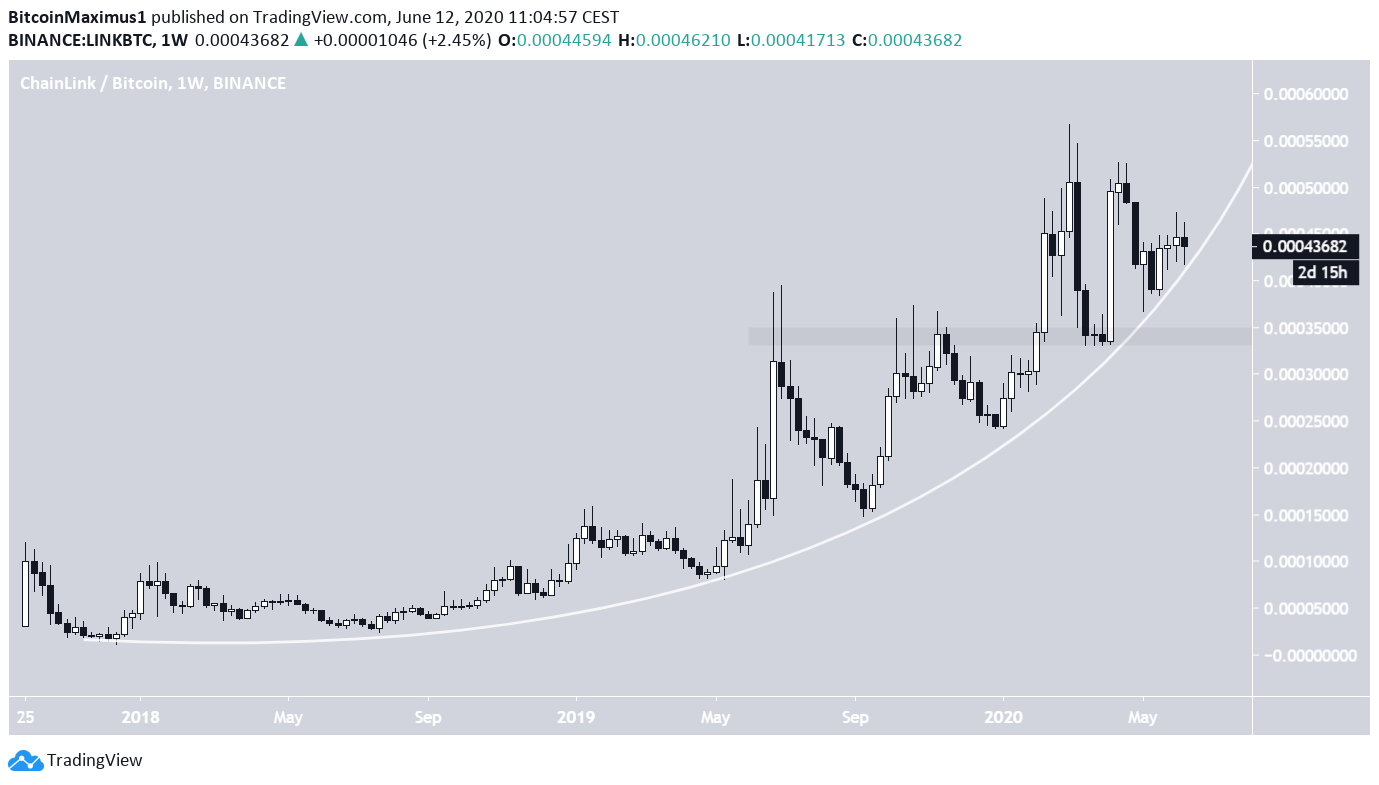
An interesting fact was outlined by Pentosh1, who explained that the nearly three-year upward trend has ended for LINK/BTC.
Indeed, the price is currently trading right at this curved ascending support line, which has been in place since the upward move began. A breakdown from this line would indicate that the trend is over, and will likely decline towards 35,000 satoshis.