


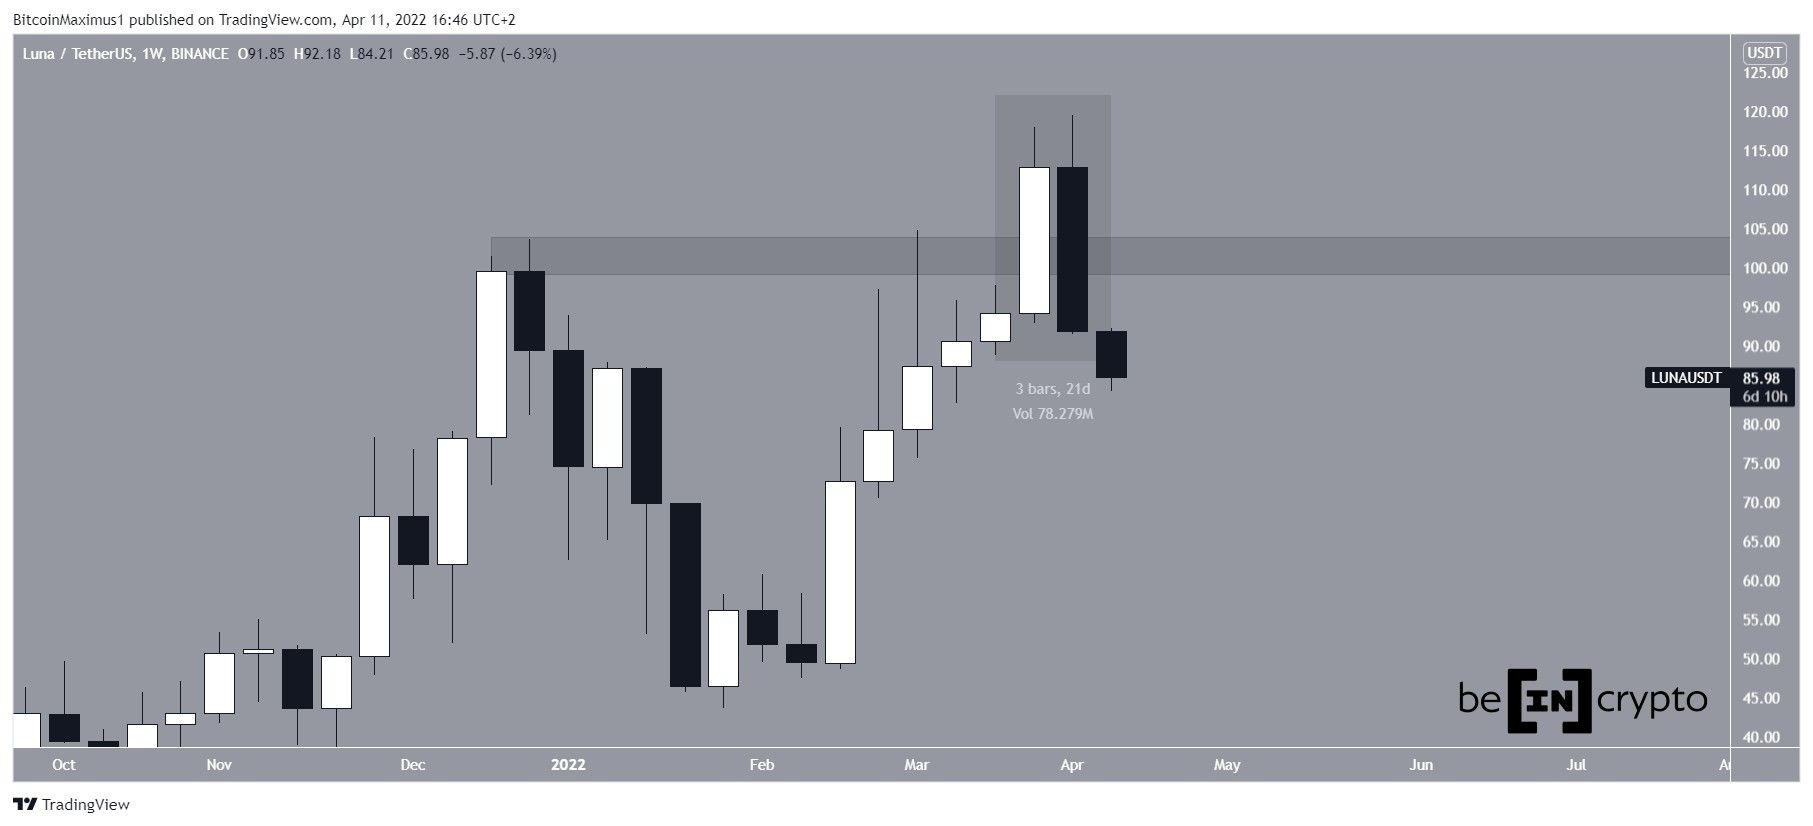
Terra (LUNA) decrease sharply during the week of April 4-10, potentially signaling the end of its long-term upward movement.
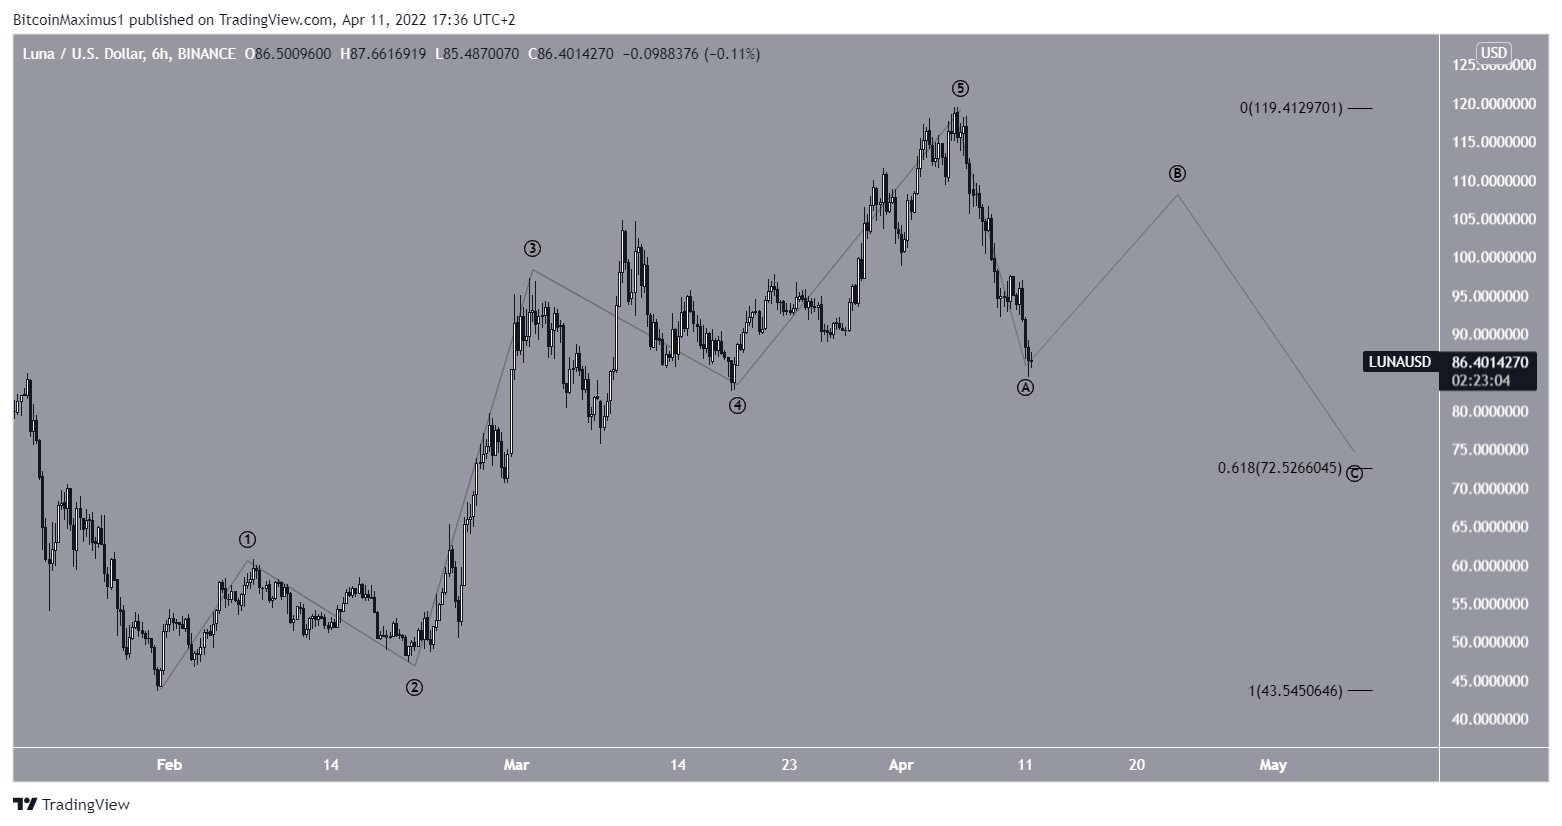
LUNA has been falling since reaching an all-time high price of $119.55 on April 5.
During the week of April 4 – 10, it created a bearish engulfing candlestick. This is a type of bearish pattern in which the entire increase from the previous week is negated in the next one.
In addition to this, the price has fallen below the $100-105 horizontal area, which had previously acted as the all-time high resistance area.
Therefore, the breakout that led to the all-time high is now considered a deviation. The $100-105 area is now expected to provide resistance once more.
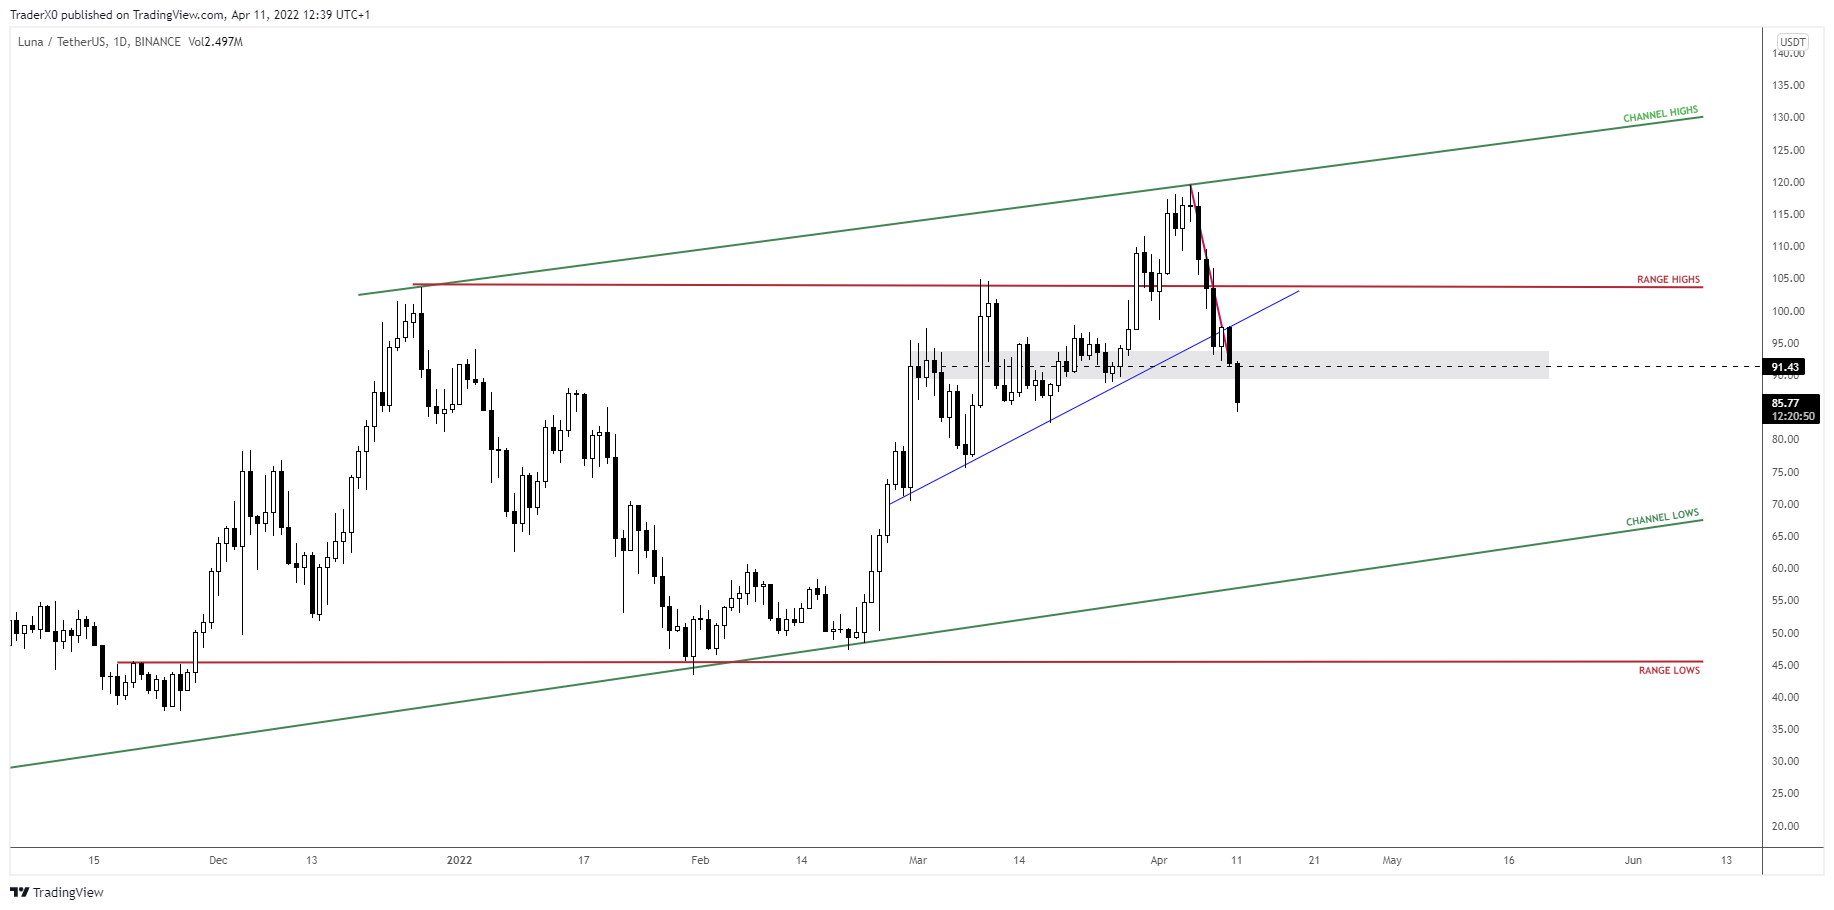
Cryptocurrency trader @Trader_XO tweeted a chart of LUNA, stating that the price could fall all the way down to $70.
While the weekly time frame does look bearish, a look at technical indicators is required in order to determine if LUNA will continue falling.
Bearish indicators
Similarly to the price action, technical indicators in the weekly time-frame are bearish. This is visible by the bearish divergence (green line) that has developed in the RSI.
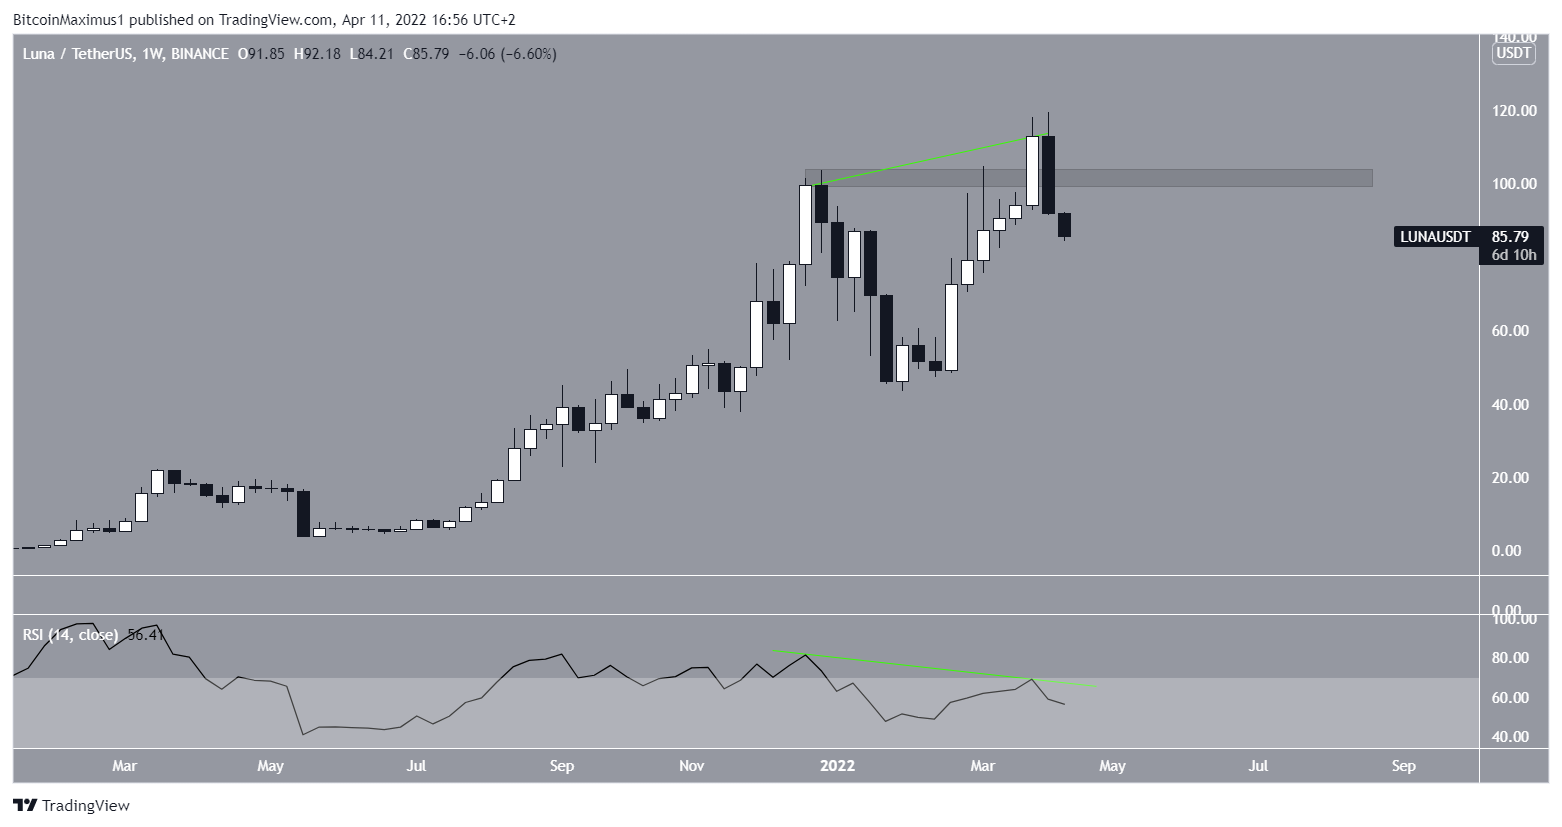
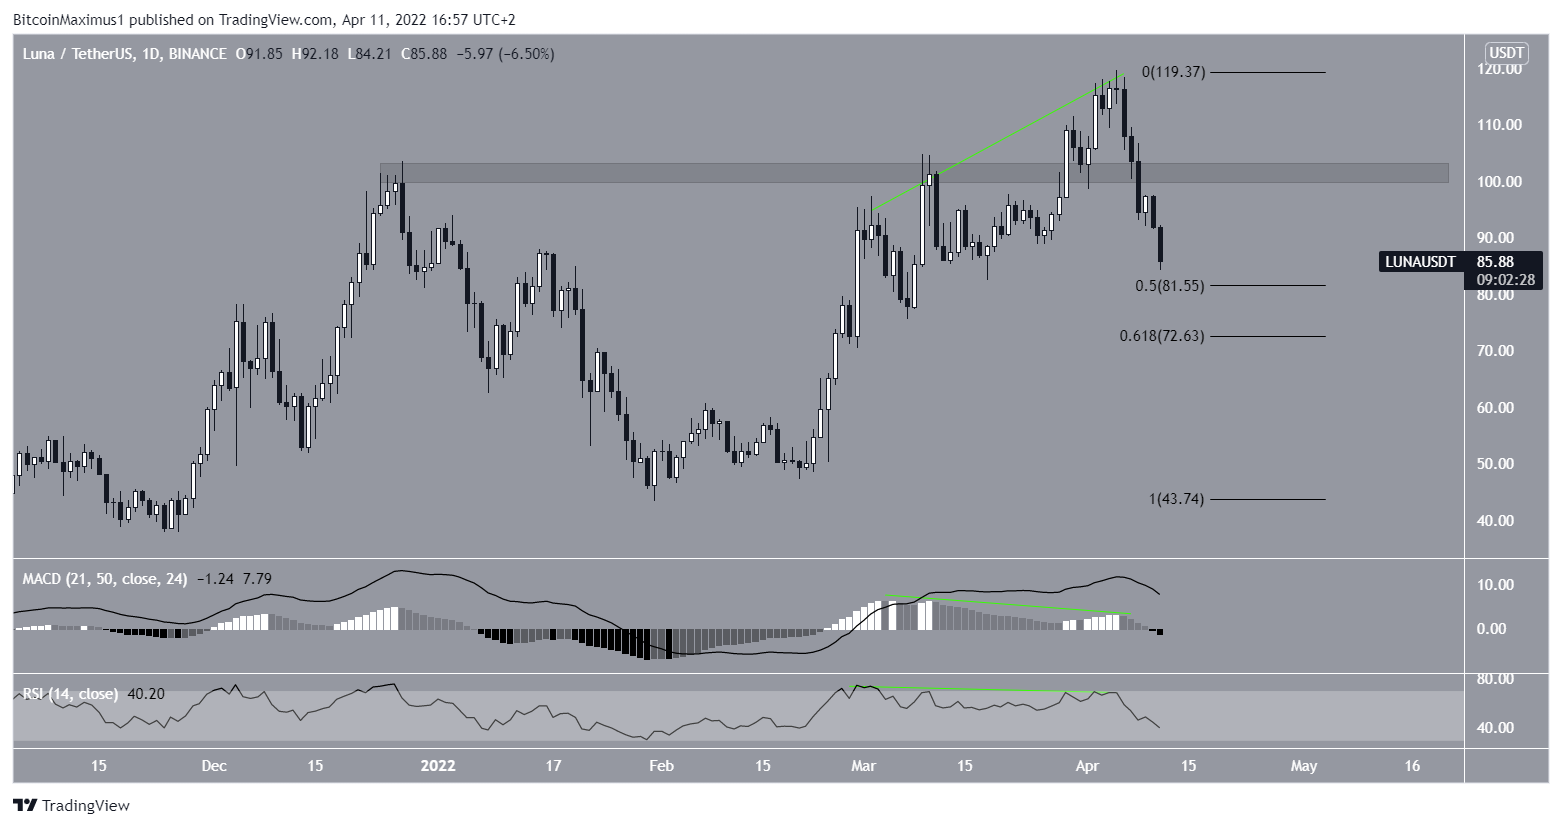
In addition to this, there are bearish divergences in both the daily RSI and MACD, which preceded the ongoing drop.
Currently, the price is trading just above the 0.5 Fib retracement support level at $81.55. The next support area is at $72.60, created by the 0.618 Fib retracement support level.
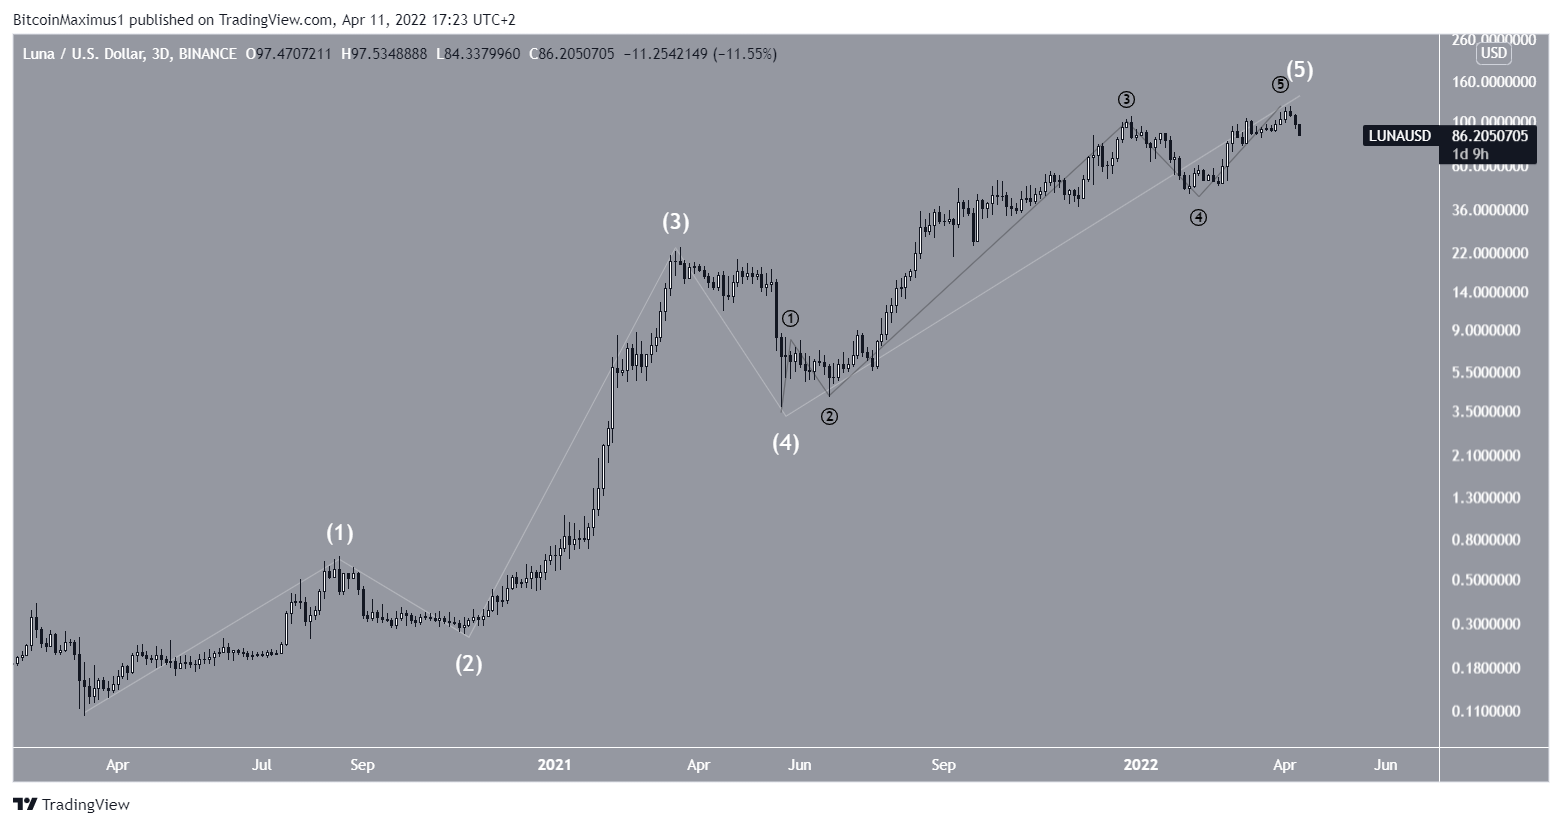
LUNA wave count analysis
Measuring from the March 2020 bottom, it is possible that LUNA has completed a five wave upward movement. The sub-wave count is given in black and shows that wave five has possibly reached its conclusion.
This does fit with the bearish divergences and deviation above all-time high.
If the count is accurate, it would mean that LUNA has begun a long-term correction, in which the entire movement since March will correct prior to a new upward movement.
In addition to this, the increase since the beginning of Feb seems to have come to an end. Therefore, at the very least, a correction of that movement towards $70 would be expected, even if the entire market cycle has not ended.
For BeInCrypto’s latest Bitcoin (BTC) analysis, click here


