


The Swipe (SXP) price has been declining alongside a descending resistance line since the beginning of September and is currently very close to falling to a new all-time low.
However, technical indicators are bullish, suggesting that SXP will break out instead.
Long-Term Resistance Line
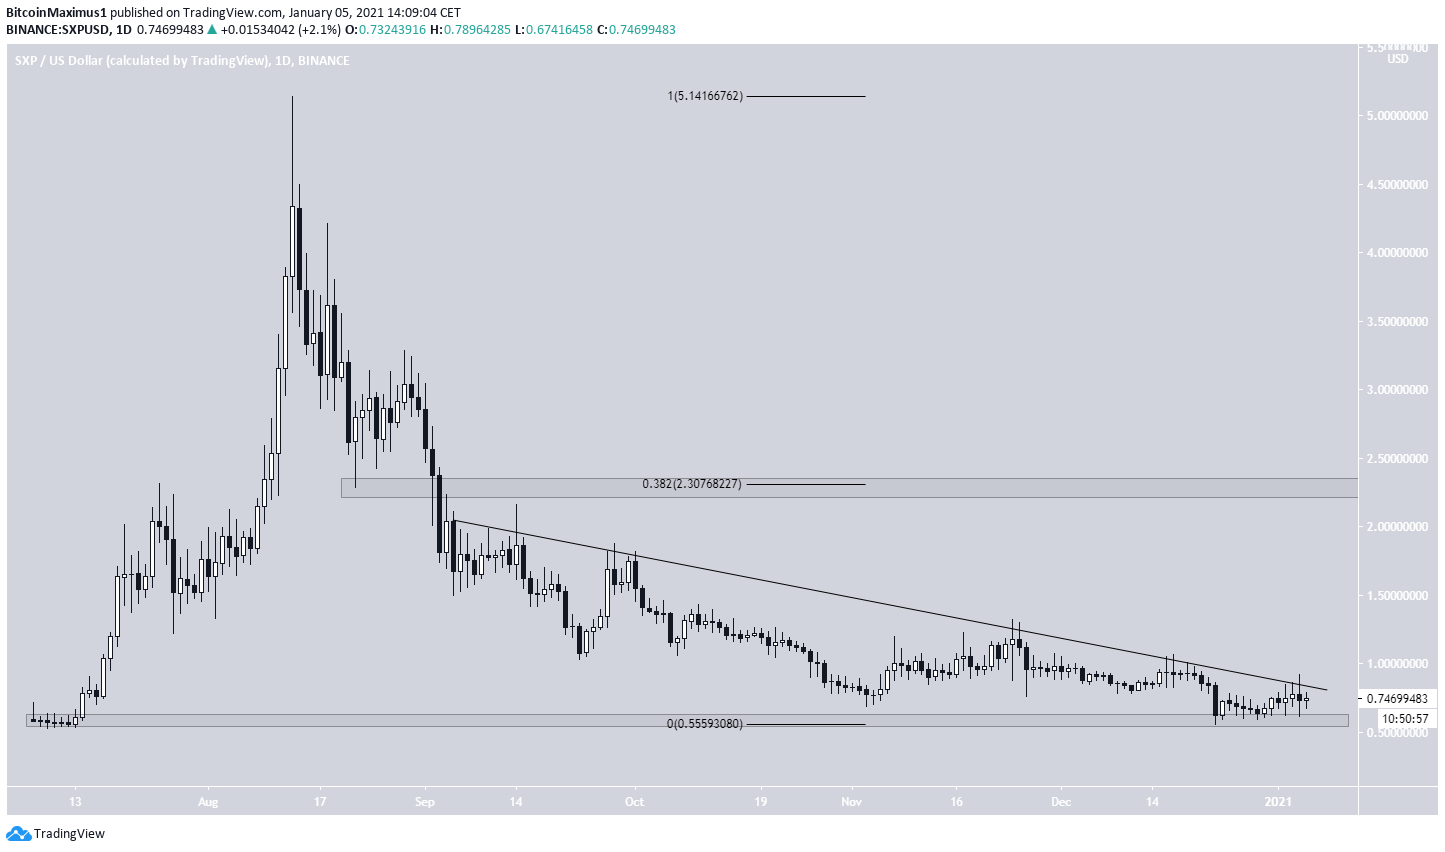
SXP has been decreasing rapidly since reaching a high of $5.14 on Aug. 14. The fall has been swift, and SXP has been following a descending resistance line since Sept. 03. To date, SXP has made five unsuccessful attempts at breaking out, the most recent one on Jan. 4.
Currently, it’s trading very close to an all-time low price of $0.60.
Due to the magnitude of the drop, the closest significant resistance area is at $2.30, the 0.382 Fib retracement level measured from the previous Aug. 14 high.
Future Movement
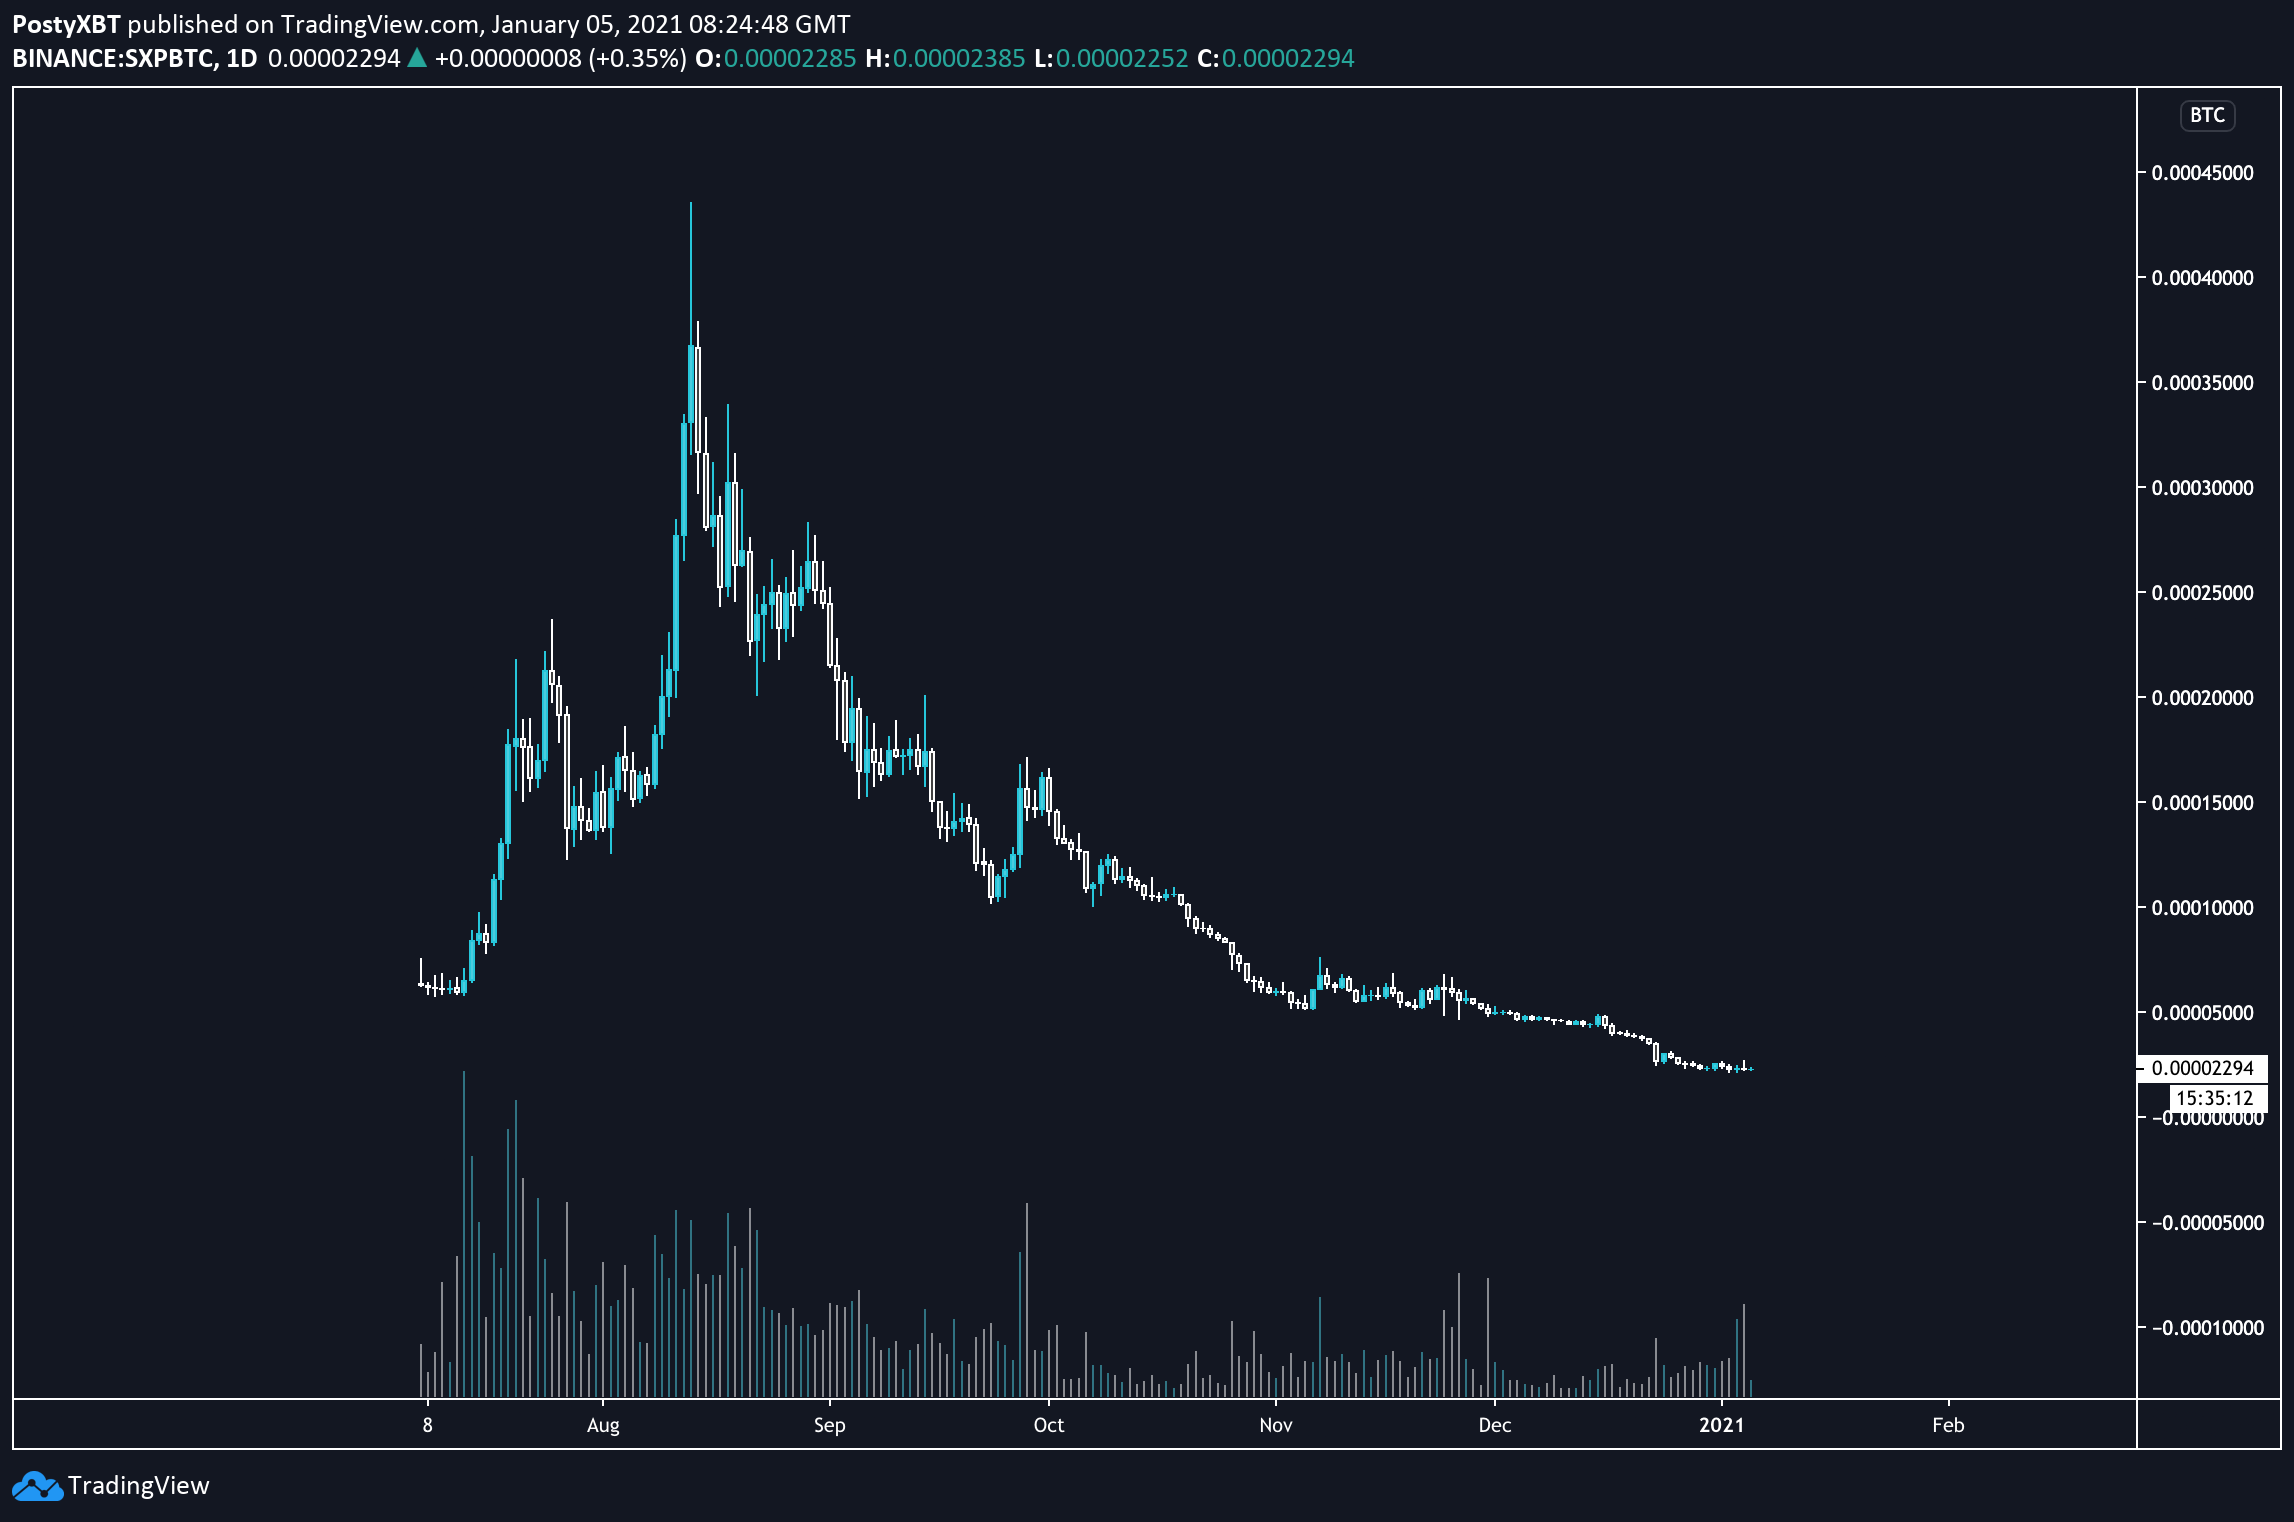
Cryptocurrency trader @PostyXBT outlined an SXP chart, which shows its continuing descent towards bearish price discovery.
However, if it were to break out from the resistance line, it would likely initiate a significant upward move.
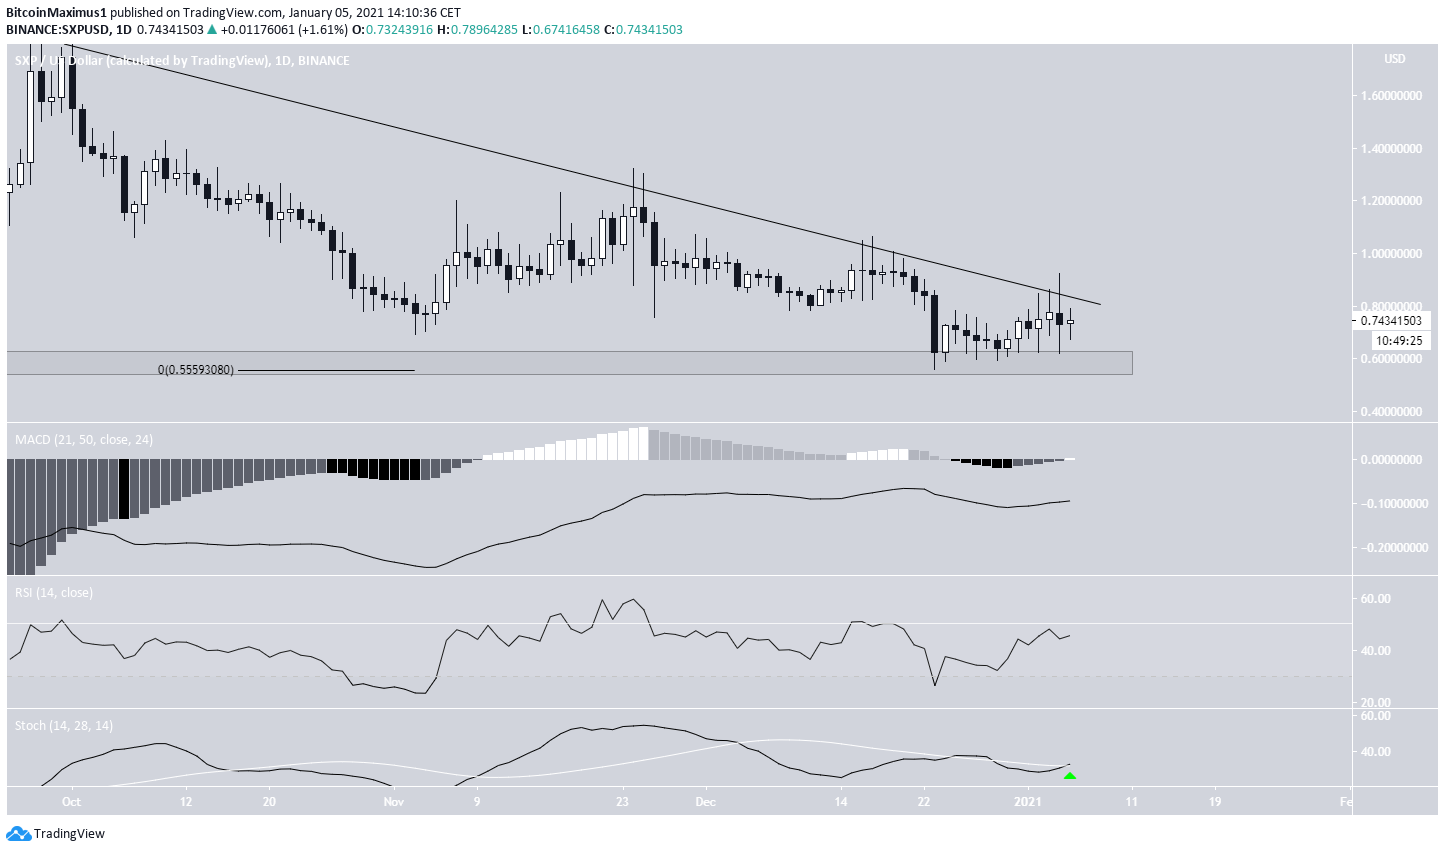
Technical indicators support the possibility of a breakout. Both the RSI and the MACD are increasing, though the former is still below 50 while the latter is below 0. The Stochastic Oscillator has already made a bullish cross.
A breakout from the descending resistance line would confirm the bullish trend and that SXP is gradually moving towards the $2.30 resistance area.
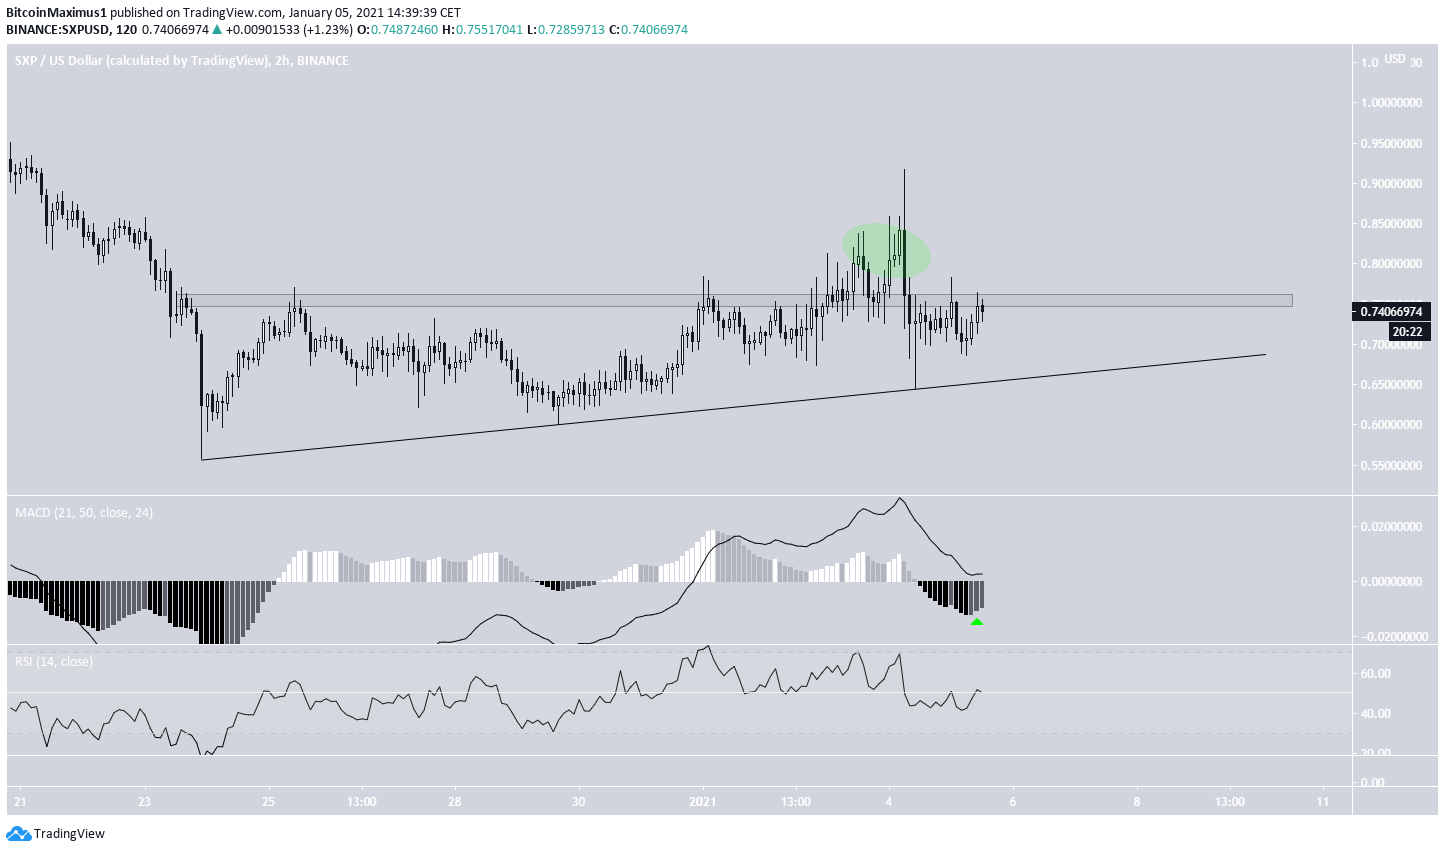
This possibility is also supported when looking at the two-hour chart, which shows an ascending support line and what resembles an ascending triangle, albeit with a significant deviation above the $0.75 resistance area.
Nevertheless, the triangle is a bullish reversal pattern, and the MACD supports the possibility of a breakout.
Therefore, SXP should eventually break out and gradually move towards $2.30.
Conclusion
To conclude, SXP is likely to break out from the current resistance area and gradually increase towards the next closest resistance at $2.30.
A breakdown from the short-term ascending support line would invalidate this possibility and suggest that SXP is falling towards a new all-time low instead.
For BeInCrypto’s latest Bitcoin (BTC) analysis, click here!
Disclaimer: Cryptocurrency trading carries a high level of risk and may not be suitable for all investors. The views expressed in this article do not reflect those of BeInCrypto.


