The Swipe (SXP) price is approaching the $3.70 area, potentially making its third breakout attempt.
SXP has broken out from a short-term resistance level. Therefore, it is expected to do the same with the $3.70 resistance area eventually.
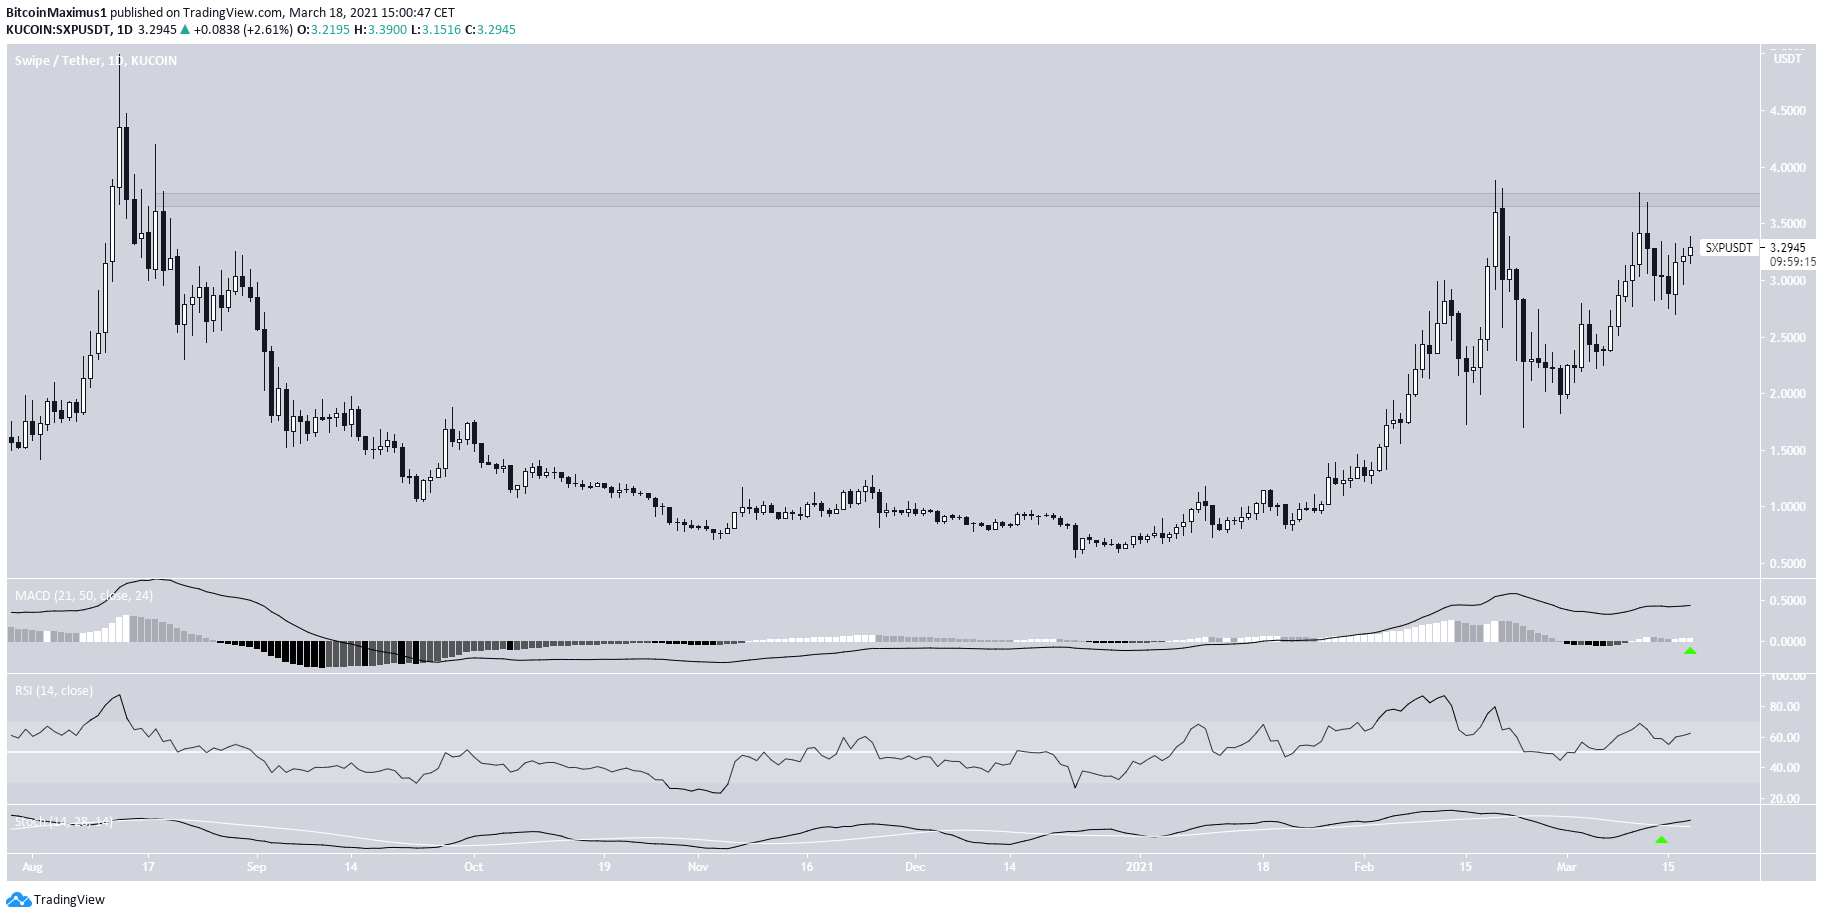
SXP Approaches Resistance
The token has been moving upwards since reaching a low on Feb. 23. On March 11, it reached the $3.70 resistance area but was promptly rejected.
However, it made a higher low and is now potentially making another breakout attempt.
Despite not showing considerable strength, technical indicators are bullish. The Stochastic oscillator has made a bullish cross, and the RSI & MACD are moving upwards.
If the token breaks out, the next resistance area is $5, the all-time high price.
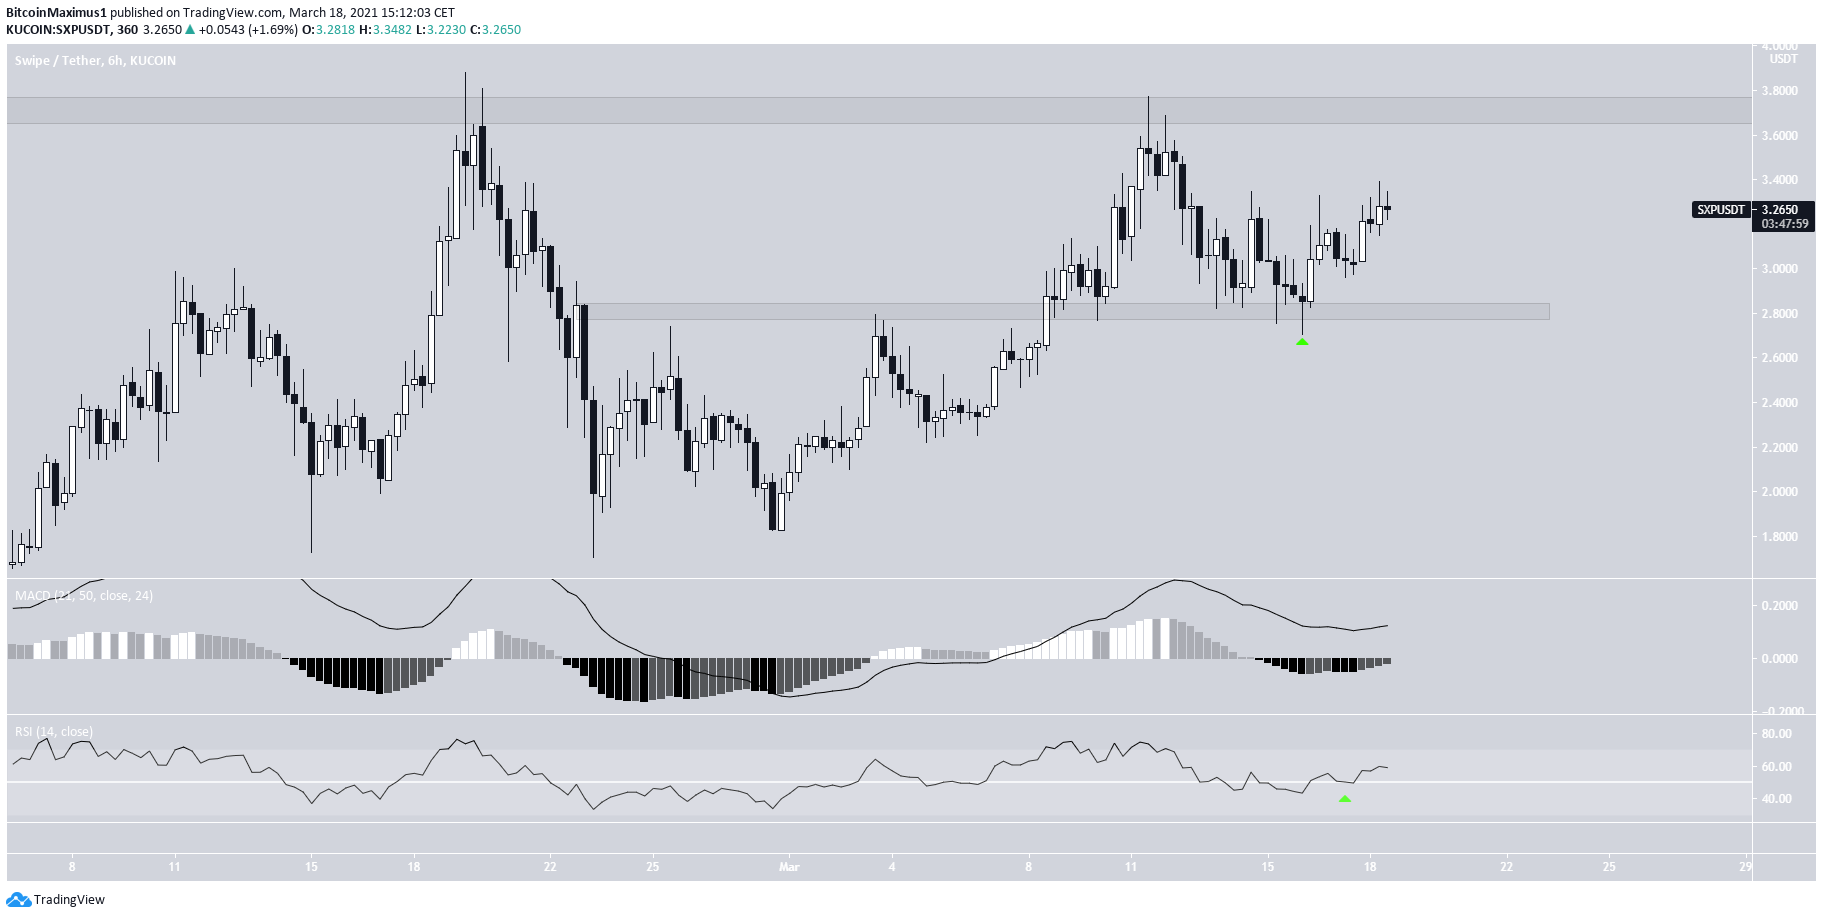
Short-Term Breakout
The shorter-term six-hour chart is also bullish.
Since being rejected from the aforementioned $3.70 area, it has returned to validate the $2.80 level as support on March 16.
Since then, it has been moving upwards.
The RSI has just crossed above 50, and the MACD is close to turning positive.
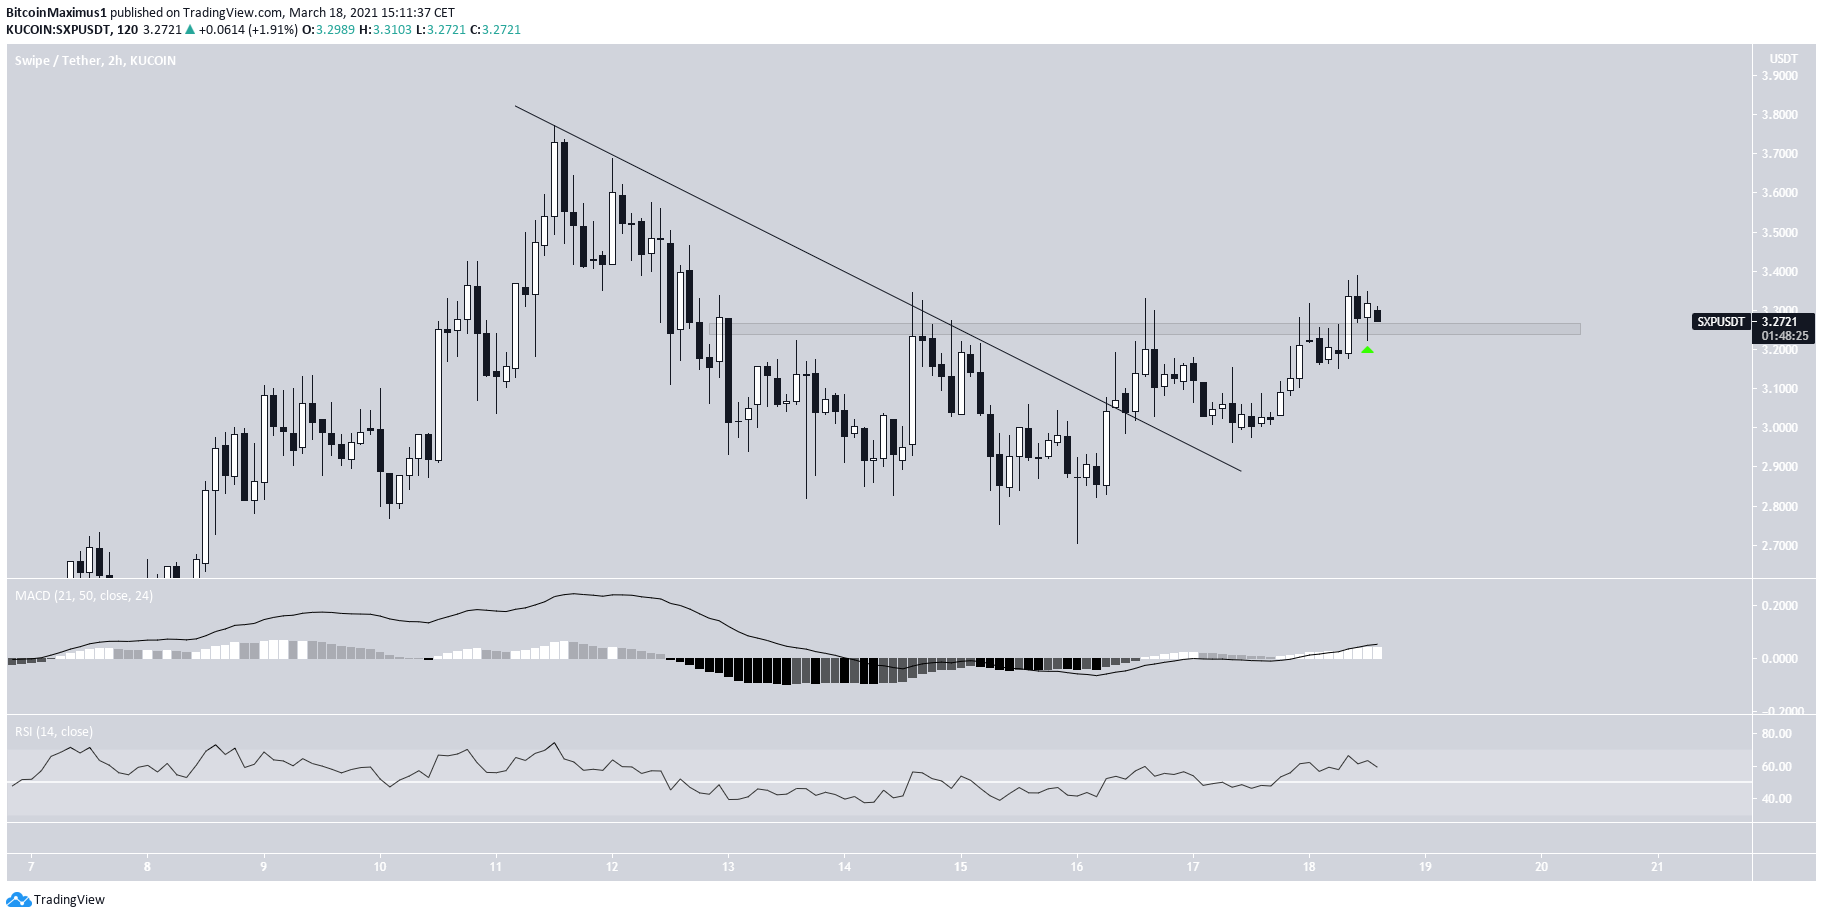
The even shorter-term two-hour chart supports this possibility.
After breaking out from a descending resistance line, the price has moved above the $3.20 area. It validated it as support afterward.
Similar to the daily and six-hour charts, the RSI & MACD are both bullish.
Therefore, the token is expected to reach the $3.70 resistance area and potentially break out.
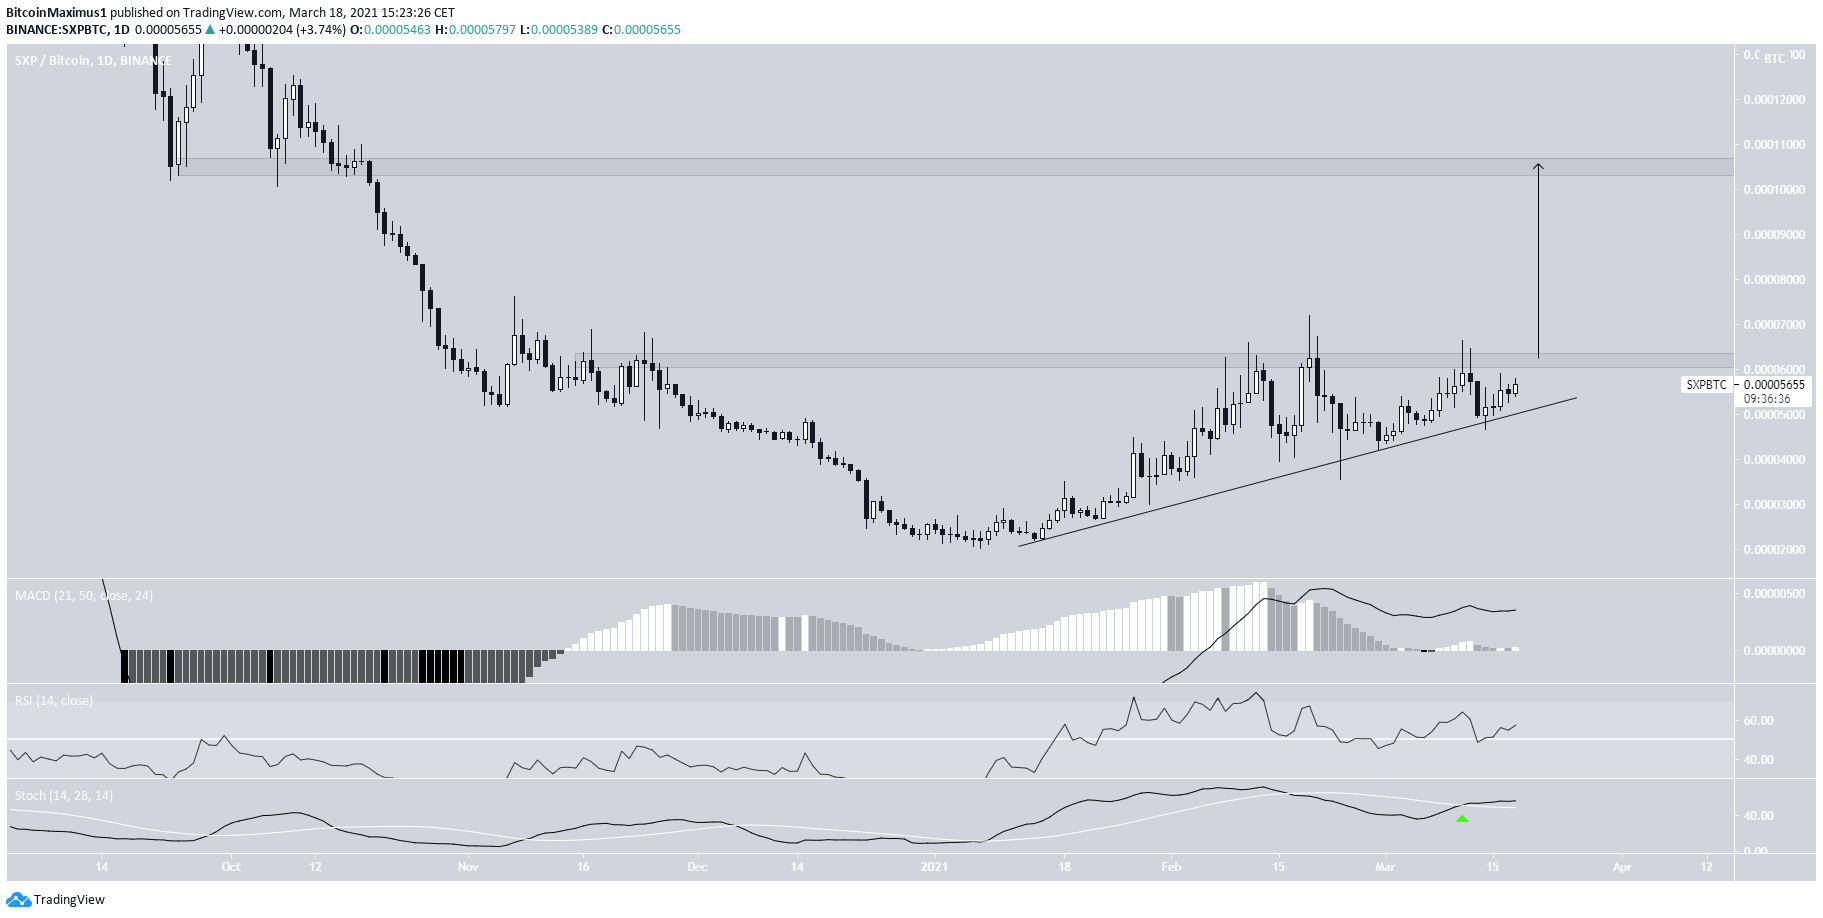
SXP/BTC
Cryptocurrency trader @Rektcapital outlined an SXP/BTC chart, stating that the price is likely to move towards 10,800 satoshis.
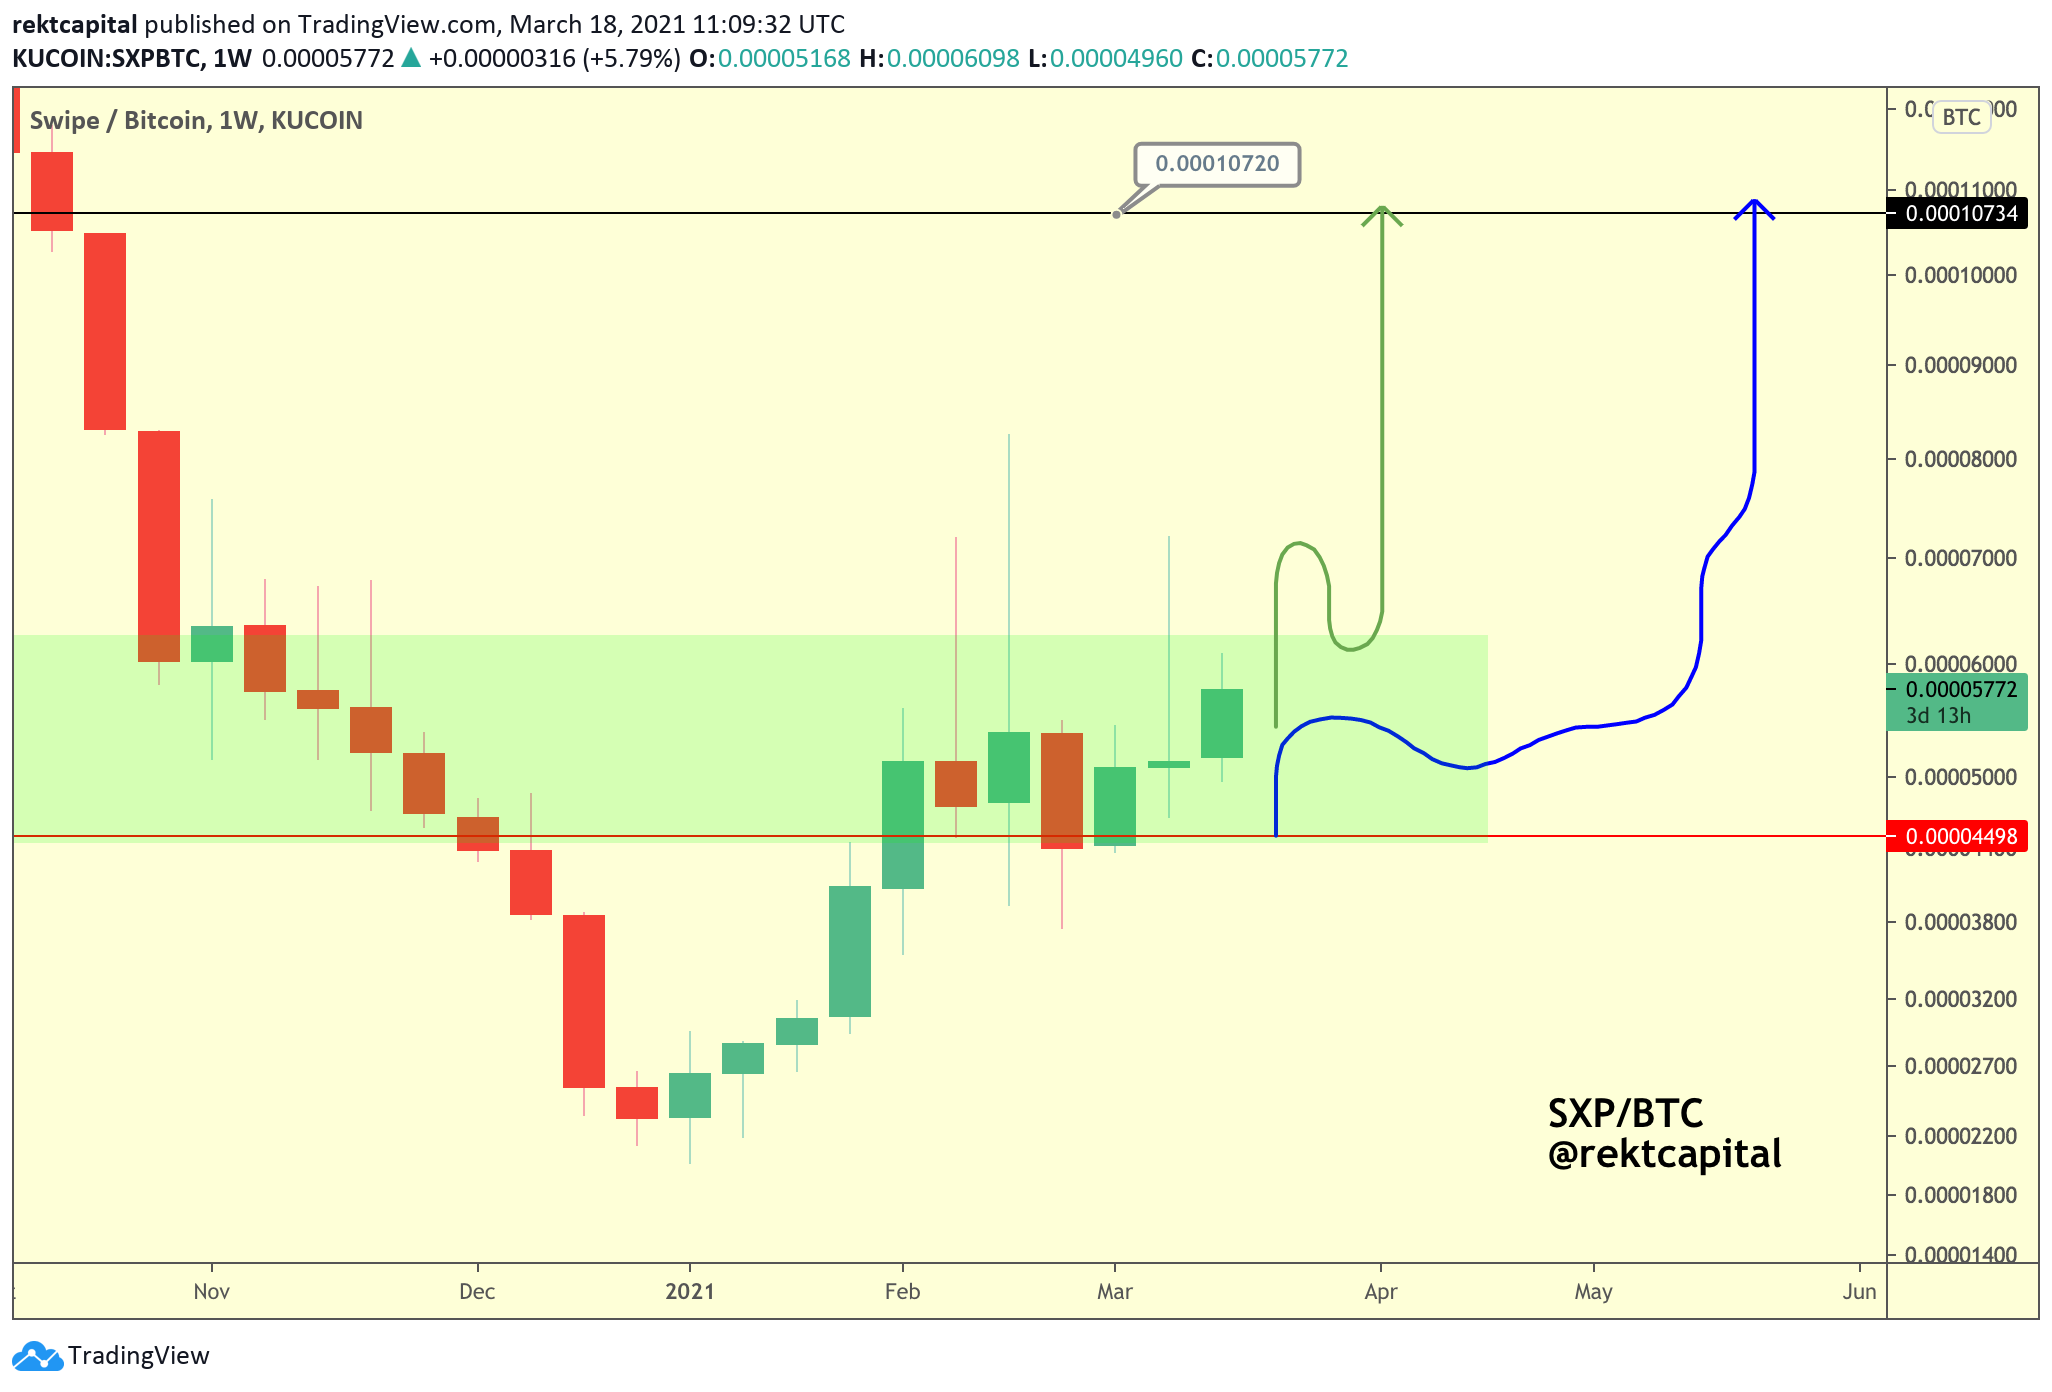
The daily chart shows that SXP/BTC is following an ascending support line. Also, it is trading just below the 6250 satoshi resistance area.
The support line and horizontal area create an ascending triangle, which is considered a bullish reversal pattern.
As stated in the tweet, the next resistance area is found near 10,800 satoshis. If the token breaks out and travels the entire height of the pattern, it would reach this area.
While the MACD & RSI are relatively neutral, the Stochastic oscillator supports this movement.