


The Swipe (SXP) price has failed to increase significantly despite breaking out from a descending resistance line.
The short-term Swipe chart doesn’t look bullish, and another drop is likely before it begins another upward move.
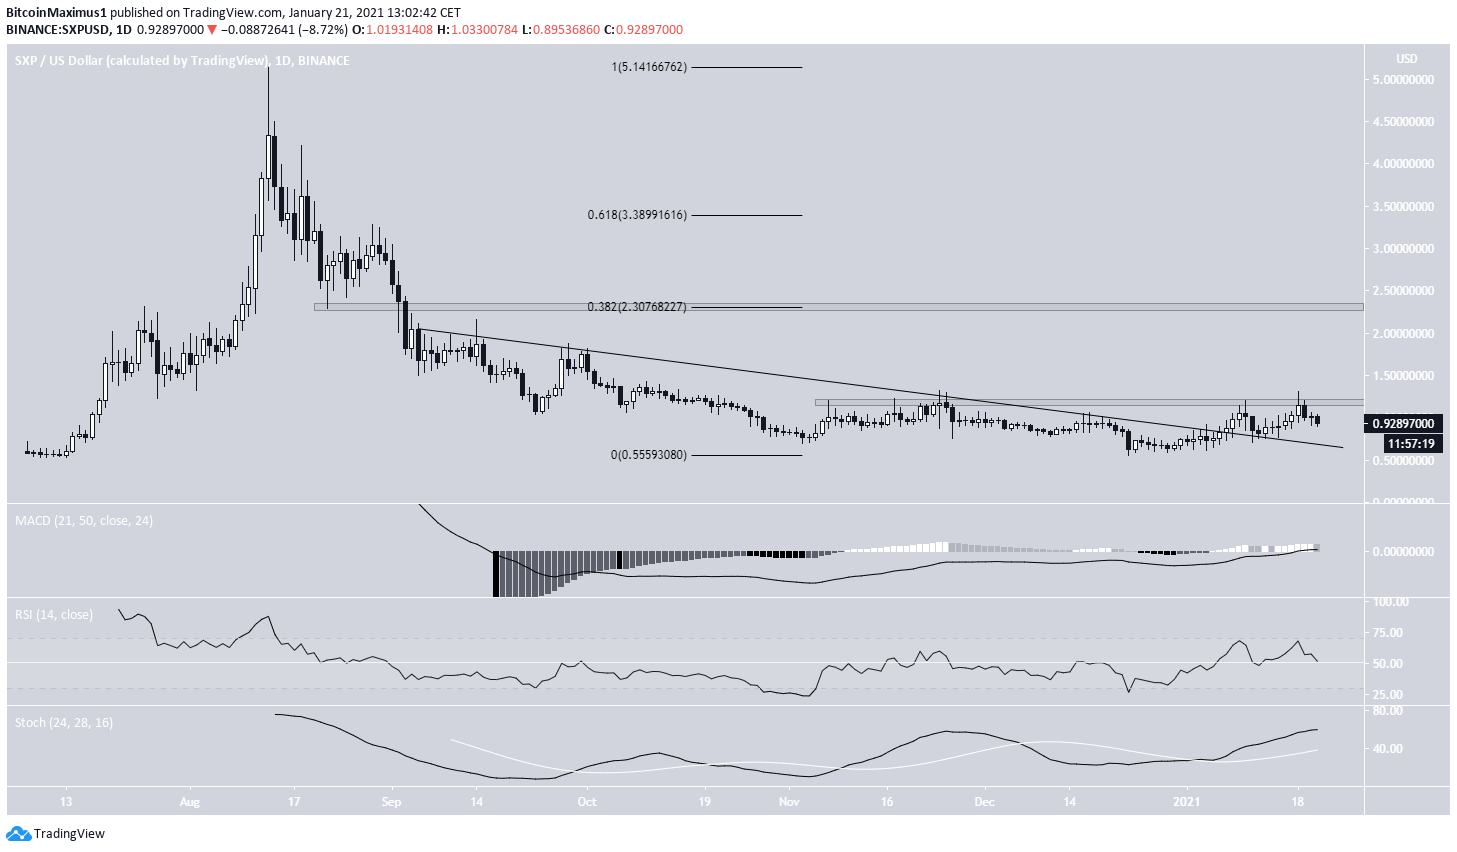
Swipe Breaks Over Resistance
SXP had been following a descending resistance line since Sept. 4, 2020. While under this resistance, SXP nearly reached a new all-time low price on Dec. 23 after dropping to $0.55.
On Jan. 6, 2020, SXP managed to break out from this line and proceeded to validate it as support a few days later.
However, the ensuing upward move only served to take SXP to the $1.20 resistance area, which caused another rejection.
Technical indicators are neutral, failing to indicate whether SXP will make another attempt at breaking out. If it does, the next resistance area would be found at $2.30.
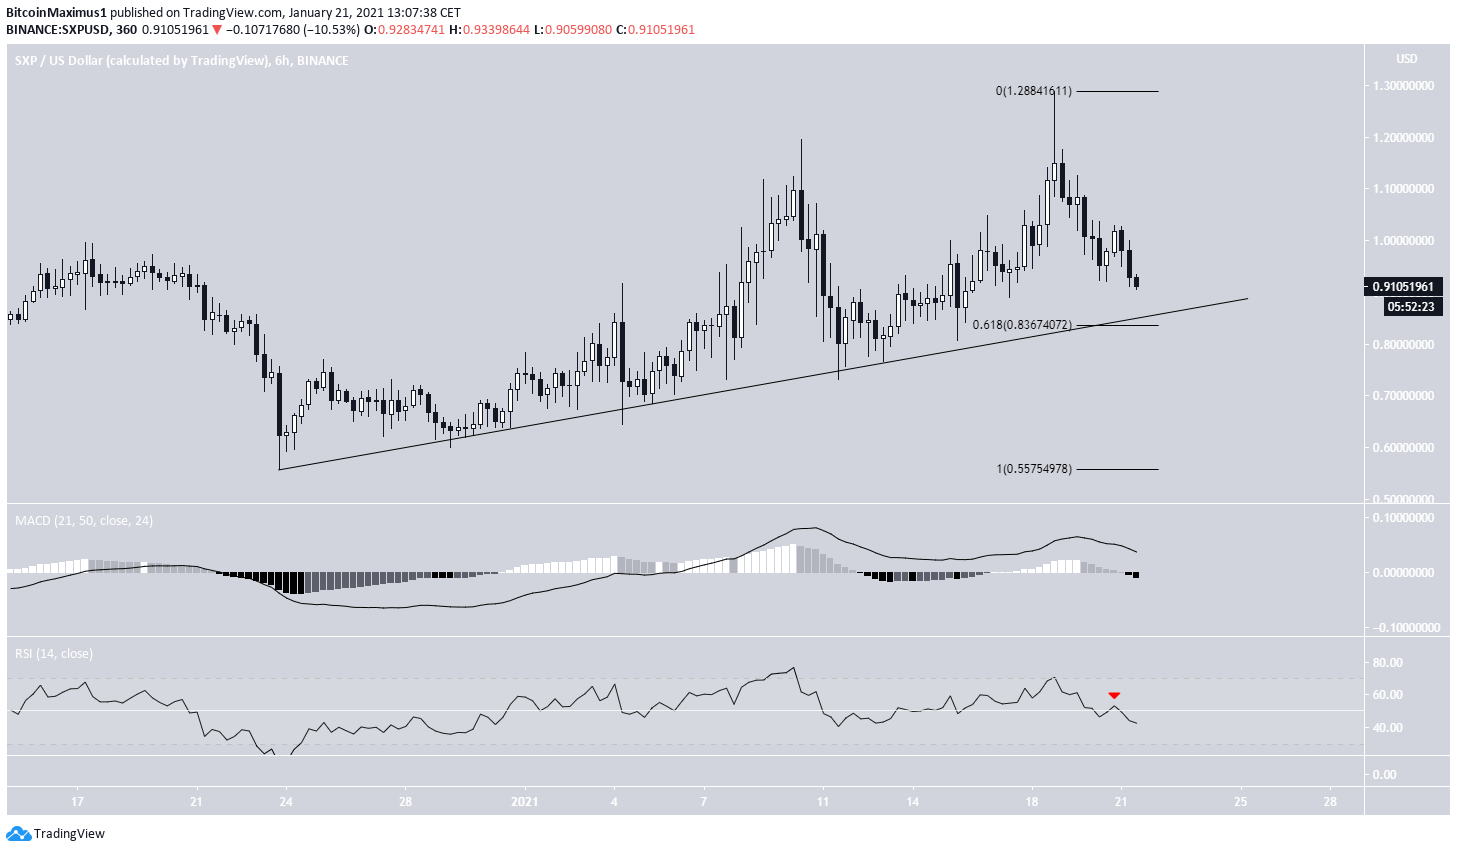
Short-Term Movement
The six-hour chart shows that SXP has been following an ascending support line since Dec. 24.
Currently, SXP is in the process of dropping to the line, which coincides with the 0.618 Fib retracement level at $0.83.
The movement over this ascending support line does not look impulsive at all, and technical indicators are firmly bearish. Therefore, a touch of the support line seems very likely and a breakdown remains a possibility.
If one were to occur, SXP would likely re-test the all-time low area near $0.55.
SXP/BTC
Cryptocurrency trader @Pakicrypto outlined an SXP/BTC chart which shows a possible upward movement toward 6,000 satoshis.
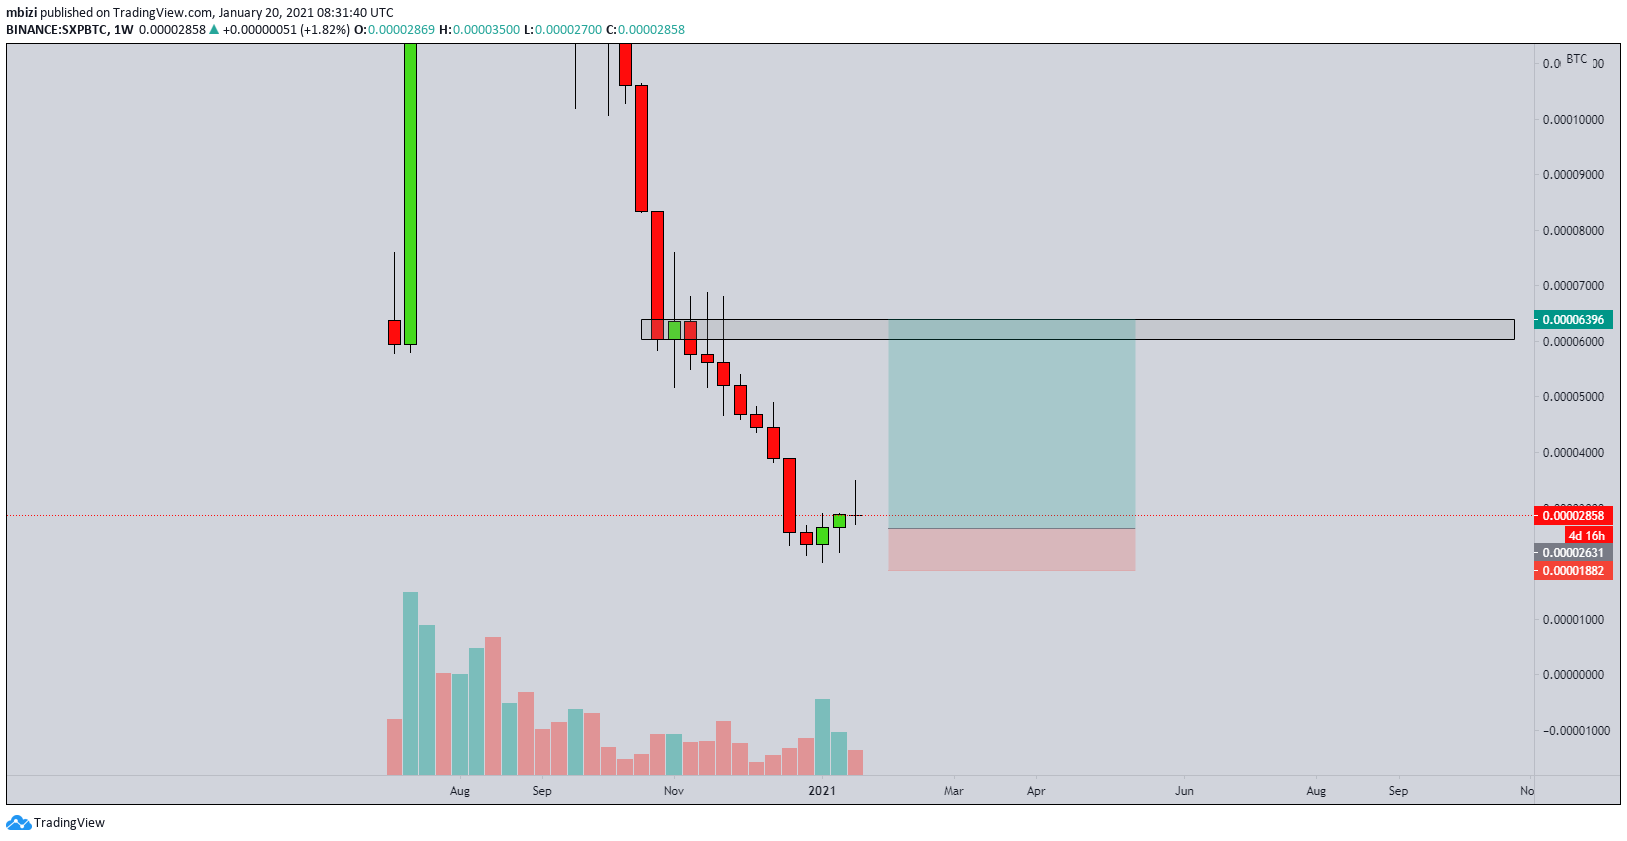
Interestingly, the SXP/BTC chart looks more bullish than the SXP/USD pair.
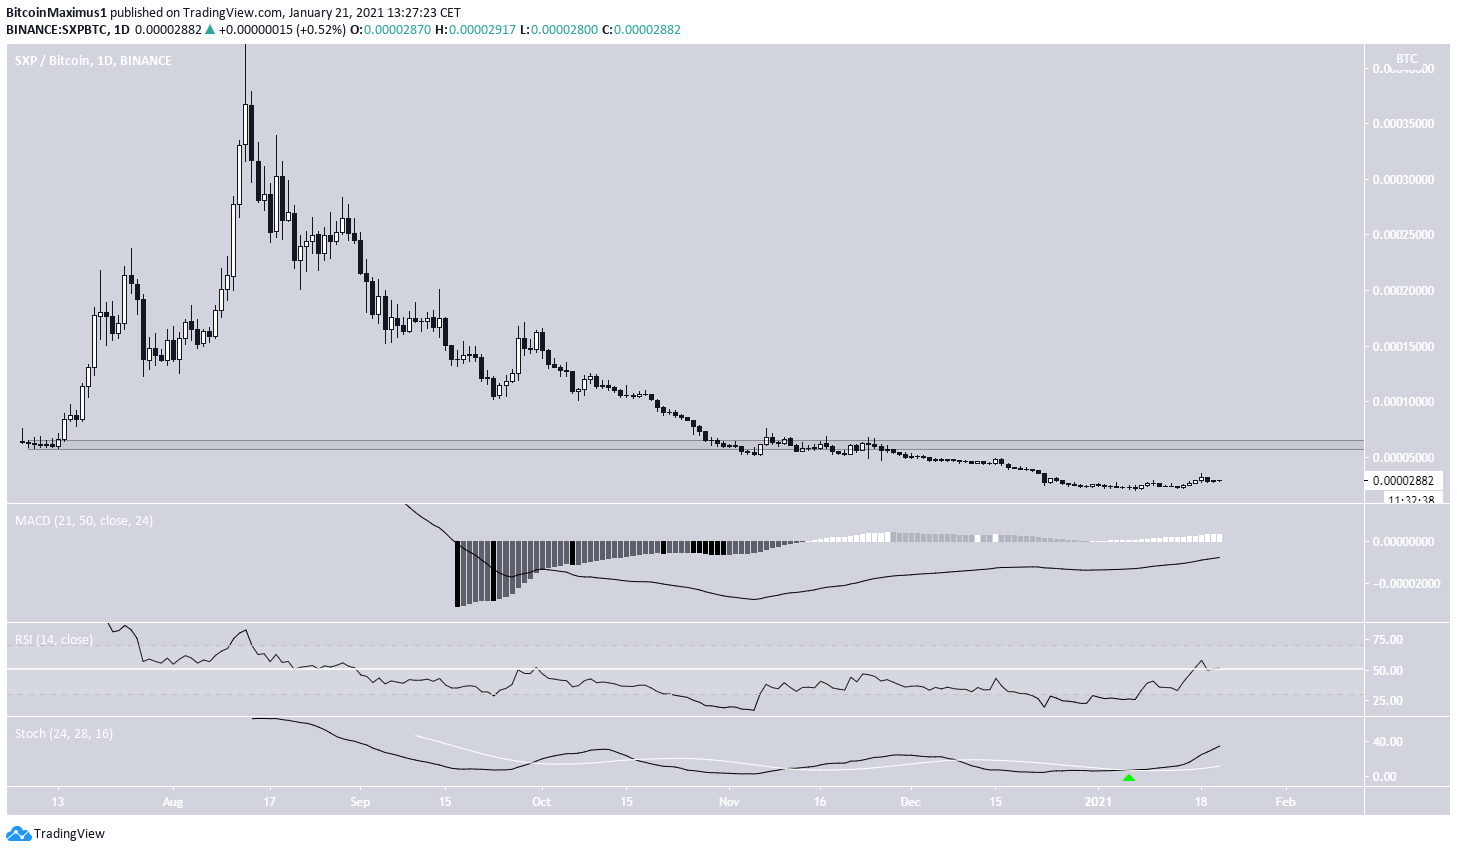
While it’s trading firmly below the breakdown level of 6,000 satoshis, technical indicators are all bullish. This is evidenced by the RSI movement above 50 and a bullish cross in the Stochastic oscillator.
Therefore, while an increase toward 6,000 satoshis seems likely, the longer-term trend cannot be considered bullish until SXP reclaims it.
Conclusion
The Swipe trend cannot be considered bullish until the $1.10 area is reclaimed. The current movement does not look impulsive, and a drop to the support line is expected.
At least in the short-term, the SXP/BTC chart looks more bullish than its USD counterpart.
For BeInCrypto’s latest Bitcoin (BTC) analysis, click here!


