SushiSwap (SUSHI) has initiated a short-term bounce towards $8.30 – $8.90, but the longer-term trend seems to still be bearish.
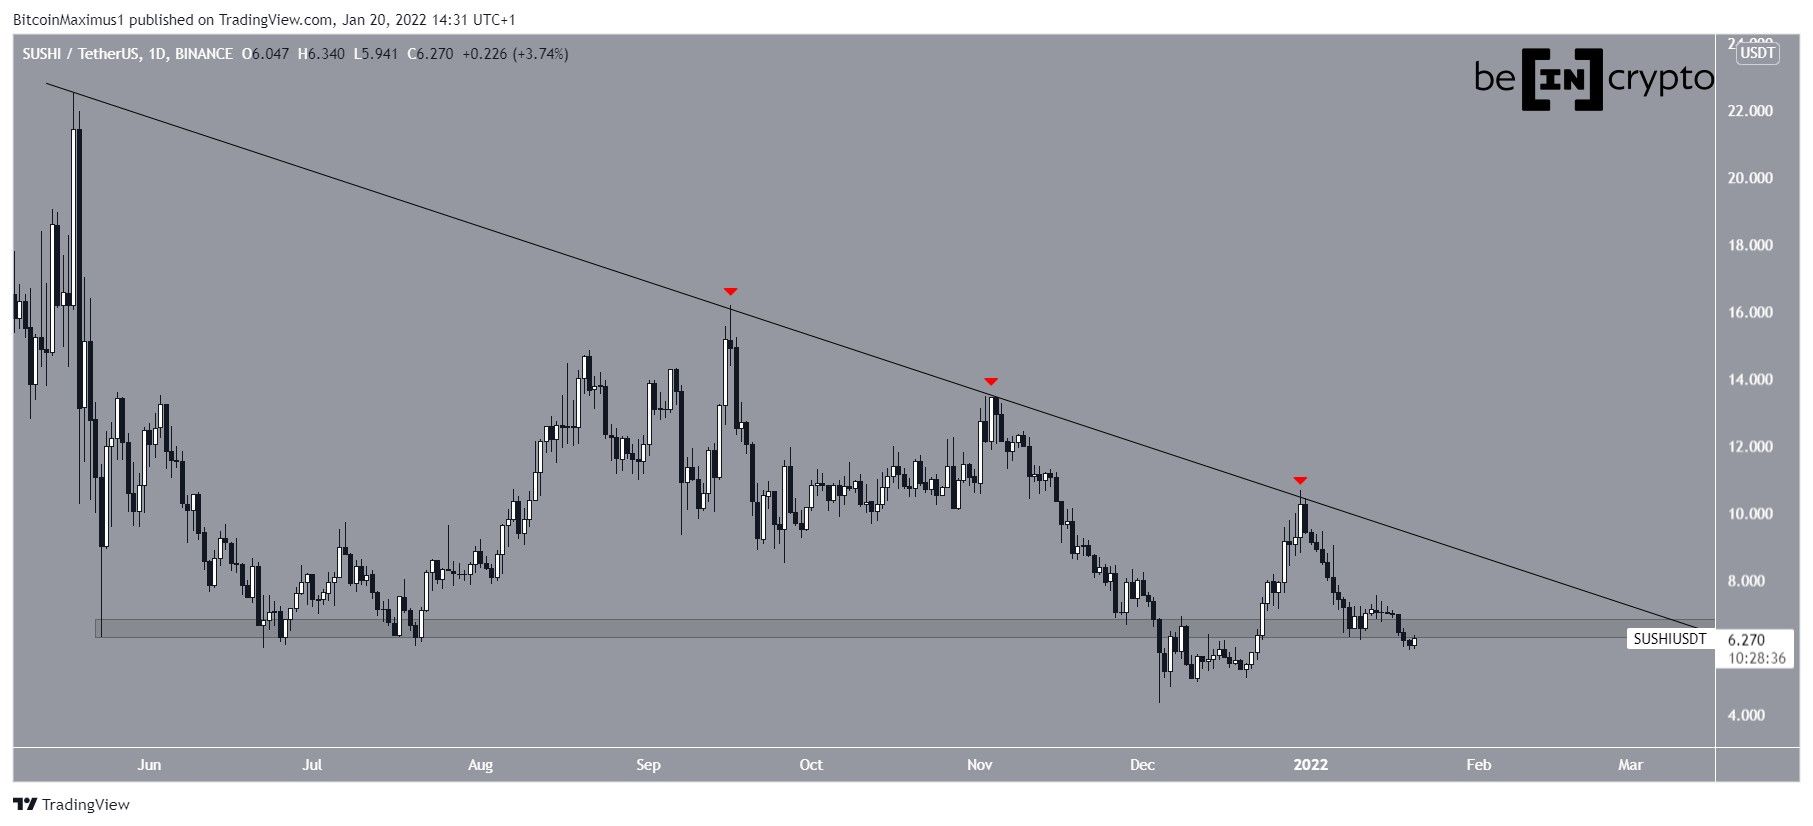
SUSHI has been decreasing alongside a descending resistance line since reaching an all-time high price of $22.53 on May 18. The line has rejected the price four times, most recently on Dec 30.
An interesting movement transpired in the beginning of Dec, when SUSHI fell below the $6.35 horizontal area (red circle). While this initially seemed like a breakdown, the token reclaimed the area shortly afterwards.
Currently, it is in the process of validating the area as support once more. Whether it manages to hold on above it or breaks down will likely determine the direction of the future trend.
Short-term SUSHI movement
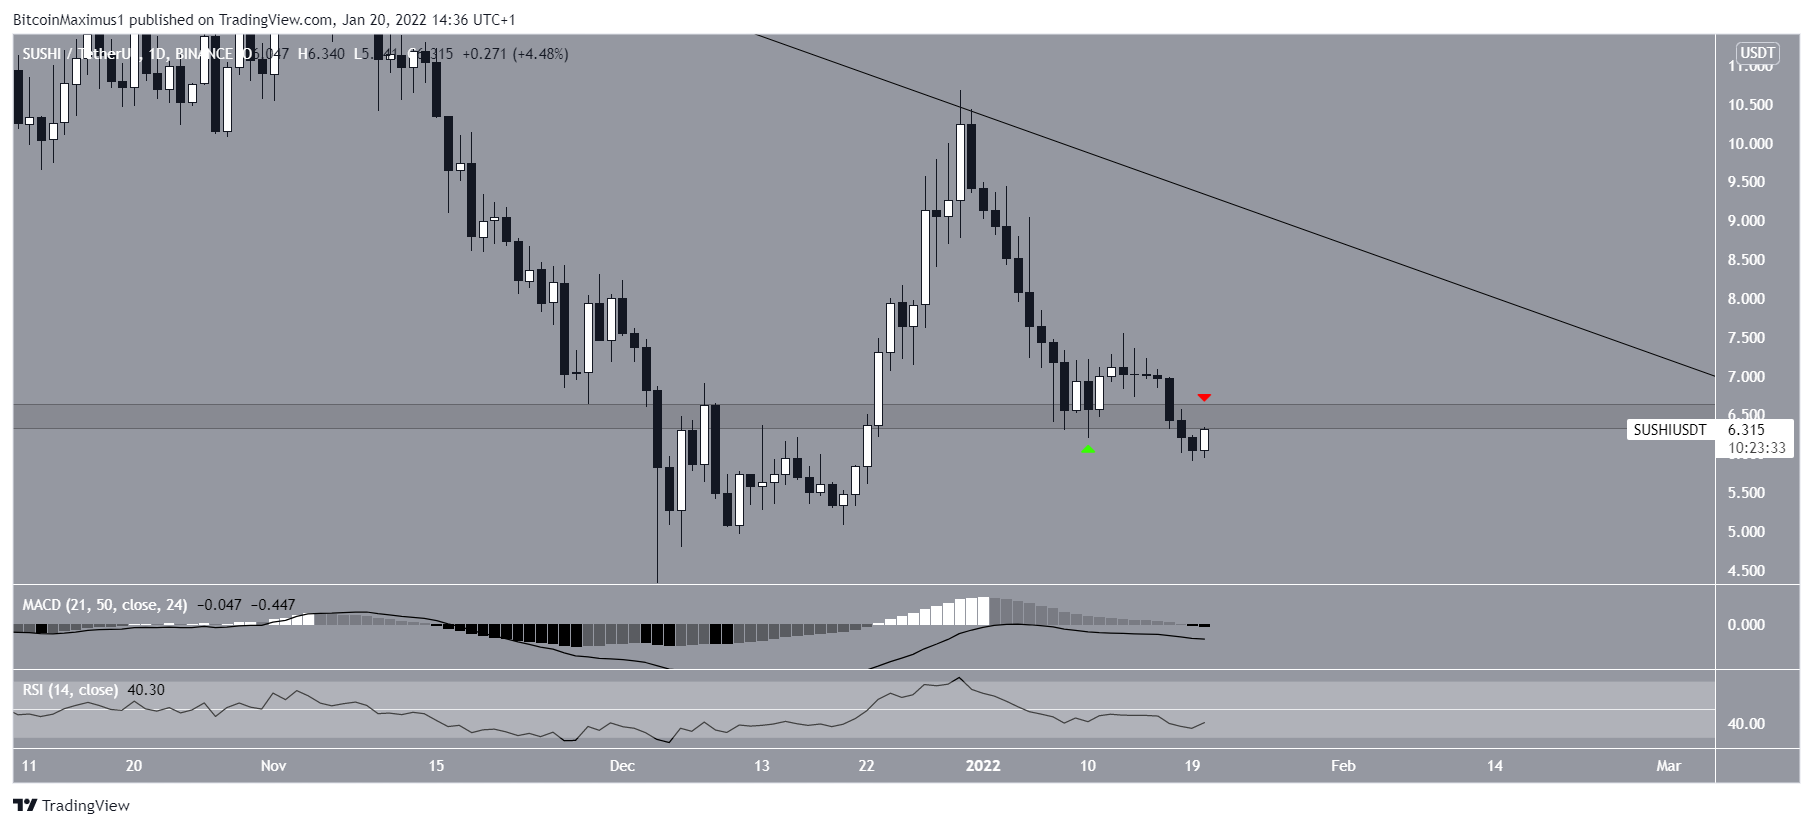
A closer look at the daily time-frame suggests that SUSHI will not reclaim the $6.50 area, rather will continue decreasing towards new lows.
The first sign of this possibility is given by the fact that the token has reached a close well below this area, and now seems to be validating it as resistance.
The second one is given by technical indicator readings, since both the MACD and RSI are bearish. The former is negative while the latter is below 50. Both of these are indicative of a bearish trend.
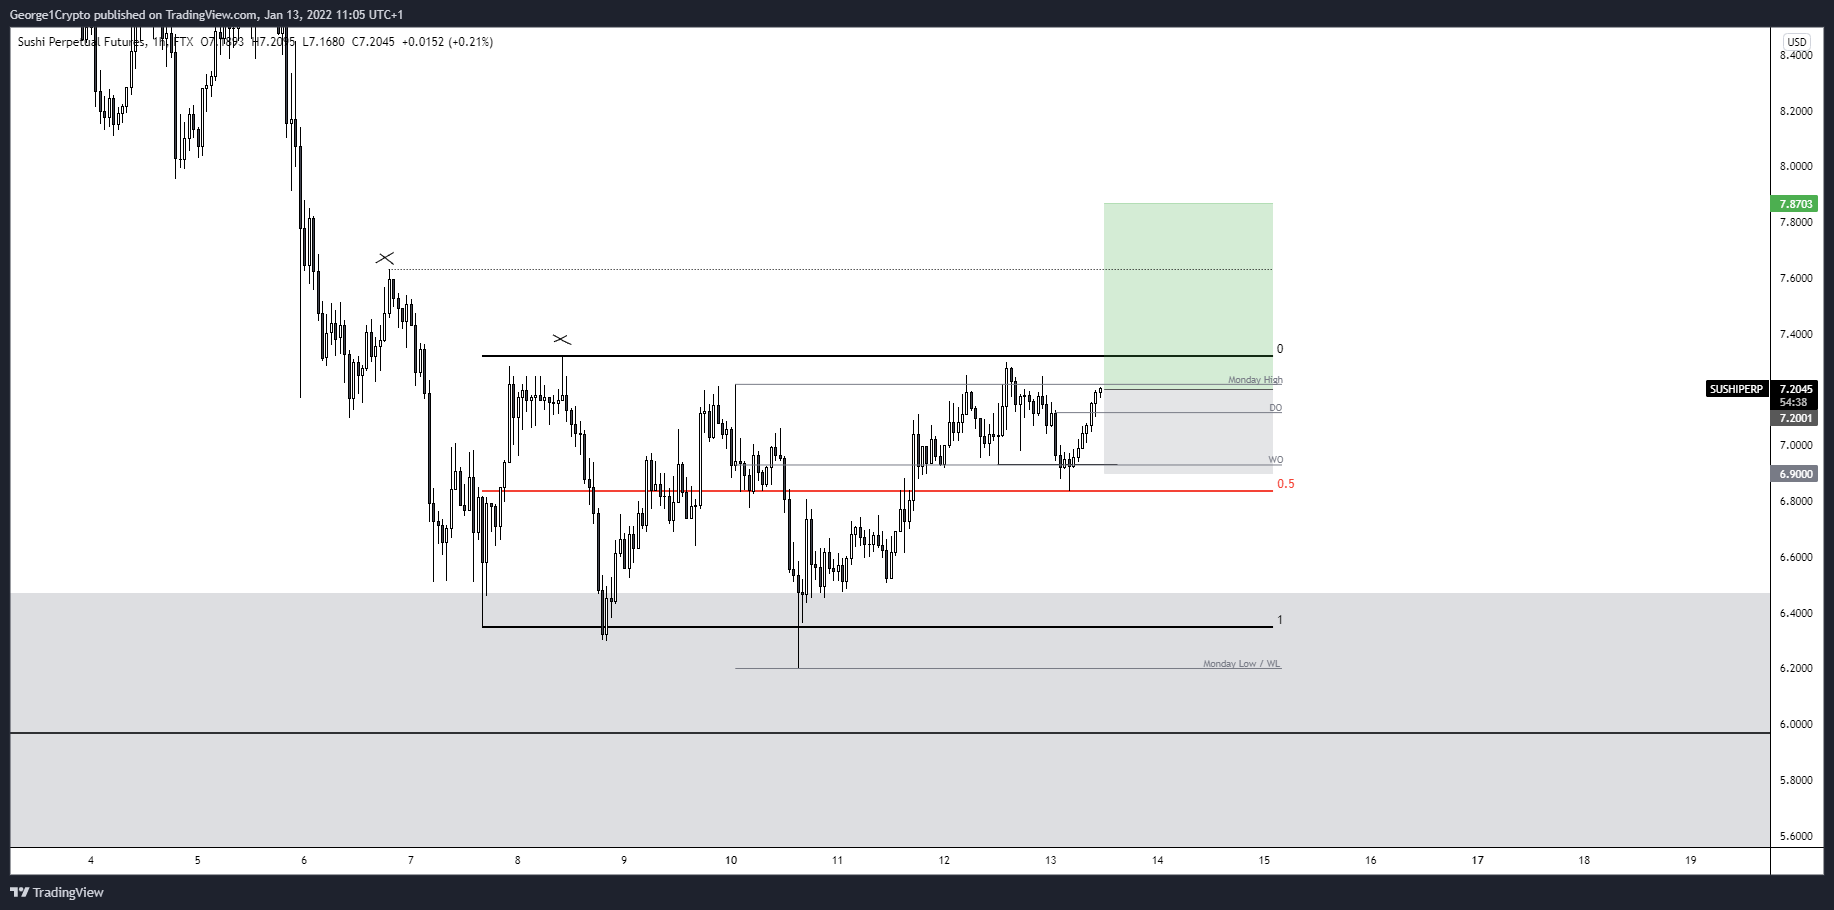
Cryptocurrency trader @George1Trader tweeted a SUSHI chart, stating that the token could increase towards $8.
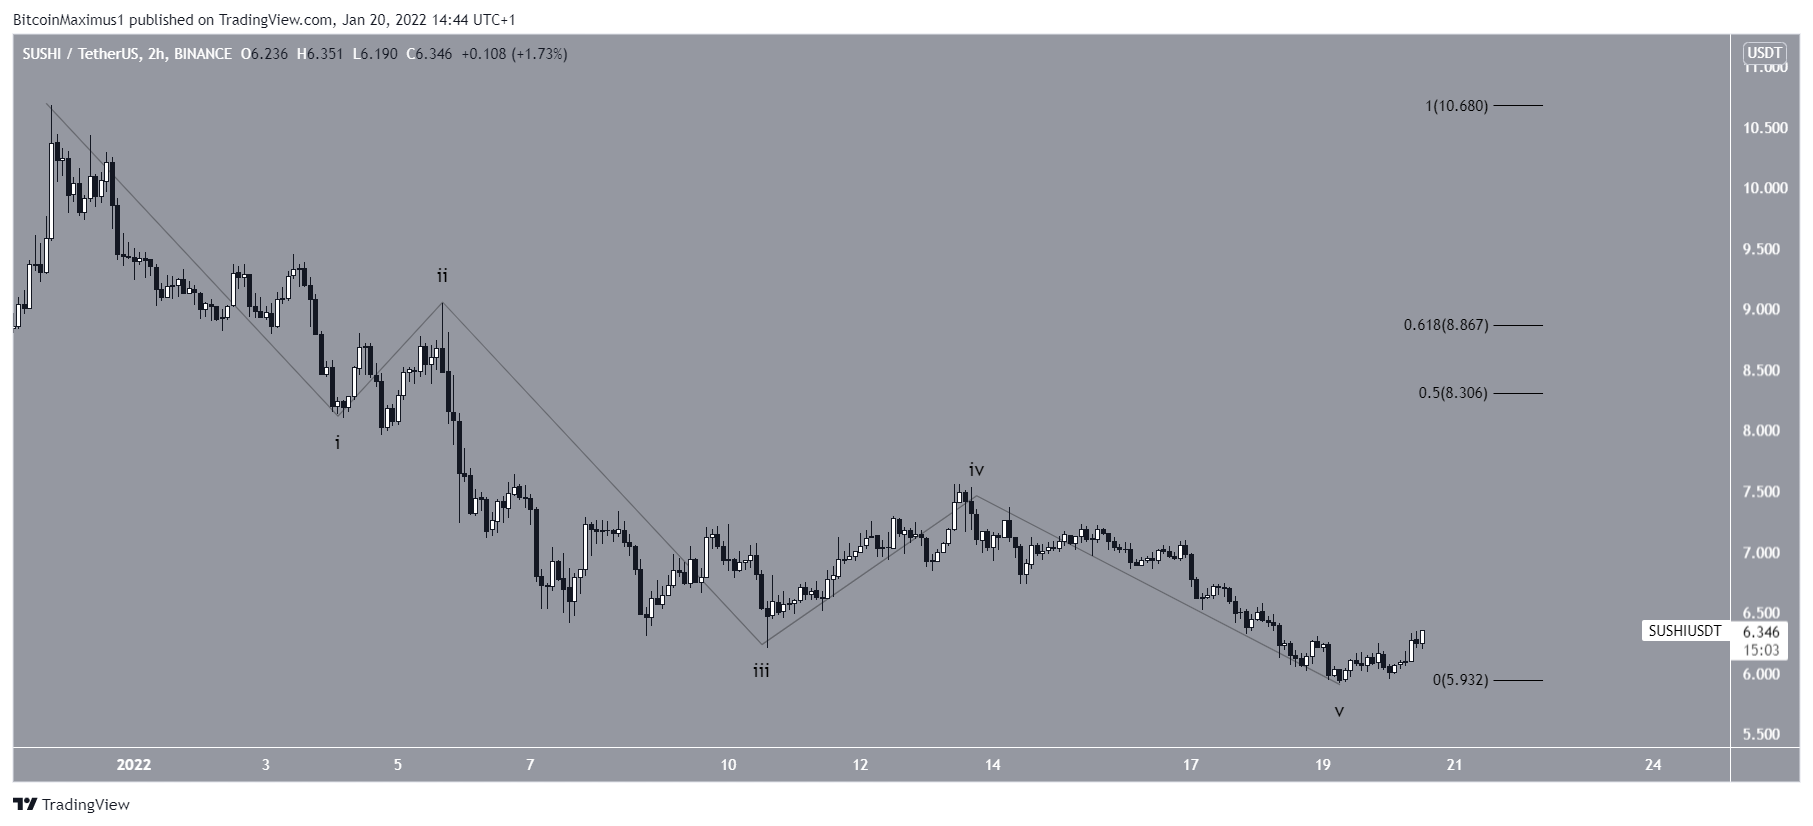
While the token has decreased since the tweet, it seems to have completed a five wave downward movement measuring from its Dec 10 high. What follows after such decreases is usually a bounce.
If one occurs, the closest resistance would be between $8.30 – $8.86. This is both a Fib and horizontal resistance area.
However, the fact that there is a five wave downward movement also suggests that the trend is bearish. This also aligns with the readings from technical indicators and the breakdown from the $6.50 area.
Therefore, after the bounce is complete, another downward movement would be likely.