


Stellar (XLM) has validated long-term support at $0.077. As long as the price is trading above this level, the trend is considered bullish.
Technical indicators further support a price increase.
XLM Validates Long-Term Support
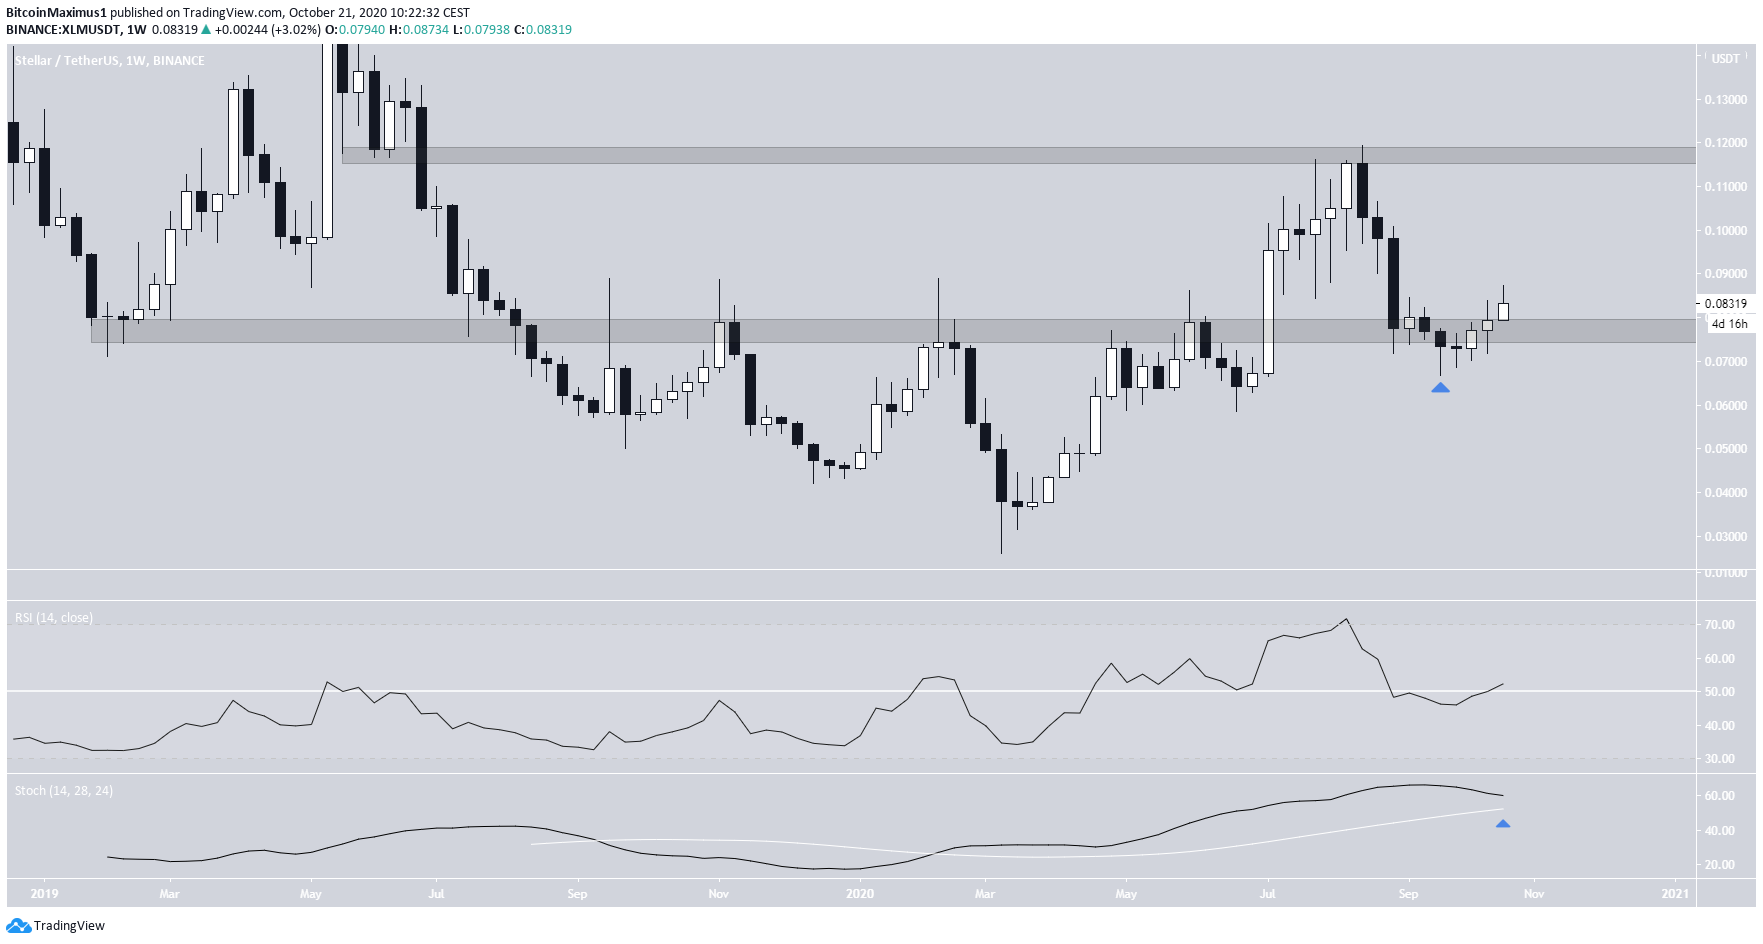
The weekly chart for XLM shows that the price is trading above the $0.077 area after having validated it as support over the past three weeks. The area is extremely important since it initially acted as support at the beginning of 2019 before turning to resistance in September of the same year.
The area continued acting as resistance until XLM finally broke out in July 2020. The price reached a high of $0.119 before returning to validate the $0.077 area as support. As long as the price is trading above this level, the trend is considered bullish.
The RSI is in the process of moving above 50 and the Stochastic Oscillator is moving upwards. If the price does not fall below the $0.077 area, both indicators should work to confirm the bullish trend and likely initiate an upward move towards the closest resistance at $0.117.
Trend Appears Bullish
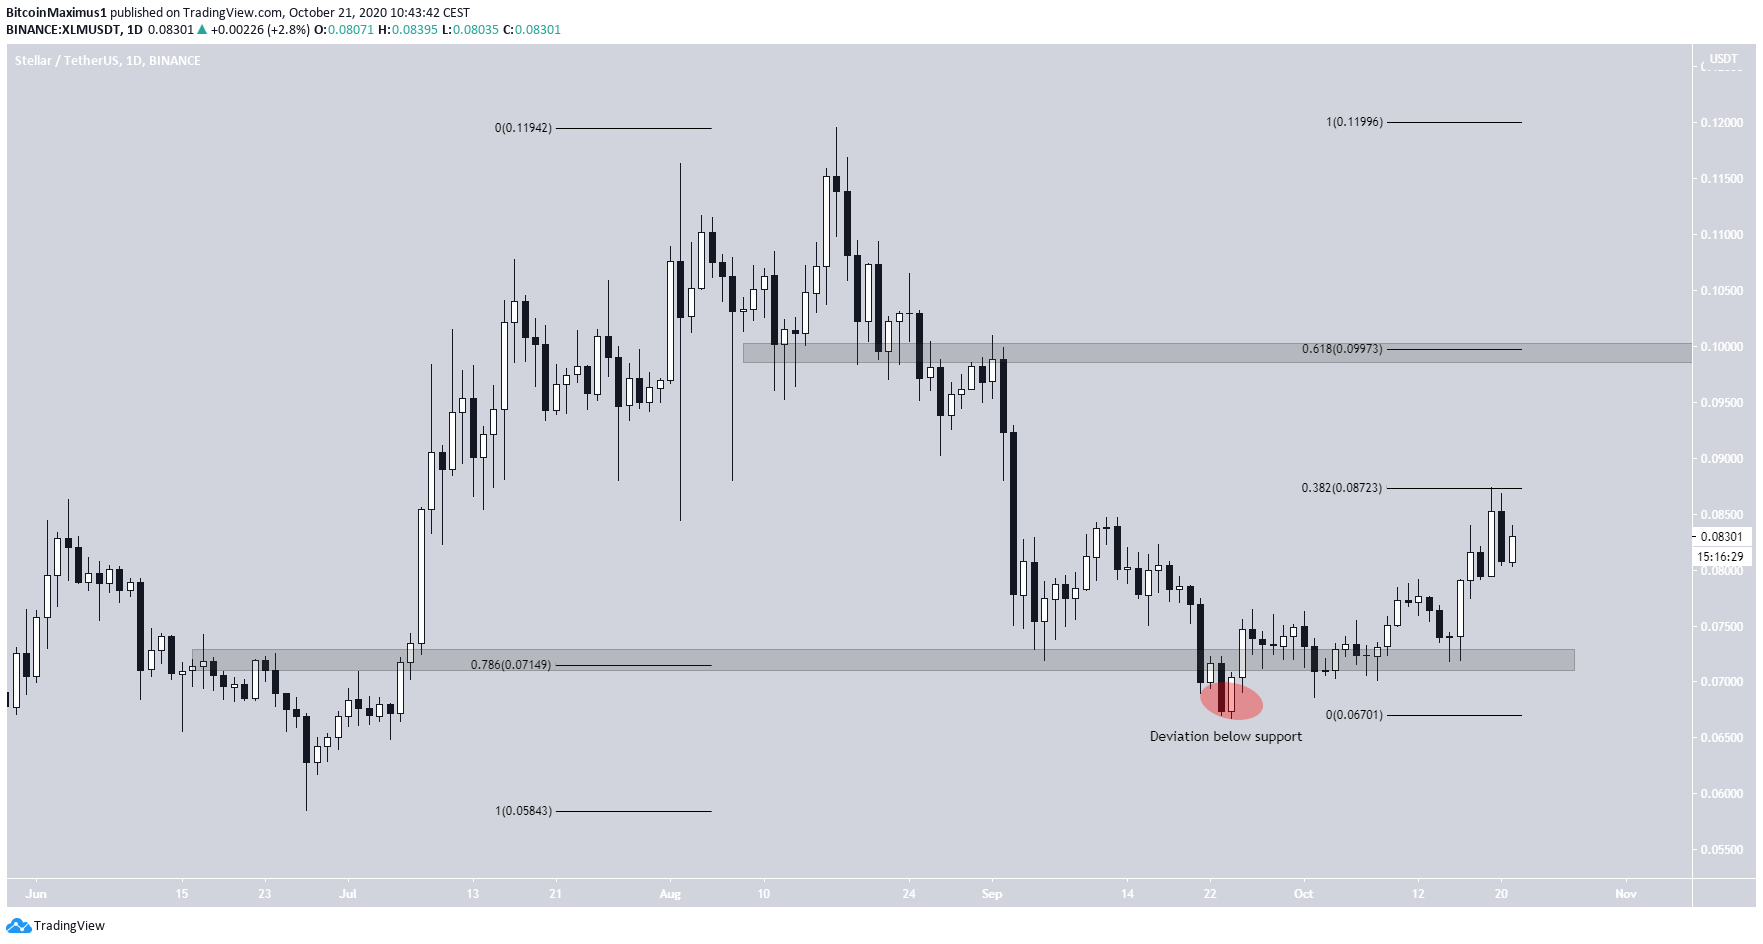
The daily chart shows the importance of the $0.071 area. The price deviated below it on Sept 23 but proceeded to reclaim it shortly afterward and has been increasing since. The $0.071 area is the 0.786 Fib level of the entire upward movement.
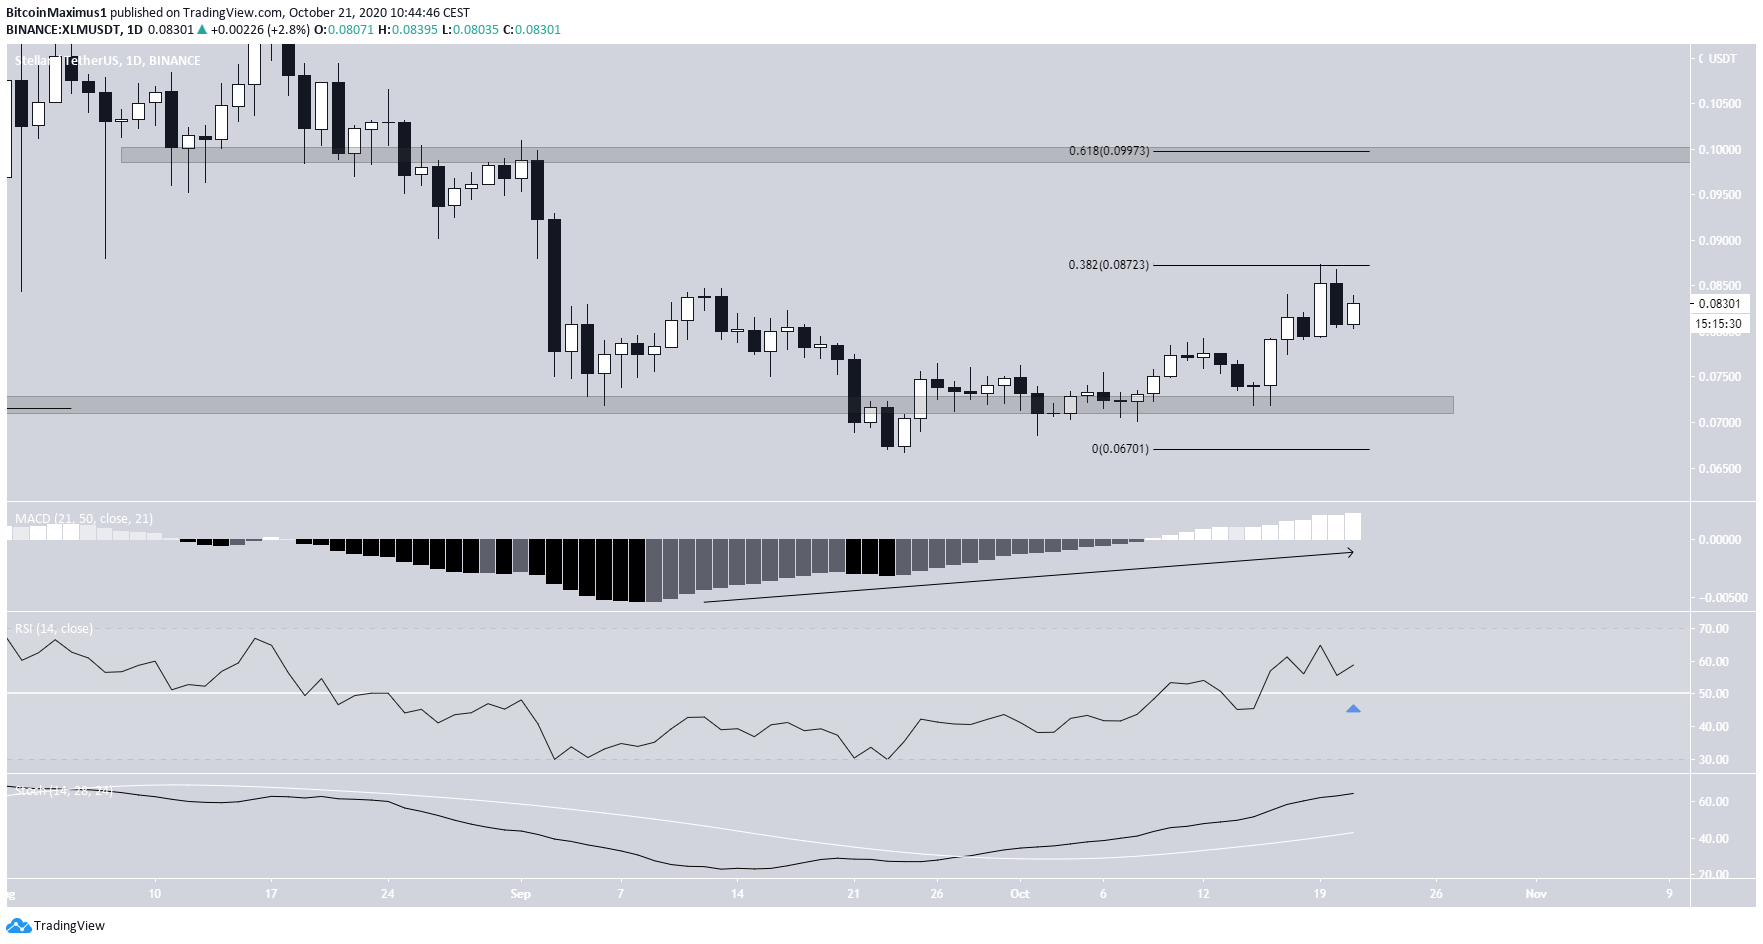
However, XLM has yet to clear several important levels that would suggest the current movement is an upward move rather than a retracement. It was rejected from the 0.382 Fib level at $0.087. Even if it were to break out, XLM would likely meet strong resistance at the 0.618 level of $0.099.
Despite this, technical indicators are bullish. The MACD, RSI, and stochastic oscillator are all increasing. The trend is therefore considered bullish and XLM is expected to move upwards towards resistance levels.
Short-Term Movement
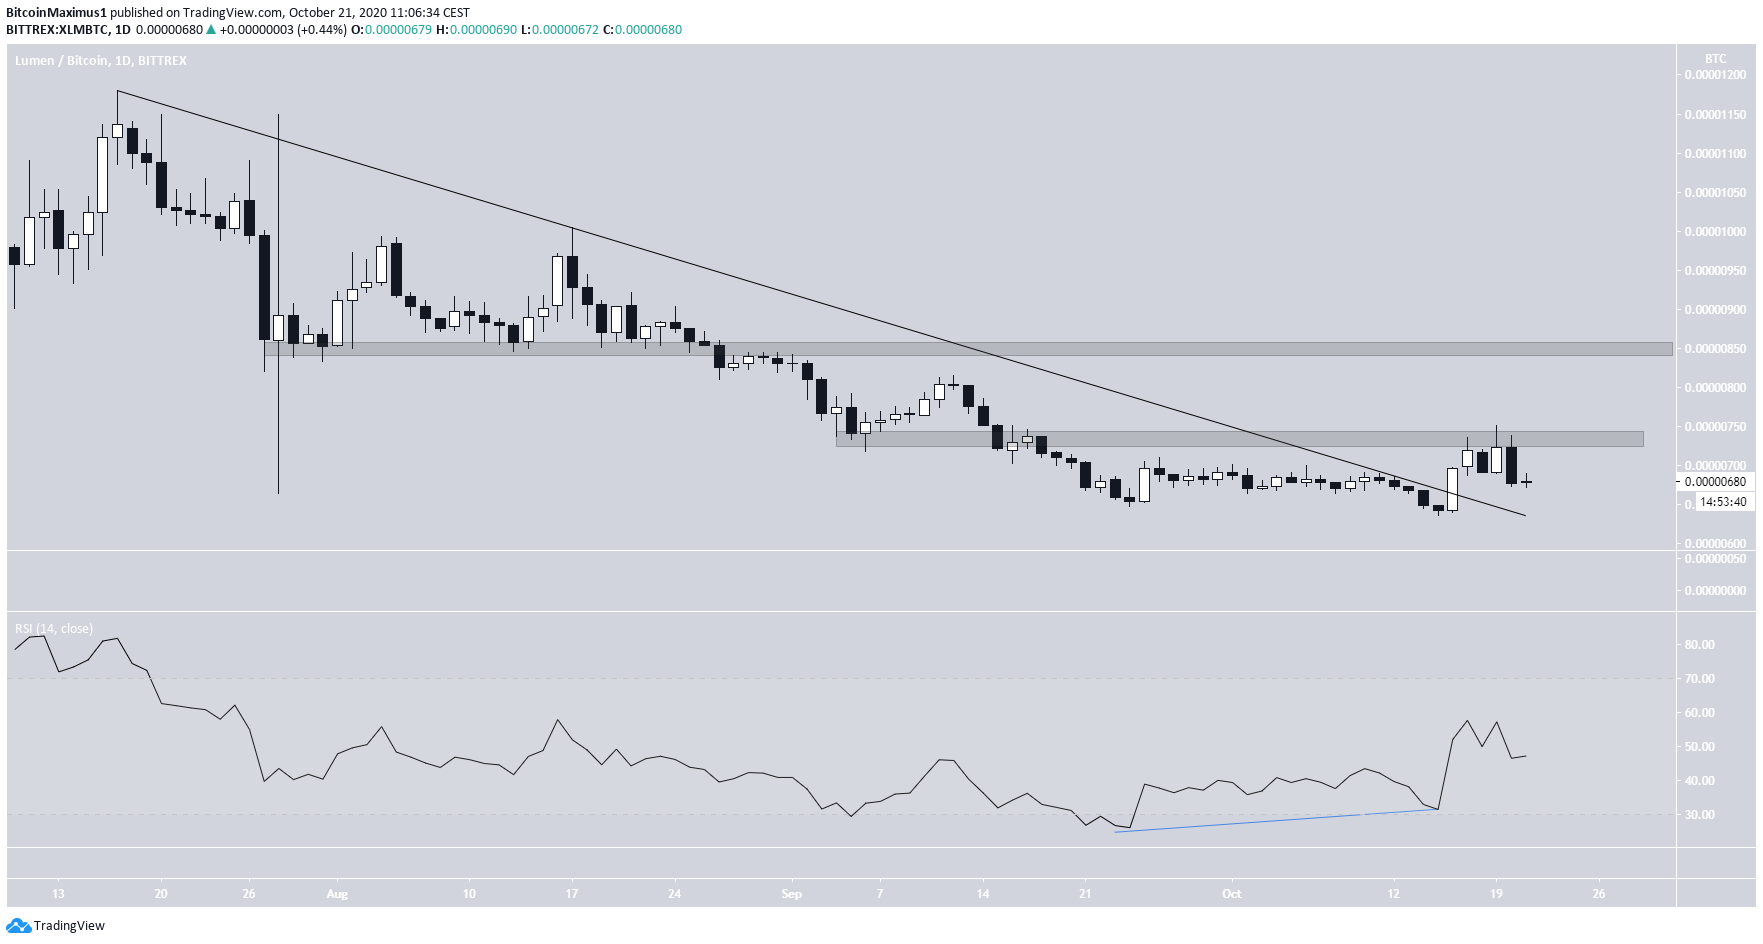
XLM/BTC
Cryptocurrency trader @CryptoNTez outlined an XLM/BTC chart, stating that the price has broken out from a descending resistance line and reached an important resistance level at 760 satoshis.
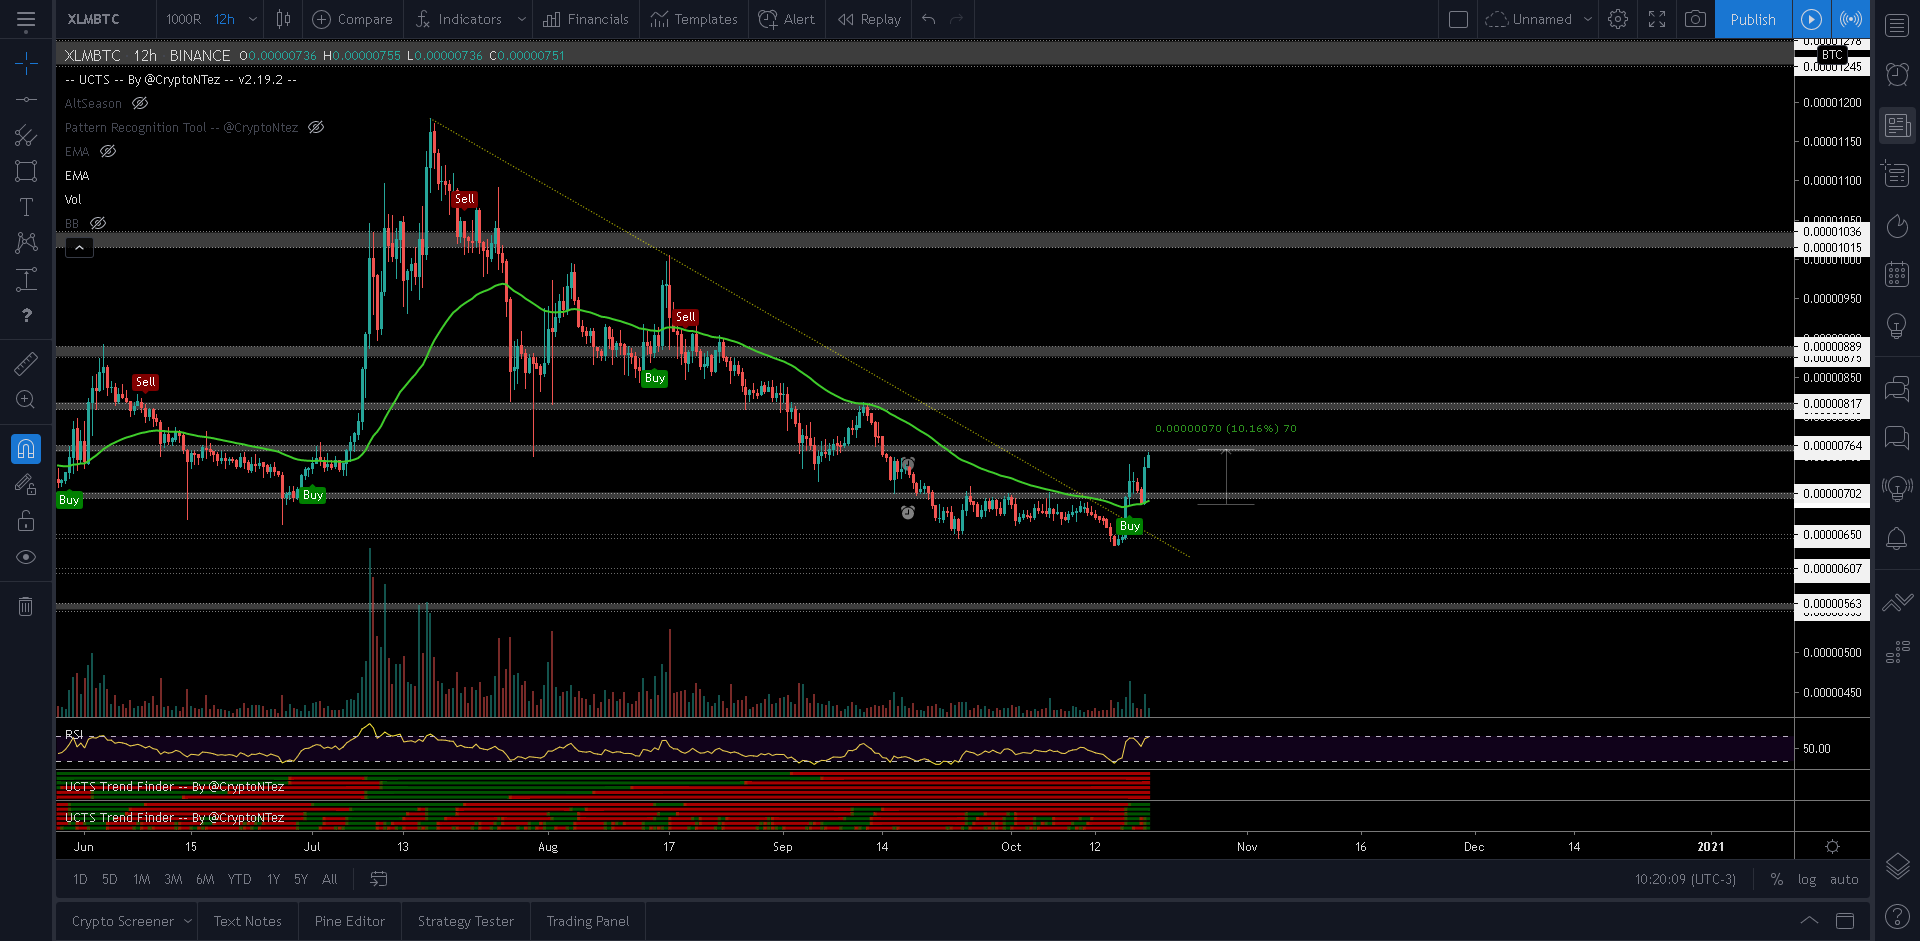
XLM/BTC had been following a descending resistance line since Jul 17, when it reached a high of 1,180 satoshis.
The price created a double-bottom throughout Sept 24 – Oct 16 and broke out from the resistance line the next day. The pattern was combined with a considerable bullish divergence in the RSI, which has moved outside of the oversold region since.
Even though the price was rejected by the 760 satoshi area after the breakout, the length of the double-bottom and descending resistance line make it likely that the breakout will continue for a longer period of time.
If XLM can break out from the 760 satoshi area, the next resistance area to the upside would likely be found at 860 satoshis.
For BeInCrypto’s previous Bitcoin analysis, click here!
Disclaimer: Cryptocurrency trading carries a high level of risk and may not be suitable for all investors. The views expressed in this article do not reflect those of BeInCrypto.


