


On July 18, 2019, the Stellar price reached a high of 957 satoshis. A period of consolidation ensued. However, on July 31, XLM began a downward move. It has been decreasing since.
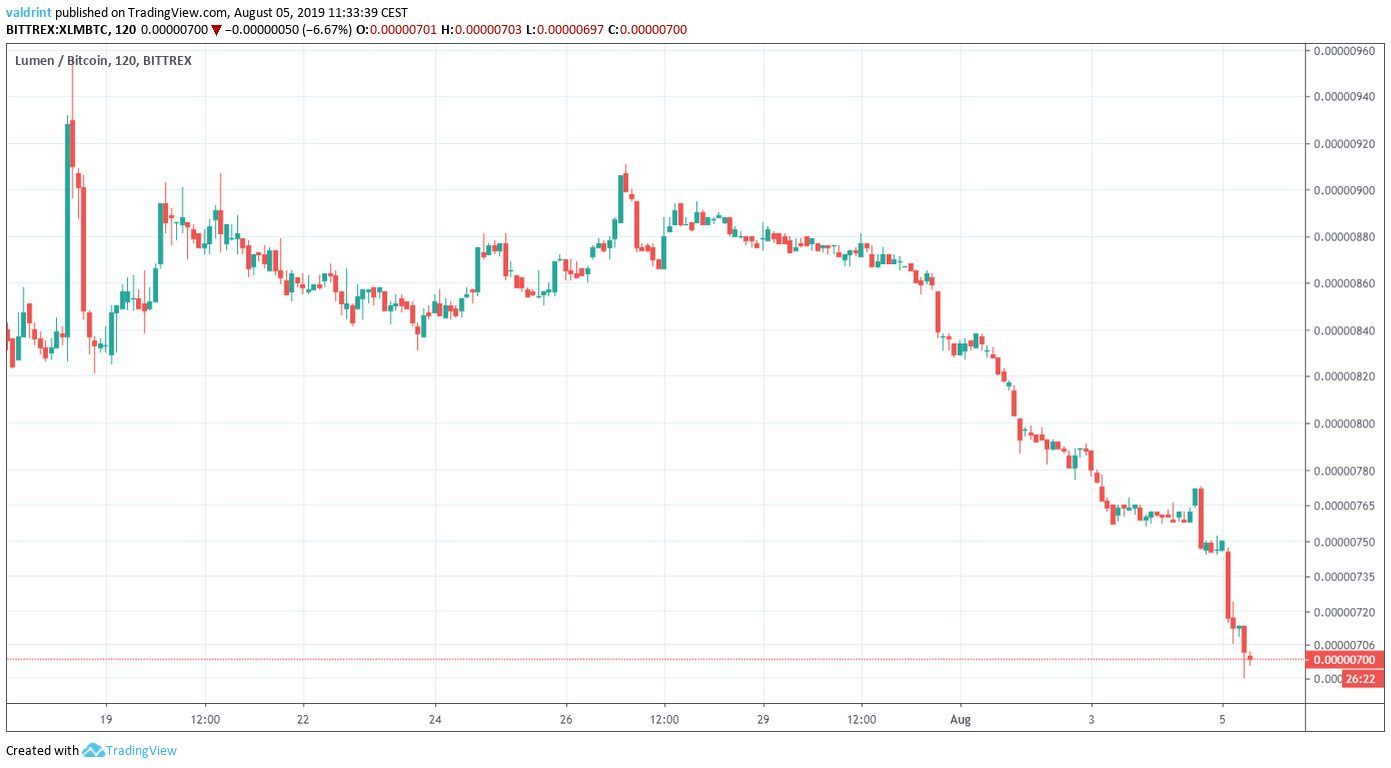
At the time of writing, XLM was trading near 700 satoshis.
For our previous analysis, click here.

XLM Price: Trends and Highlights for August 5
- XLM/BTC broke down from an ascending triangle.
- It is trading inside a descending wedge.
- There is bullish divergence developing in the RSI.
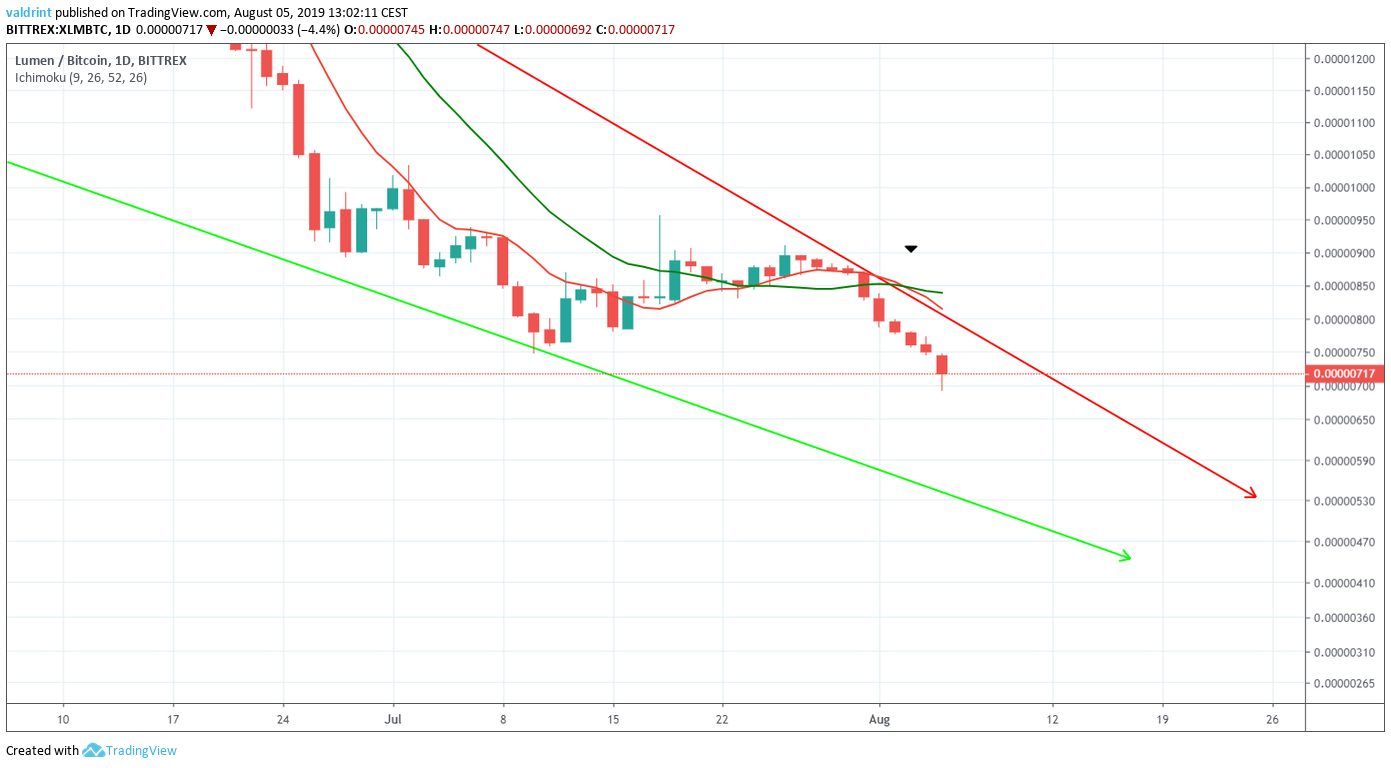
- Daily moving averages have made a bearish cross.
- There is significant support at 550 and 350 satoshis.
Previous Movement & Current Pattern
A look at the six-hour time-frame shows that XLM traded inside an ascending triangle throughout most of July.
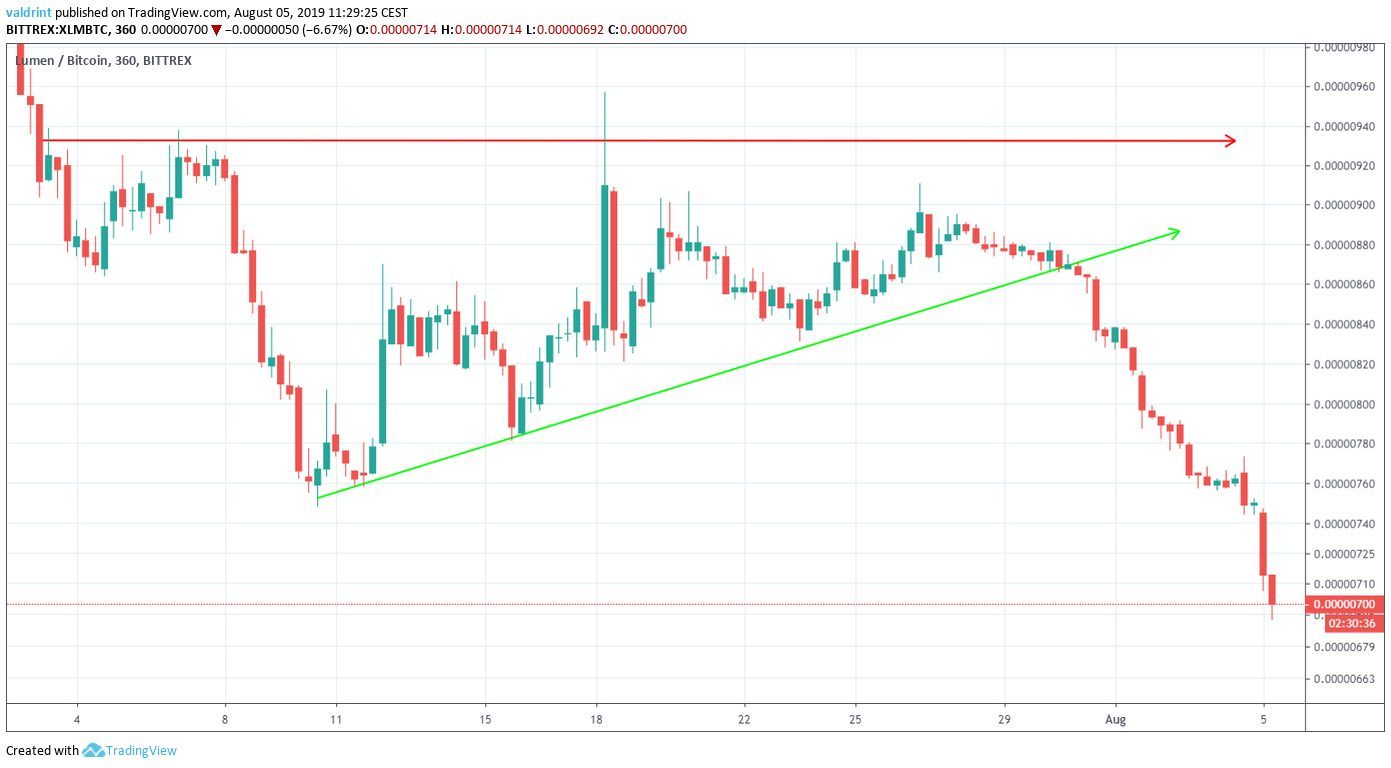
On July 30, the price broke down from this triangle.
It has been on a free fall since, decreasing without following a visible trading pattern.
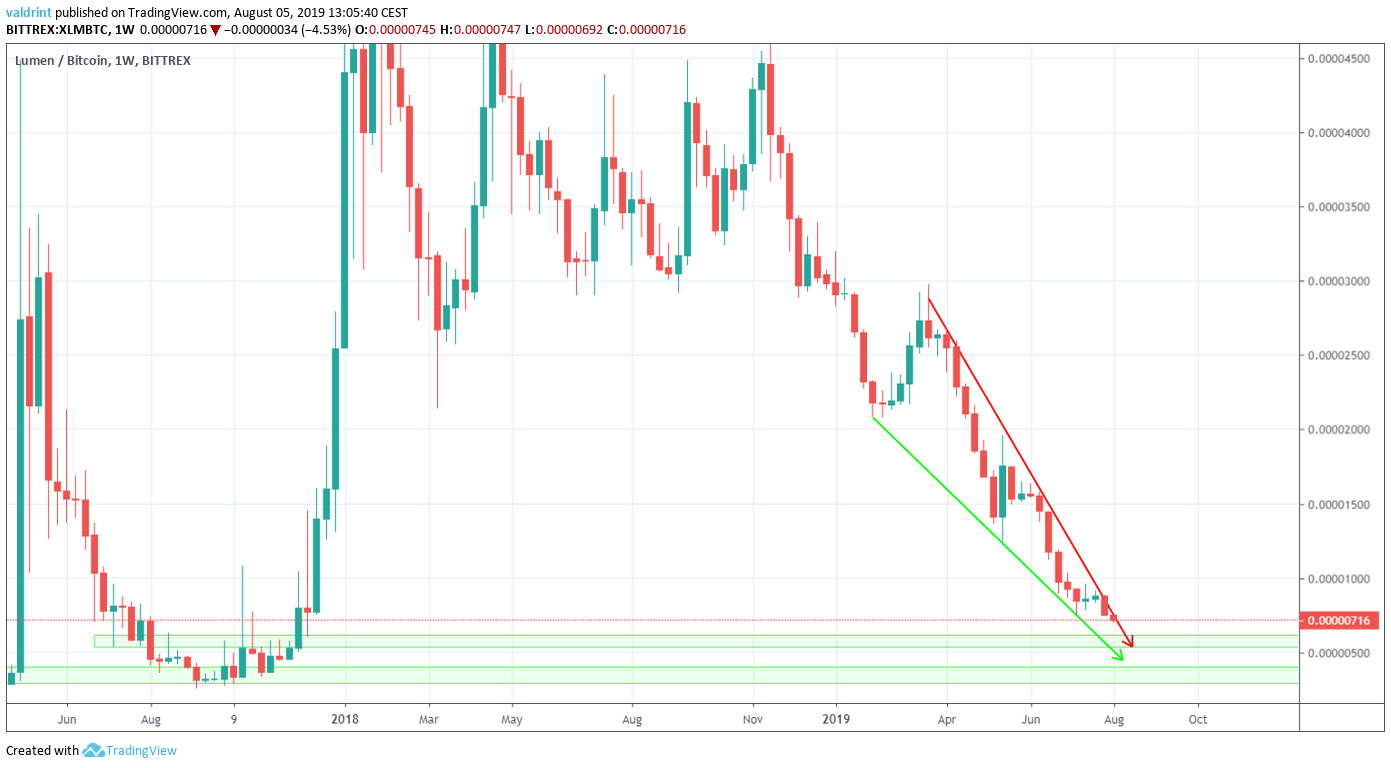
However, a look at the daily time-frame shows that XLM has been trading inside a descending wedge since February.
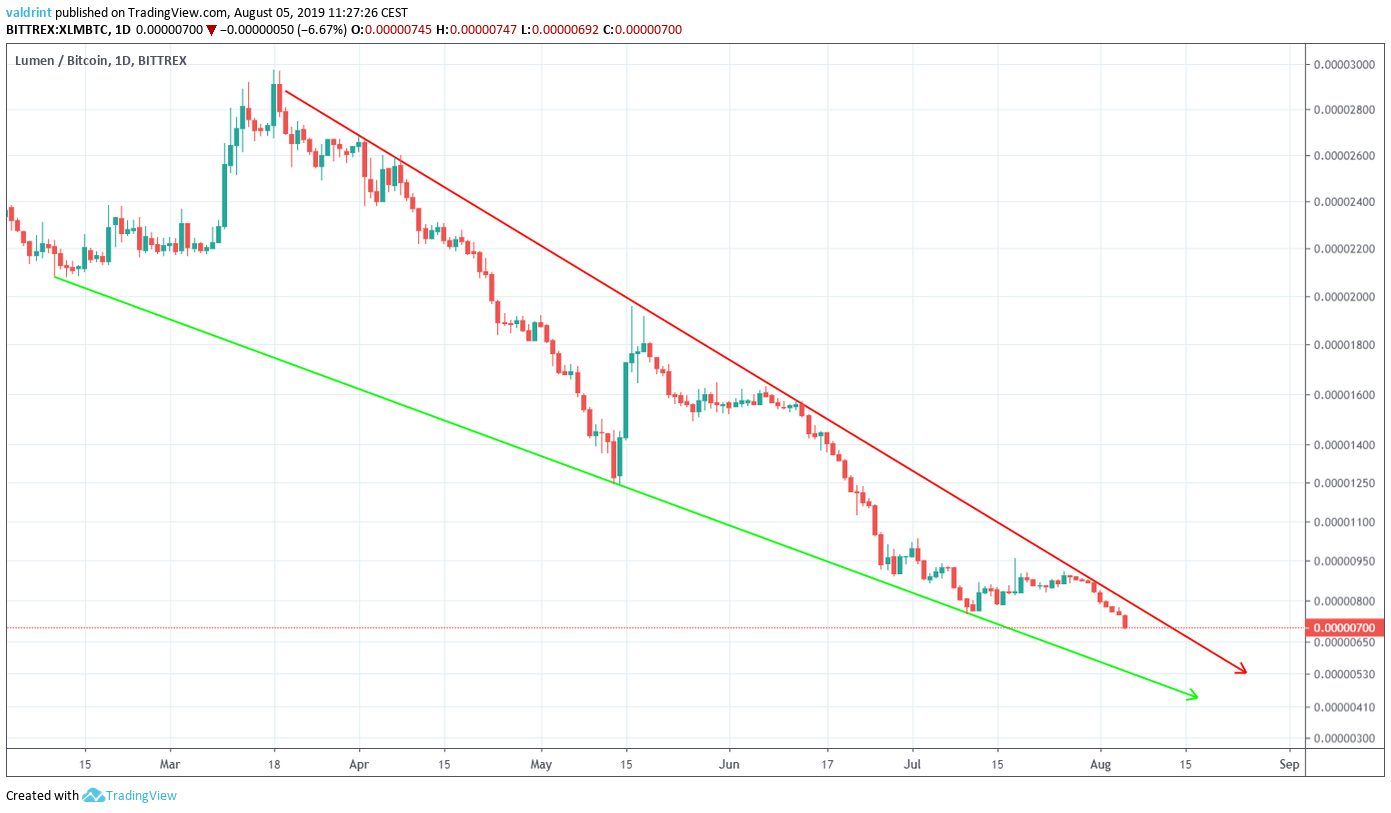
The breakdown from the triangle coincided with the price reaching the resistance line of the long-term wedge.
The support line of the wedge is currently at 550 satoshis.
Currently, it looks as if the Stellar price is heading towards it.
Let’s take a look at some technical indicators and see if that is likely.
Technical Indicators
A look at the RSI does not give us a clear answer as to where the price is heading.

Firstly, we can see that the upward move from support to resistance was preceded by a bullish divergence.
However, once it got there, the ensuing decrease caused the trend line of the divergence to break.
A look at the moving averages (MA) support a price decrease towards the support line of the wedge.
The most recent decrease caused a bearish cross to occur between the 10- and 20-day MAs on August 3.
This is often a sign that a downtrend has begun.
The price has been trading below both MAs since.
In order to figure out possible areas where the initiation of a reversal is likely, two long-term support areas are outlined below.
They are found at 550 and 350 satoshis respectively.
The first area coincides with the support line of the wedge.
According to our analysis, it is likely that the Stellar price will reach it.
Once it does, we will examine for signs of a possible reversal.
Stellar Price Summary
The XLM price is trading inside a descending wedge.
According to our analysis, it is likely to continue decreasing until it reaches the support line of the wedge.
Do you think the XLM price will come back? Let us know in the comments below.
Disclaimer: This article is not trading advice and should not be construed as such. Always consult a trained financial professional before investing in cryptocurrencies, as the market is particularly volatile.
Images are courtesy of Shutterstock, TradingView.


