


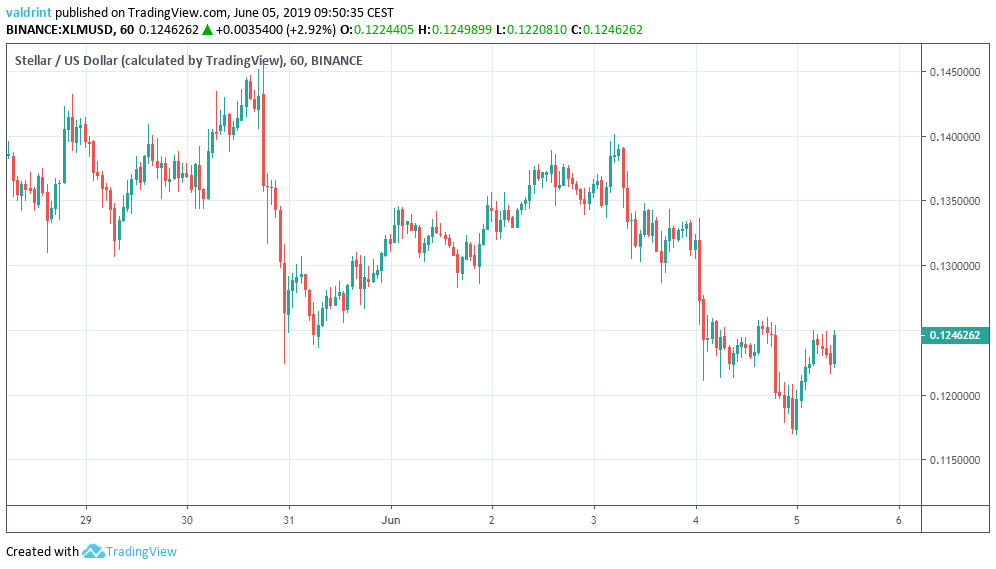
On May 30, the Stellar price (XLM) reached a high of $0.145. Since then, it has been decreasing — creating one lower high on Jun 3.
Where is the price heading to next? We will analyze the Stellar price in different time-frames, alongside technical indicators, in order to find out.
Stellar Lumens Price: Trends and Highlights for June 5, 2019
- The price reached a high on May 30.
- On Jun 4, it broke down from an ascending triangle.
- It is trading inside a horizontal channel.
- Price movements support a reversal.
- There is support near $0.11.
- There is resistance near $0.13.
Previous Stellar Price Movement
On May 20, XLM/USD reached a high of $0.146.
A rapid decrease ensued.
On May 23, the price reached a low of $0.113.
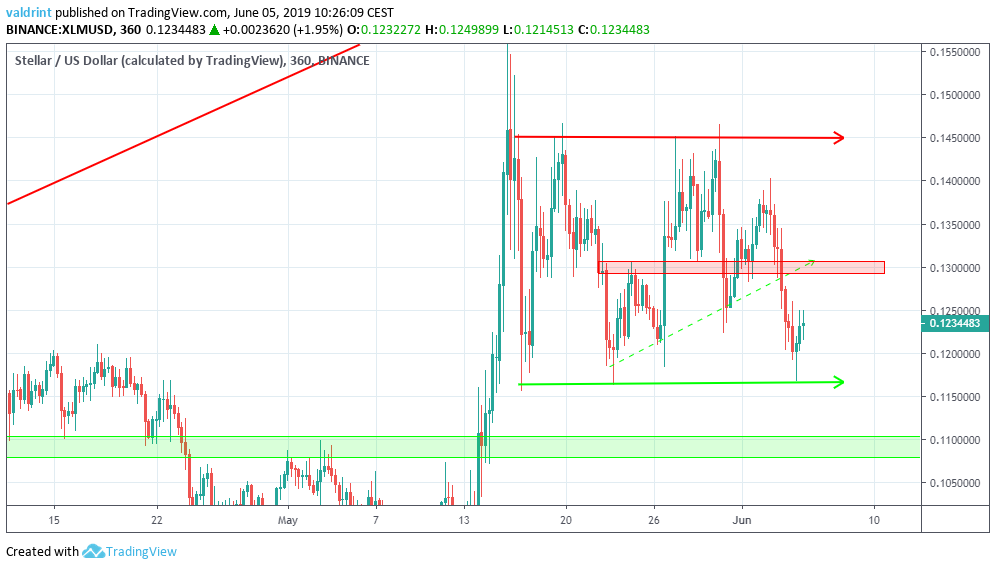
Since then, the price has been increasing, trading inside the ascending triangle outlined below:
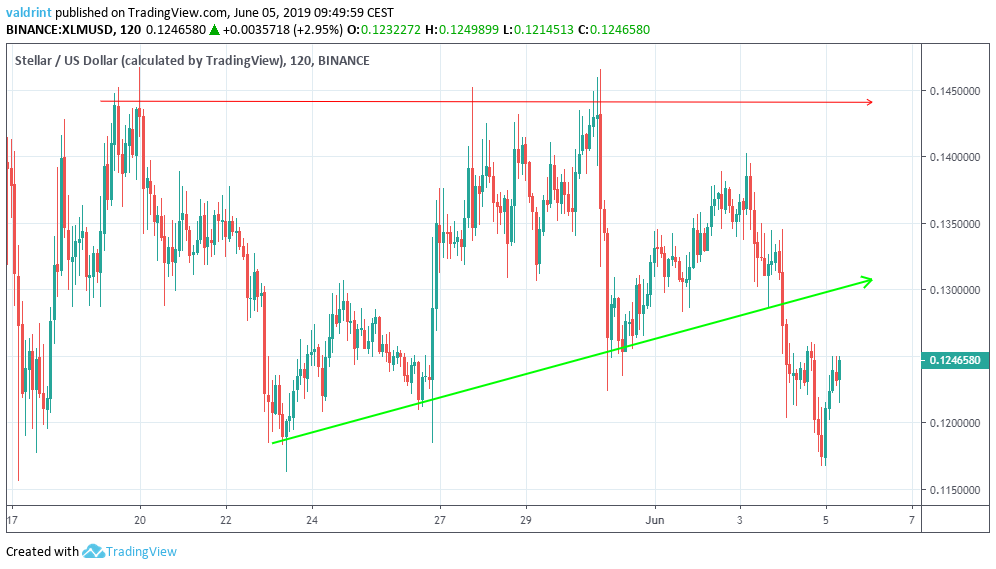
On Jun 4, the price broke down from the triangle.
It is currently following the descending support line outlined below:
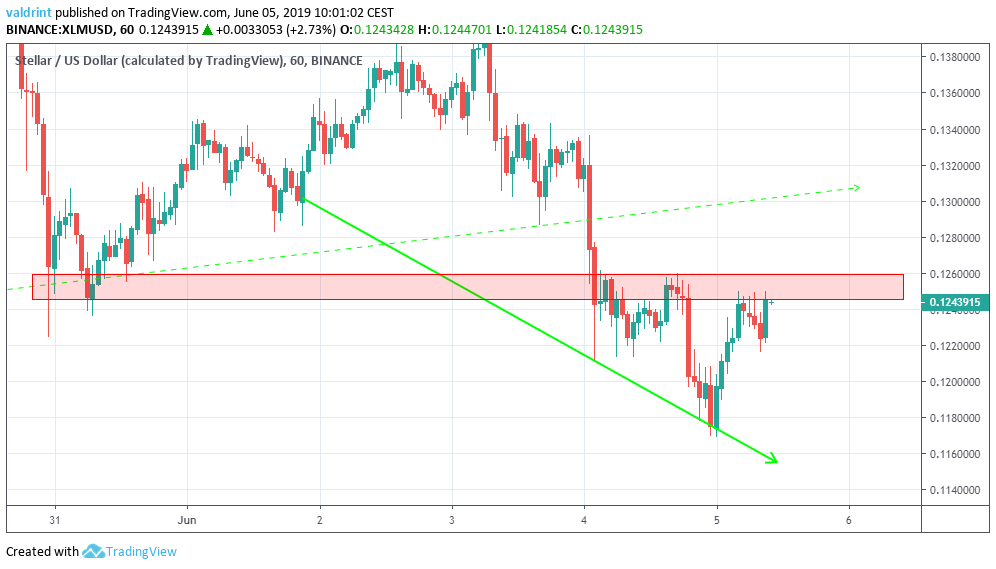
At the time of writing, the price was struggling to break out above the resistance area at $0.125.
Let’s take a look at a longer time-frame.
XLM’s Horizontal Channel
The Stellar price (XLM) is analyzed at four-hour intervals alongside Bollinger Bands.
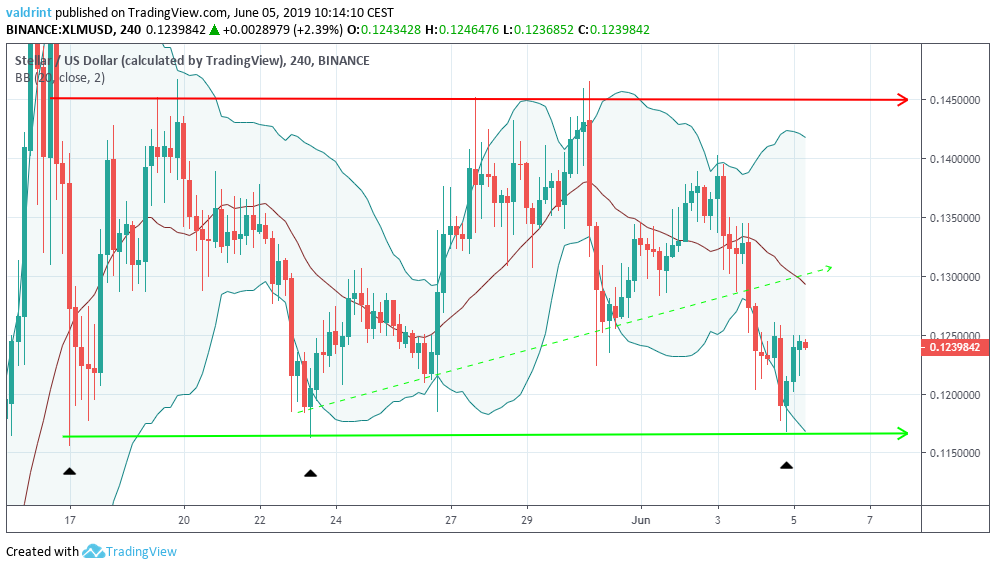
Since May 7, the price has been trading inside a horizontal channel with support at $0.117 and resistance at $0.145.
The candles that have touched the support line have had long lower wicks. This indicates that there is significant buying power around that level.
Furthermore, the candlestick on Jun 4 breached the lower limits of the Bollinger Bands. As can be seen on May 22 and 30, this has usually been followed by a reversal.
The use of these indicators supports price increases. It is likely that the price will touch the previous support line of the triangle.
Next, we will analyze possible reversal areas between the current Stellar price and the resistance line of the channel.
Stellar Lumens Reversal Areas
One support area and one resistance area are traced for Stellar lumens (XLM) below.
The closest support area is found near $0.11. If the price breaks down from the channel, it is likely to provide a reversal.
The closest resistance area is found near $0.13. We believe that the price will reach this area, even if it will not increase all the way to the resistance line of the channel.
Summary
To conclude, we believe that the Stellar lumens price (XLM) is likely to begin a short-term reversal towards the resistance area outlined above.
Do you think the Stellar lumens price (XLM) will reach our resistance area? Let us know your thoughts in the comments below!
Disclaimer: This article is not trading advice and should not be construed as such. Always consult a trained financial professional before investing in cryptocurrencies, as the market is particularly volatile.


