


Key Highlights For Steem (STEEM) Mar 6
- The price made a swing high of $0.445 on Mar 1
- It has made successive lower highs since.
- The price is trading inside a symmetrical triangle
- There is a slight short-term bearish divergence
- There is resistance near $0.445
- There is support near $0.365
Tracing The Resistance
The price of STEEM on Bittrex is analyzed on 1-Hour intervals from Mar 1 to Mar 6.
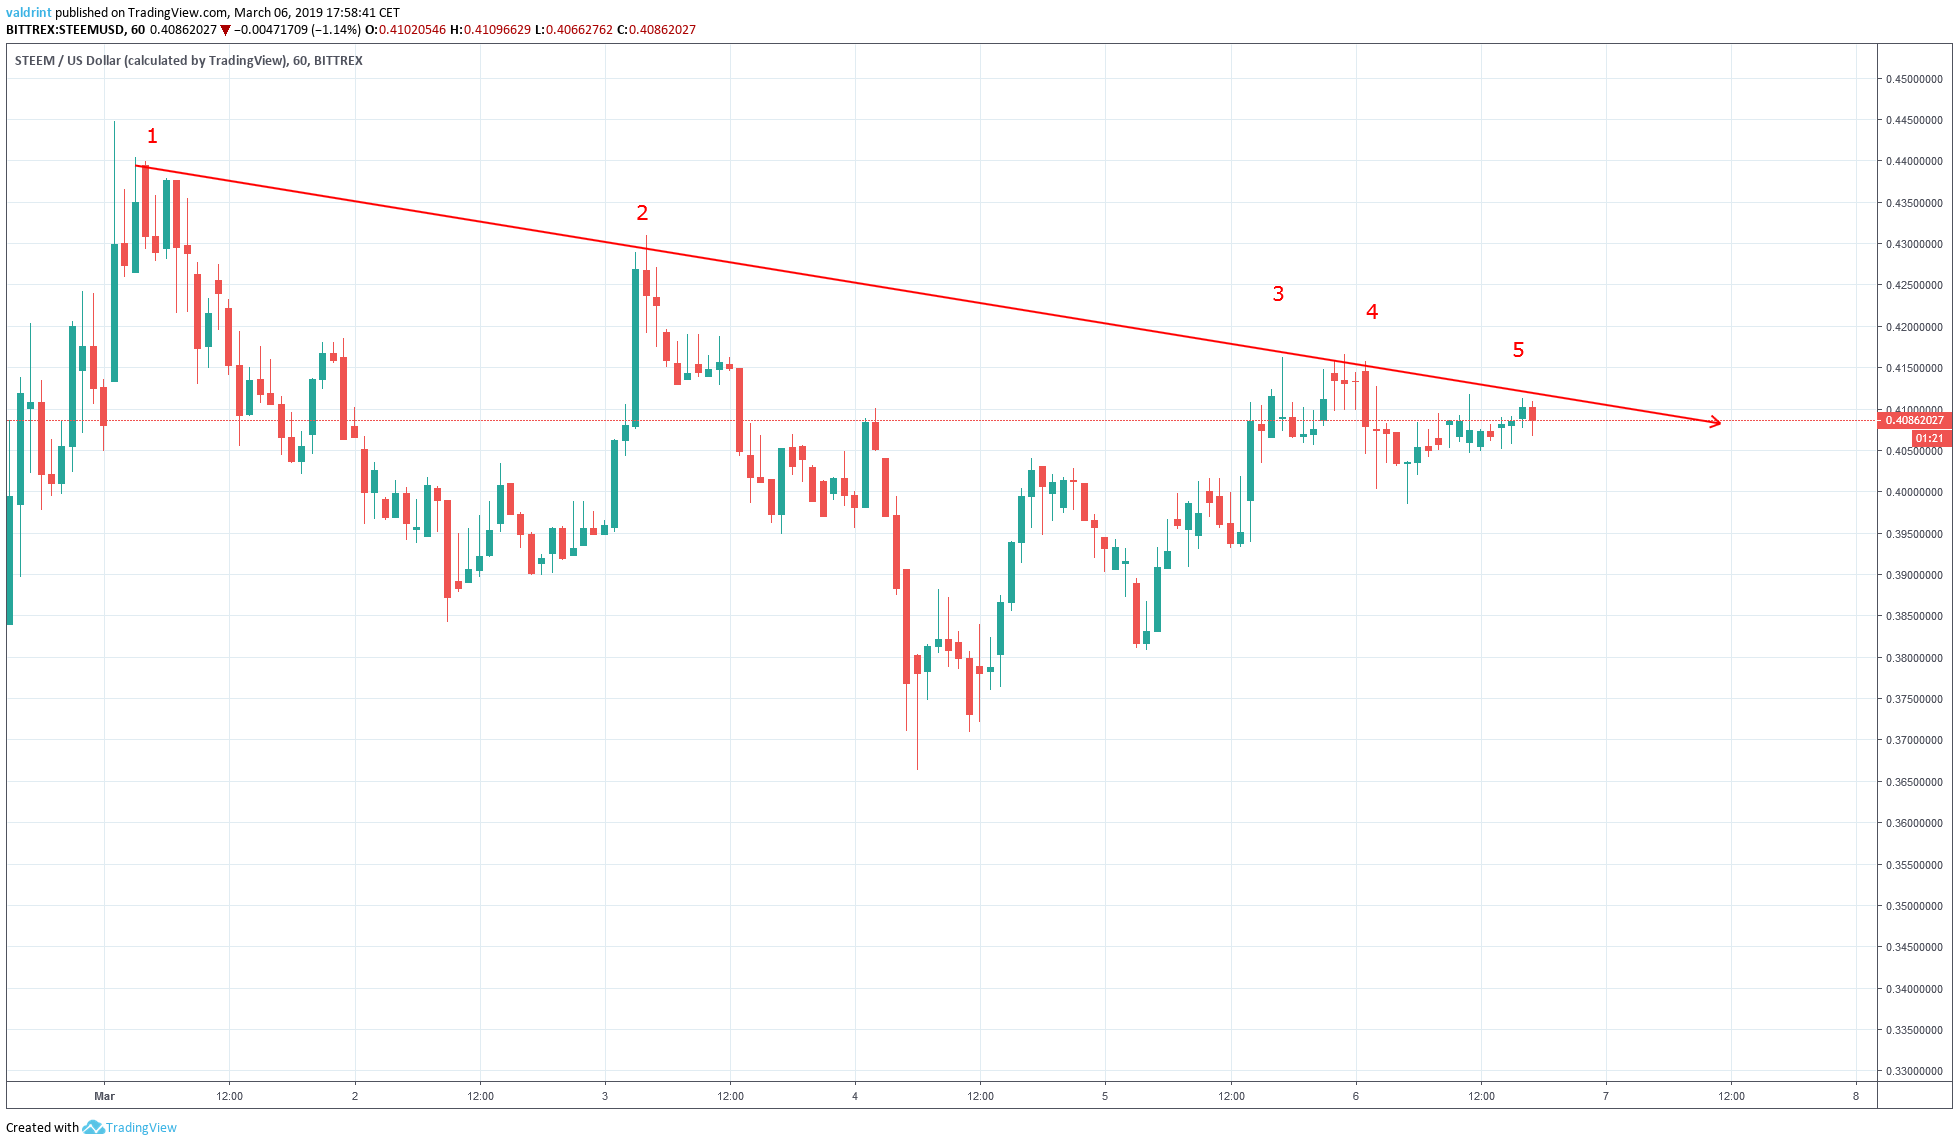
The price of STEEM reached a high of almost $0.45 on Mar 1. It made subsequent lower highs until Mar 6. The descending resistance line is created by tracing the lower highs. The validity of the line increases by the number of times it is touched.
The resistance line was touched five times:
- March 1
- March 3
- March 5
- March 6 (twice)
The resistance line can act as a ceiling to the price, preventing further upward movement. However, a breakout above can initiate a rapid rise.
No such breakout has occurred. On the contrary, the price of decrease since March 1 appears to decrease at the rate projected by the descending resistance line. This suggests that overall decreases in price may continue for the foreseeable future.
However, recent price increases may suggest a breakout from the resistance area.
Symmetrical Triangle
After reaching the second high on Mar 3, the price dropped all the way to $0.365. A gradual increase followed. The price made successive higher lows. The ascending support line is created by tracing the lows.
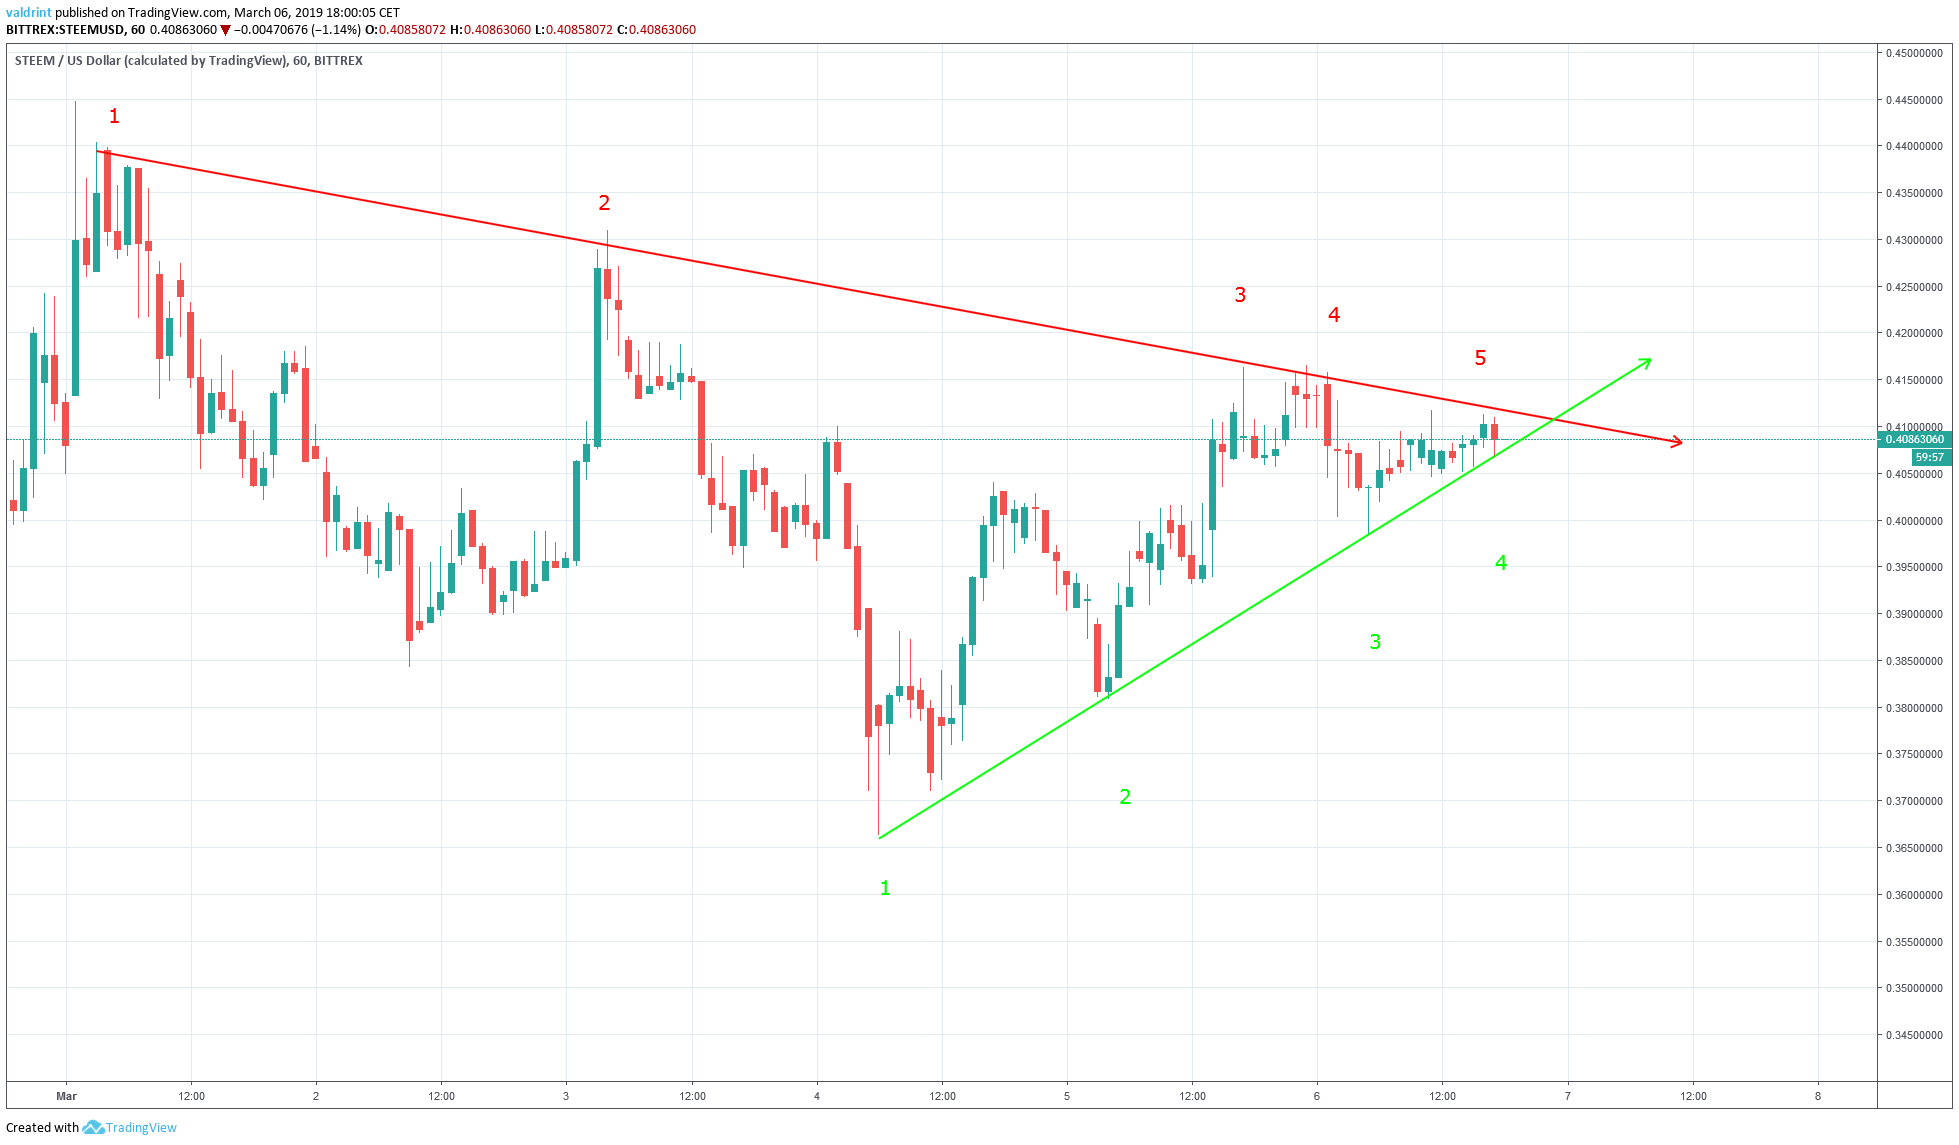
The line was touched four times:
- March 4
- March 5
- March 6 (twice)
The support and resistance lines combined create a symmetrical triangle. The symmetrical triangle is a neutral pattern, meaning a breakdown and breakout are equally likely.
However, the price increases are occurring during the latter half of a downward trend. If the upward trend continues, the price is likely to breakout out of the resistance area. The ascending support line could possibly become the new trend for Steem’s price—at least in the short term.
A breakdown below the support still remains possible. The recent upward trend may part of a market cycle, and a dip may be forthcoming. This could lead Steem to continue along the downward trend.
Possible Divergence
The moving average convergence divergence (MACD) is a trend indicator that shows the relationship between two moving averages (long and short-term) and the price. It is used to measure the strength of a move. The relative strength index (RSI) is an indicator which calculates the size of the changes in price in order to determine oversold or overbought conditions in the market.
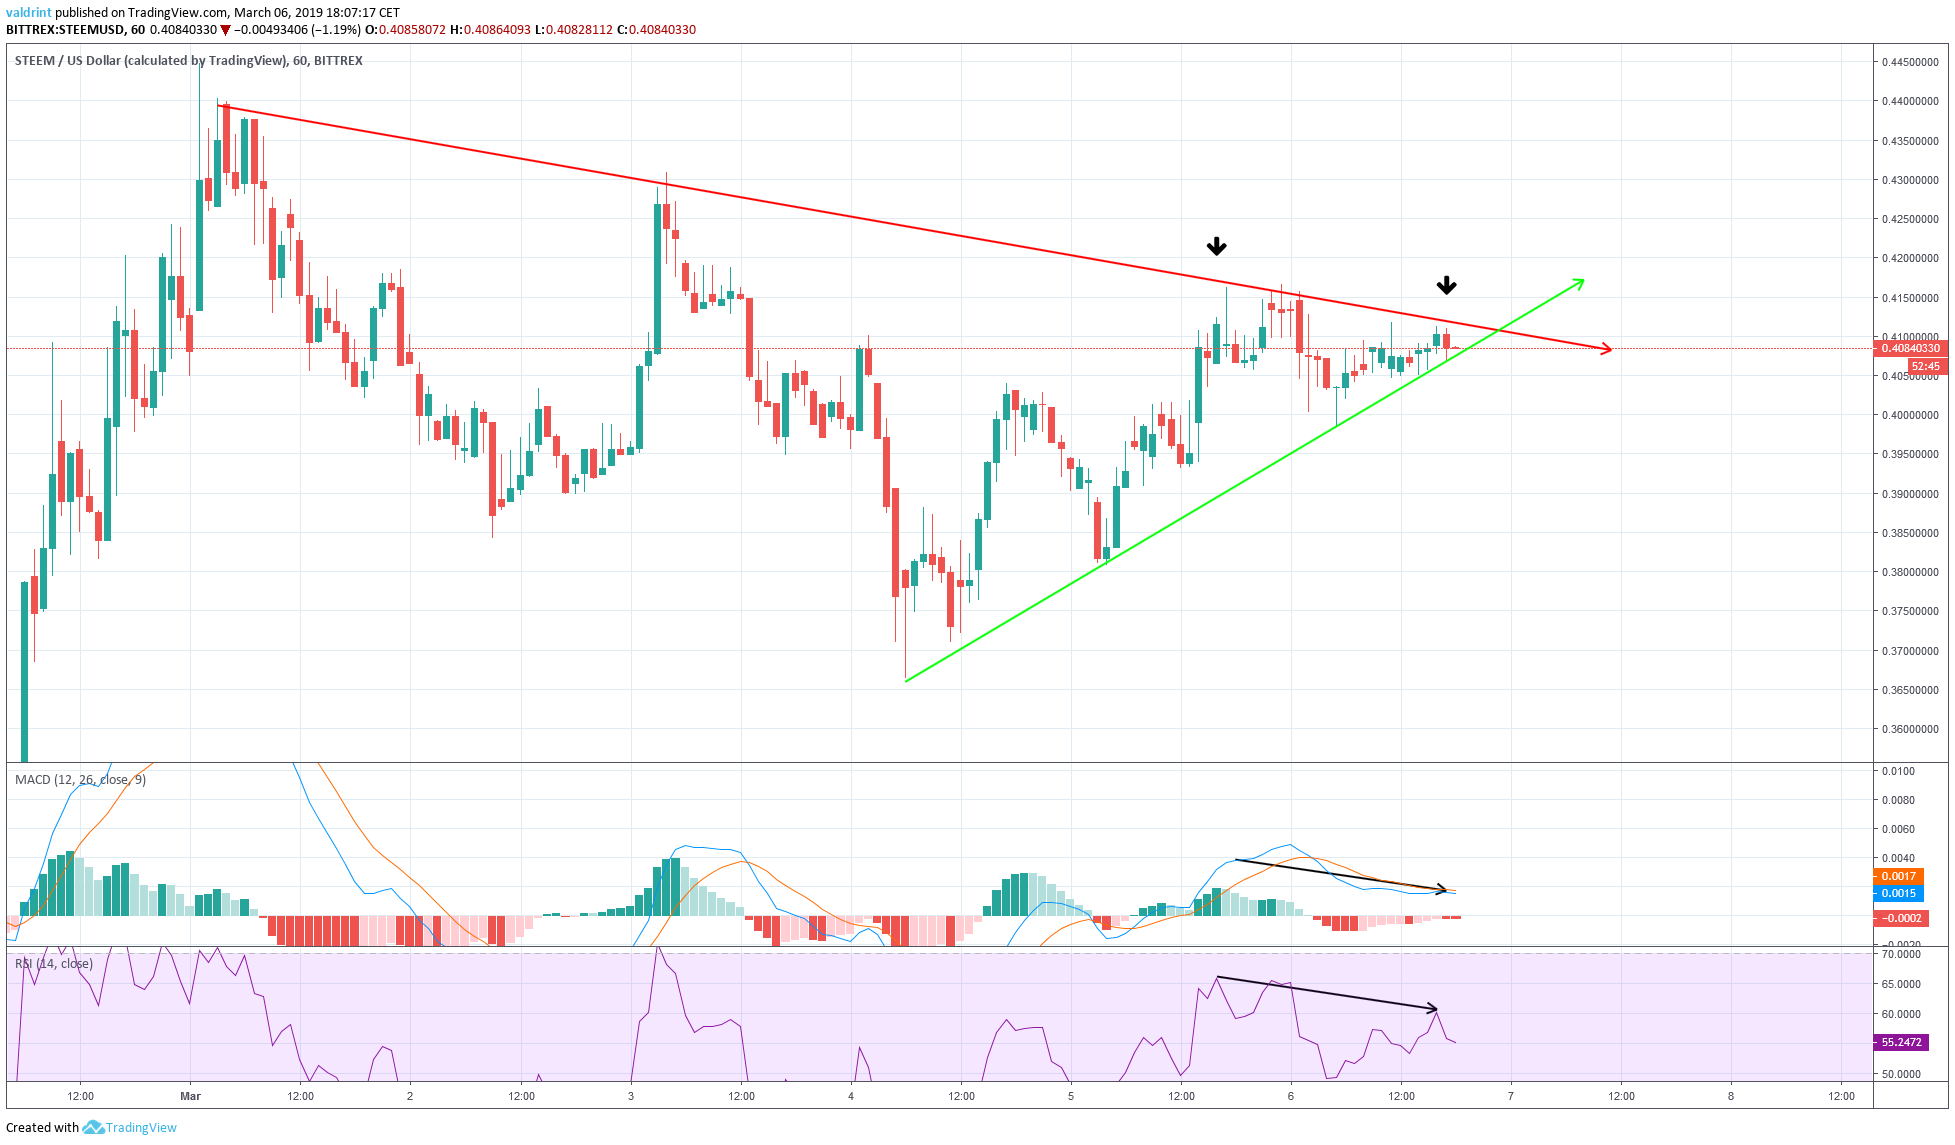
The price reached a high of $0.415 on Mar 5. It reached the same level on Mar 6.
The MACD and RSI reached a high during the same time on Mar 5. They both reached a lower level the second time around.
This is called bearish divergence. It often precedes drops in price. In the case of Steem, the amount of divergence was not very significant. This suggests that a drop in price may not be forthcoming and that the price may continue moving upward along the ascending support line.
Future Movements
The price of Steem on Bittrex is analyzed on 2-Hour intervals from Feb 24 to Mar 6 below:
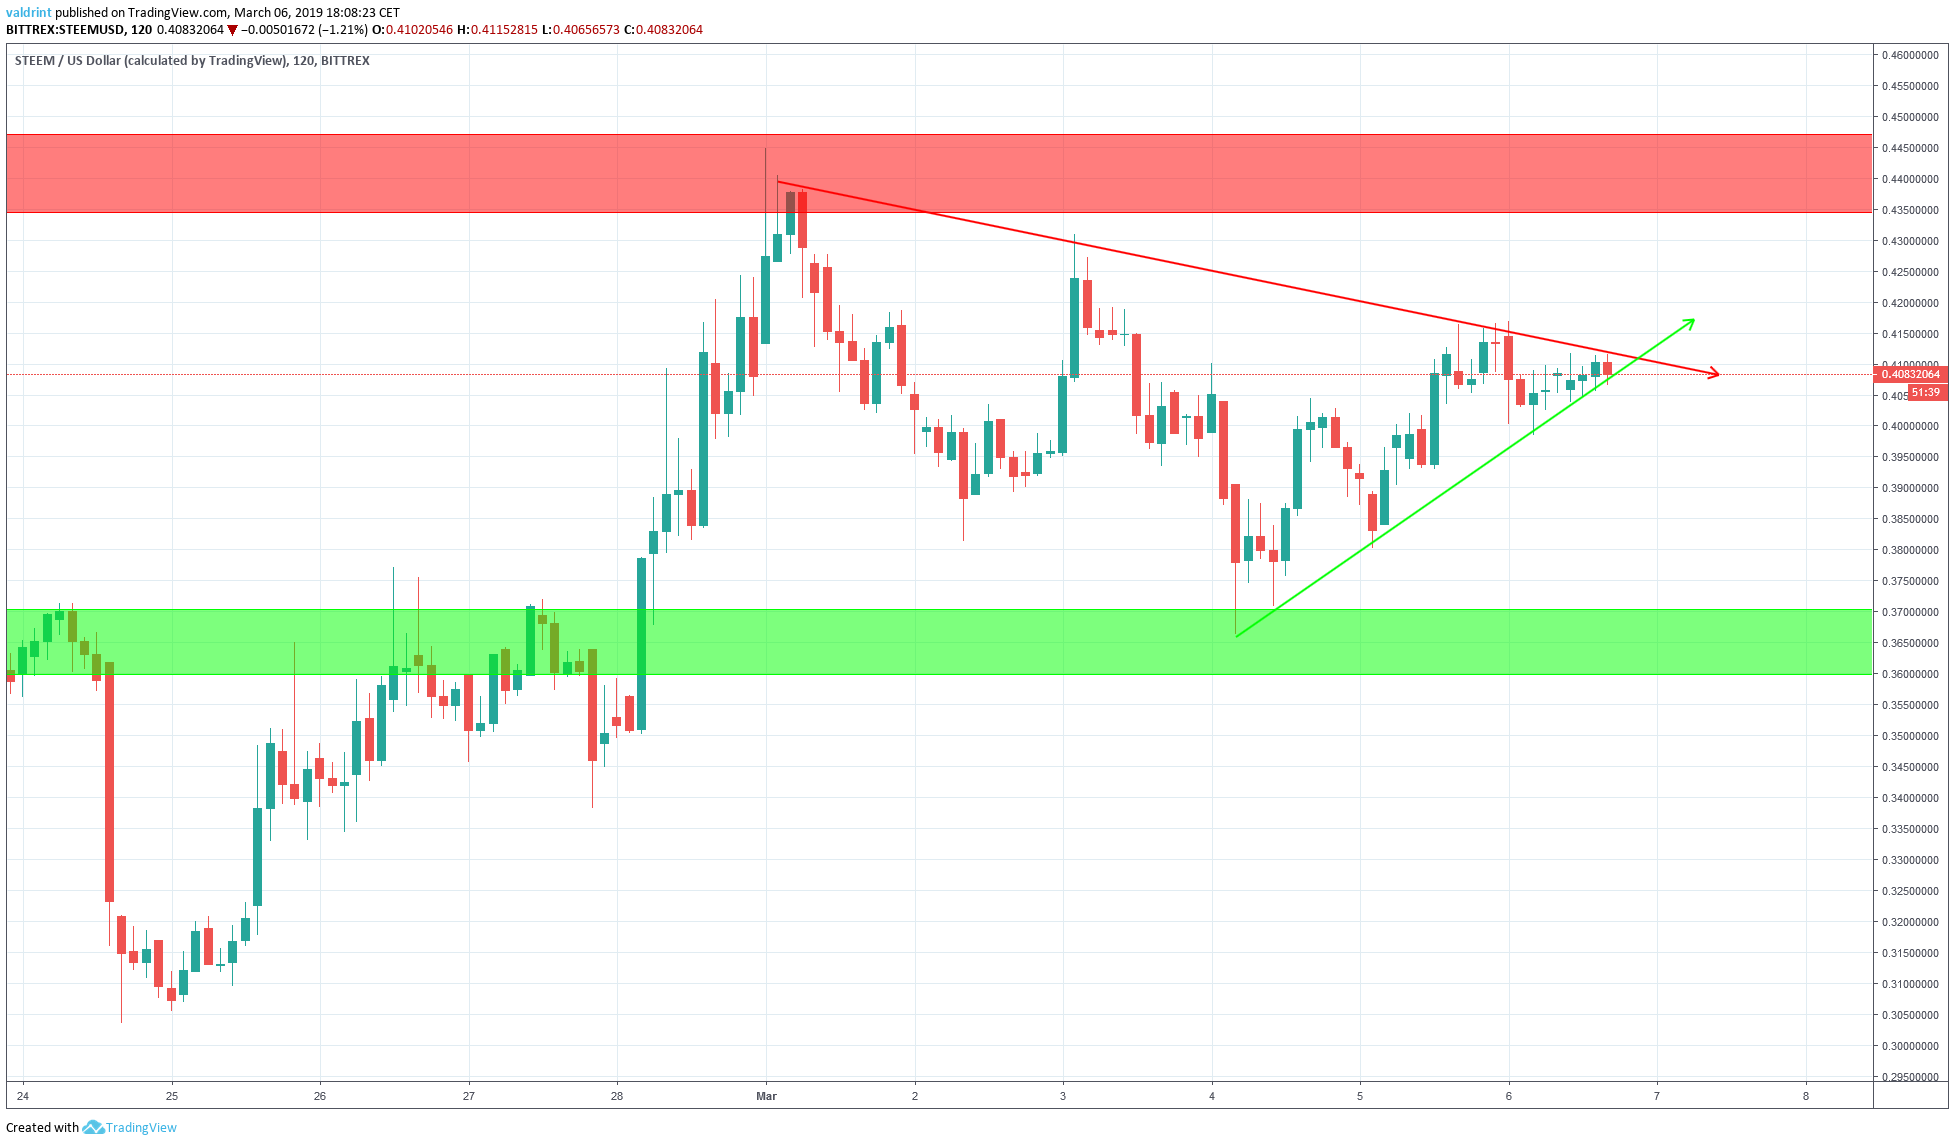
Resistance and support areas are created when the price reaches the same level several times. They effectively act as a ceiling and floor respectively to price, preventing further movement in that direction.
The closest resistance area is near $0.445. The closest support area is near $0.365.
Given the above information, the price of STEEM is equally likely to breakout or breakdown. In both cases, the resistance and support areas respectively are the most likely areas for a reversal.
Do you think that STEEM will breakout above the resistance line or breakdown below the support? Let us know your thoughts in the comments below and be sure to check out our in-depth Bitcoin Analysis and Price Prediction!
Disclaimer: This article is not trading advice and should not be construed as such. Always consult a trained financial professional before investing in cryptocurrencies, as the market is particularly volatile.


