


Sonic’s S has emerged as the market’s top gainer in the past 24 hours. Its price is up 15% in the past day as bullish momentum strengthens across the crypto market.
With a broader market recovery underway, investor sentiment toward the altcoin is turning increasingly positive, hinting at an extended uptrend.
Sonic’s Rally Gains Strength
Currently trading at a five-day high of $0.51, S is attempting to break above its Ichimoku Cloud. The token has climbed above the Cloud’s Leading Span A (green) and is now rallying toward the Leading Span B (red).
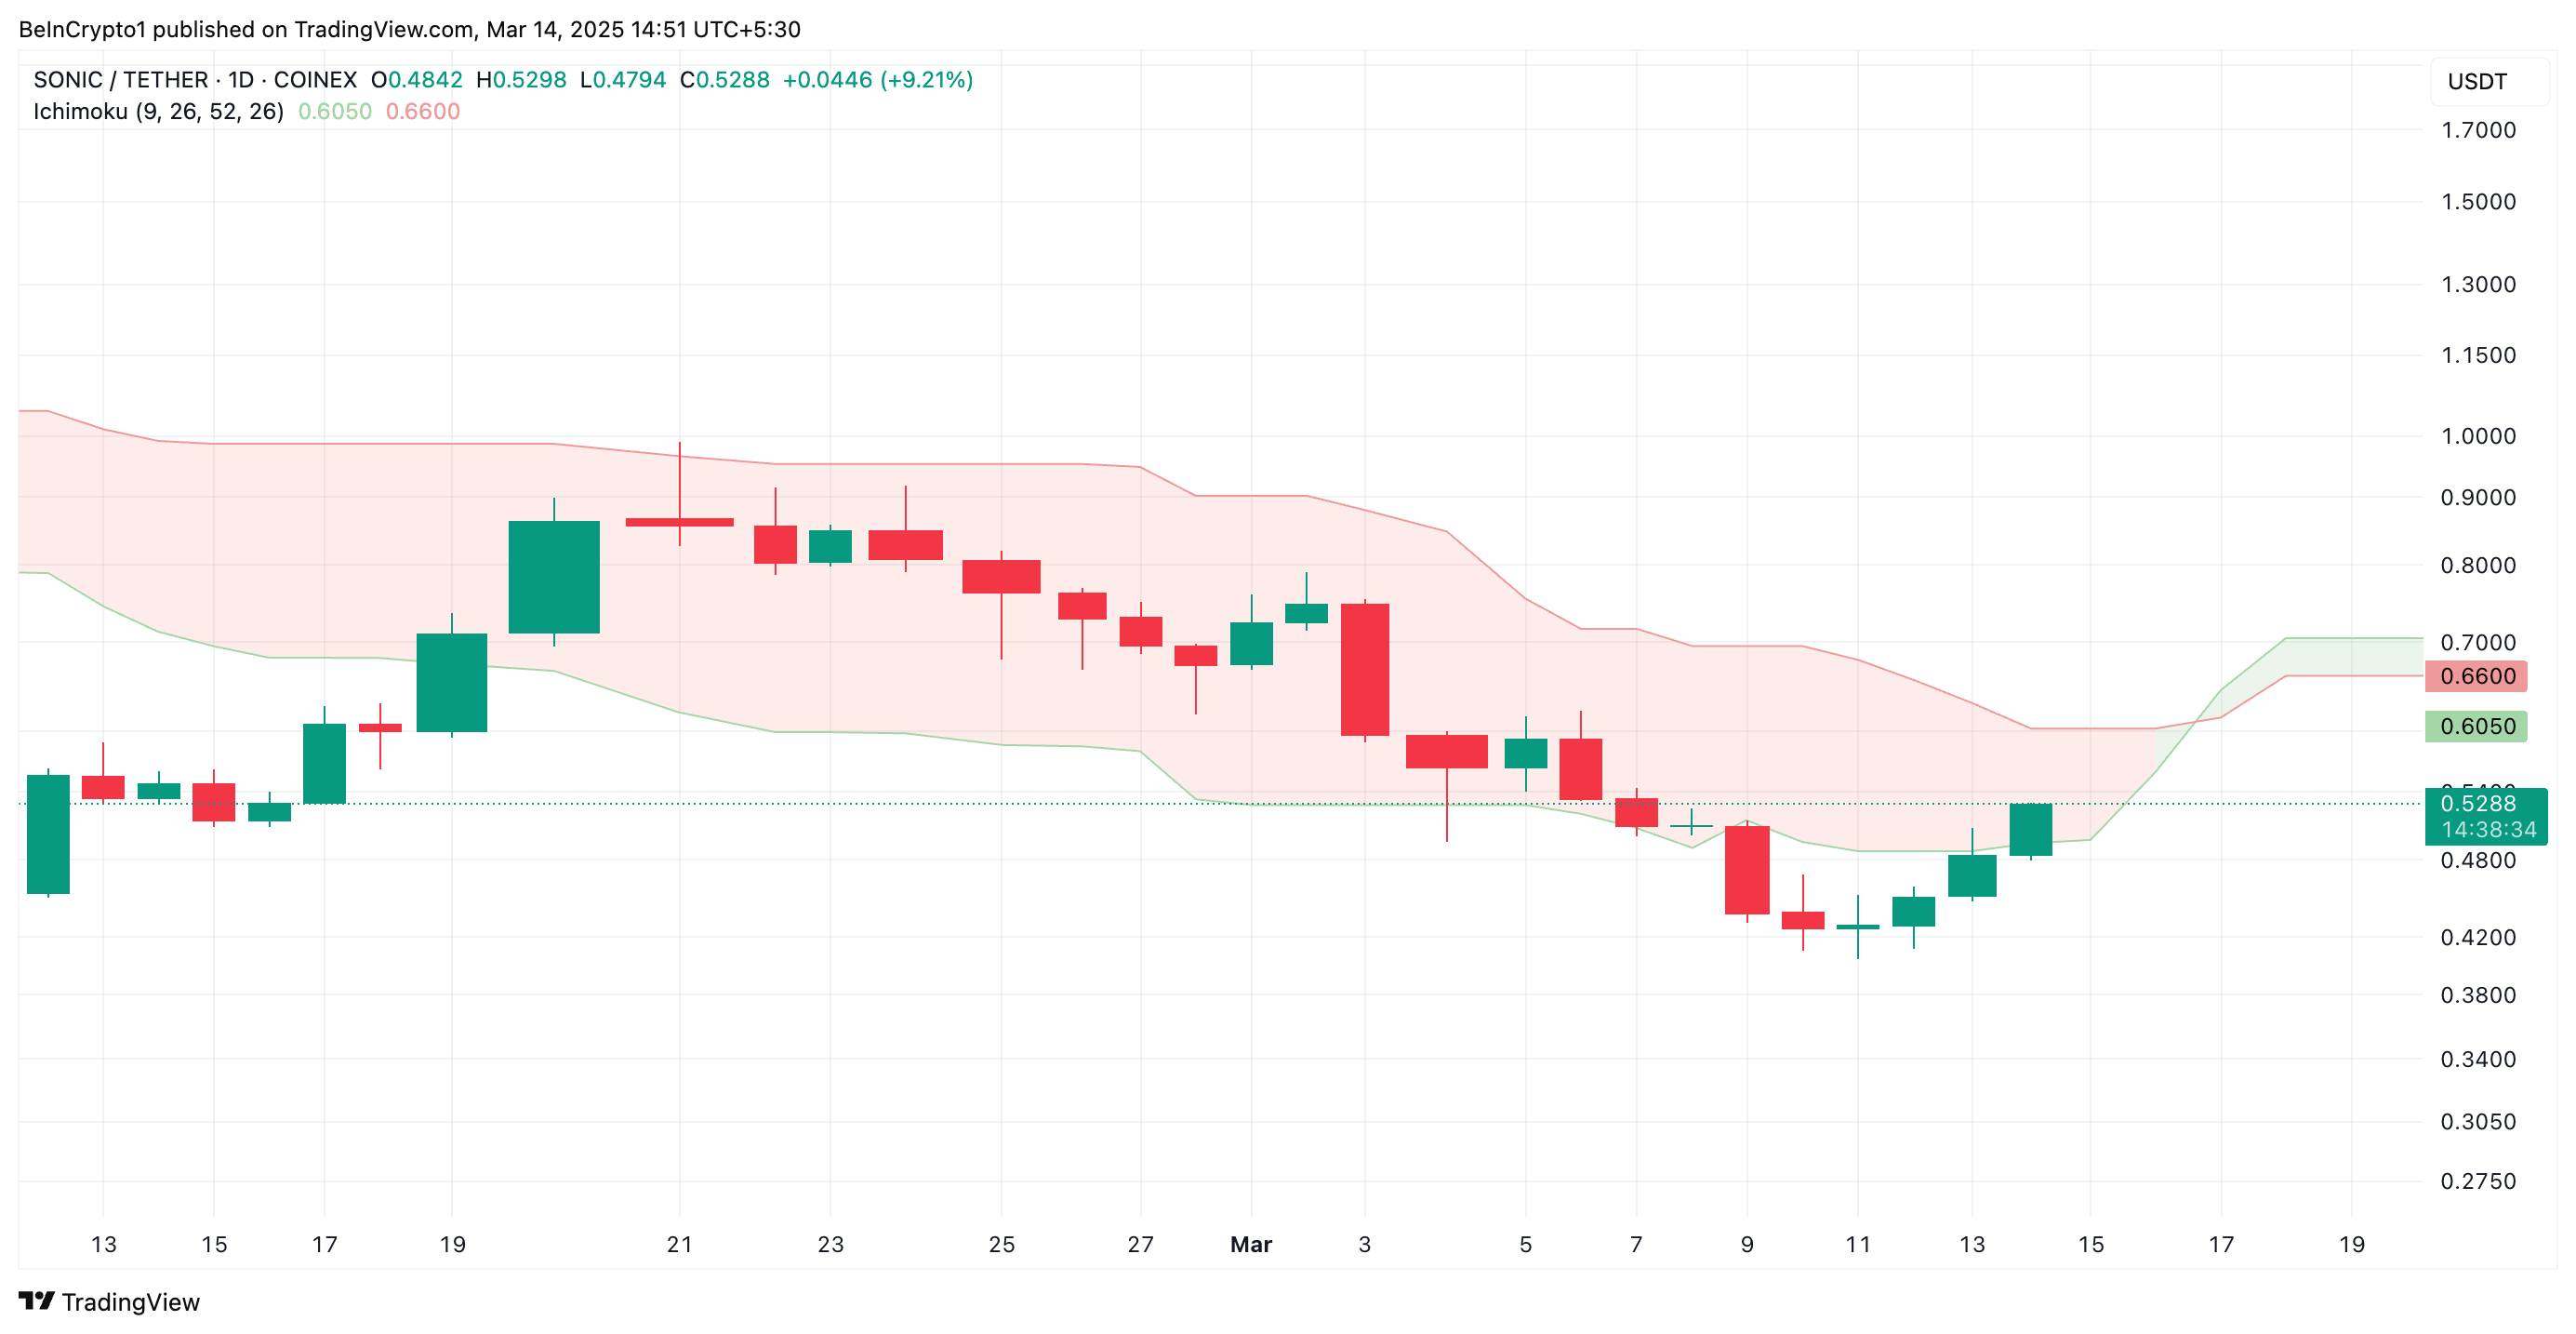
The Ichimoku Cloud tracks the momentum of an asset’s market trends and identifies potential support/resistance levels. When the price crosses the Leading Span A of this indicator, it signals a shift toward bullish momentum as demand rises.
With S continuing its rally toward the Leading Span B, an attempt to fully break out of the cloud would reinforce the bullish trend. A successful move above the red line would confirm the strong uptrend and indicate that S has cleared significant resistance.
Furthermore, S’ rising Relative Strength Index (RSI) confirms the positive trend, indicating strengthening momentum. At press time, this indicator, which measures an asset’s oversold and overbought market conditions, is climbing toward the 50-neutral line.
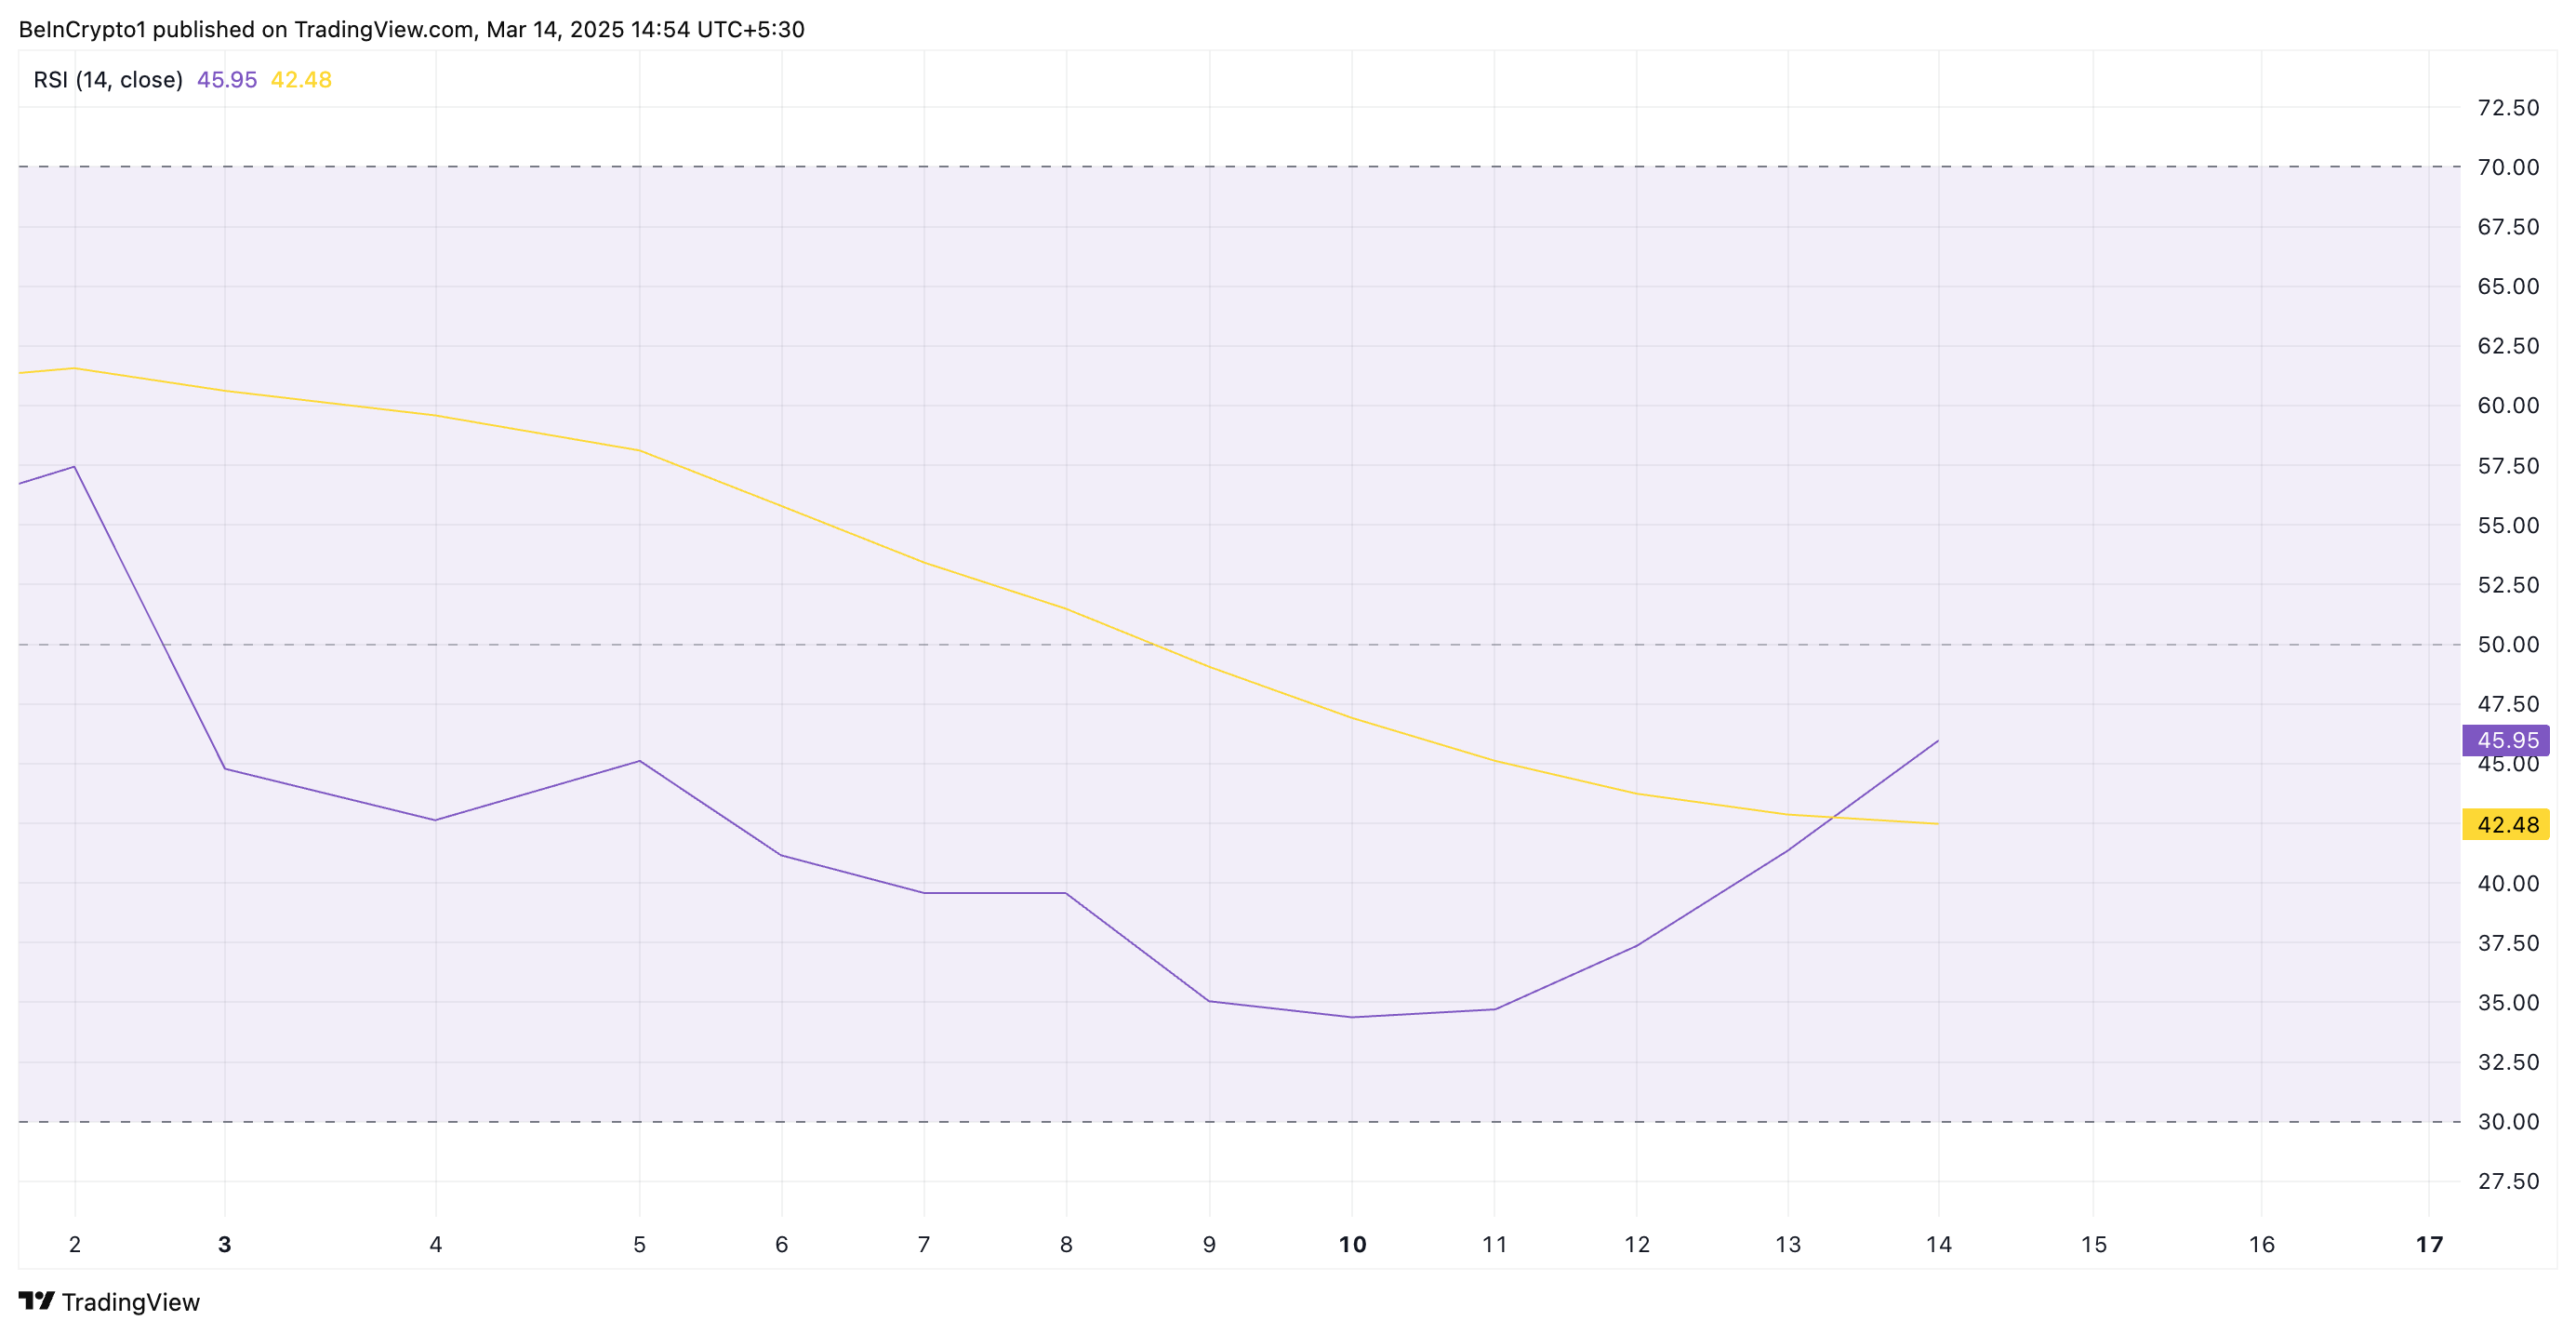
This RSI reading signals growing bullish sentiment among S holders as buying pressure increases. This move suggests a bullish reversal in the token’s price action.
S at a Crossroads: Rally Above $0.66 or Dip Below $0.33?
A sustained demand for S could push its price above the resistance at $0.59. If the token manages to flip this price level into a support floor, it could attempt to rally beyond the Leading Span B, which forms dynamic resistance above S’ price at $0.66.
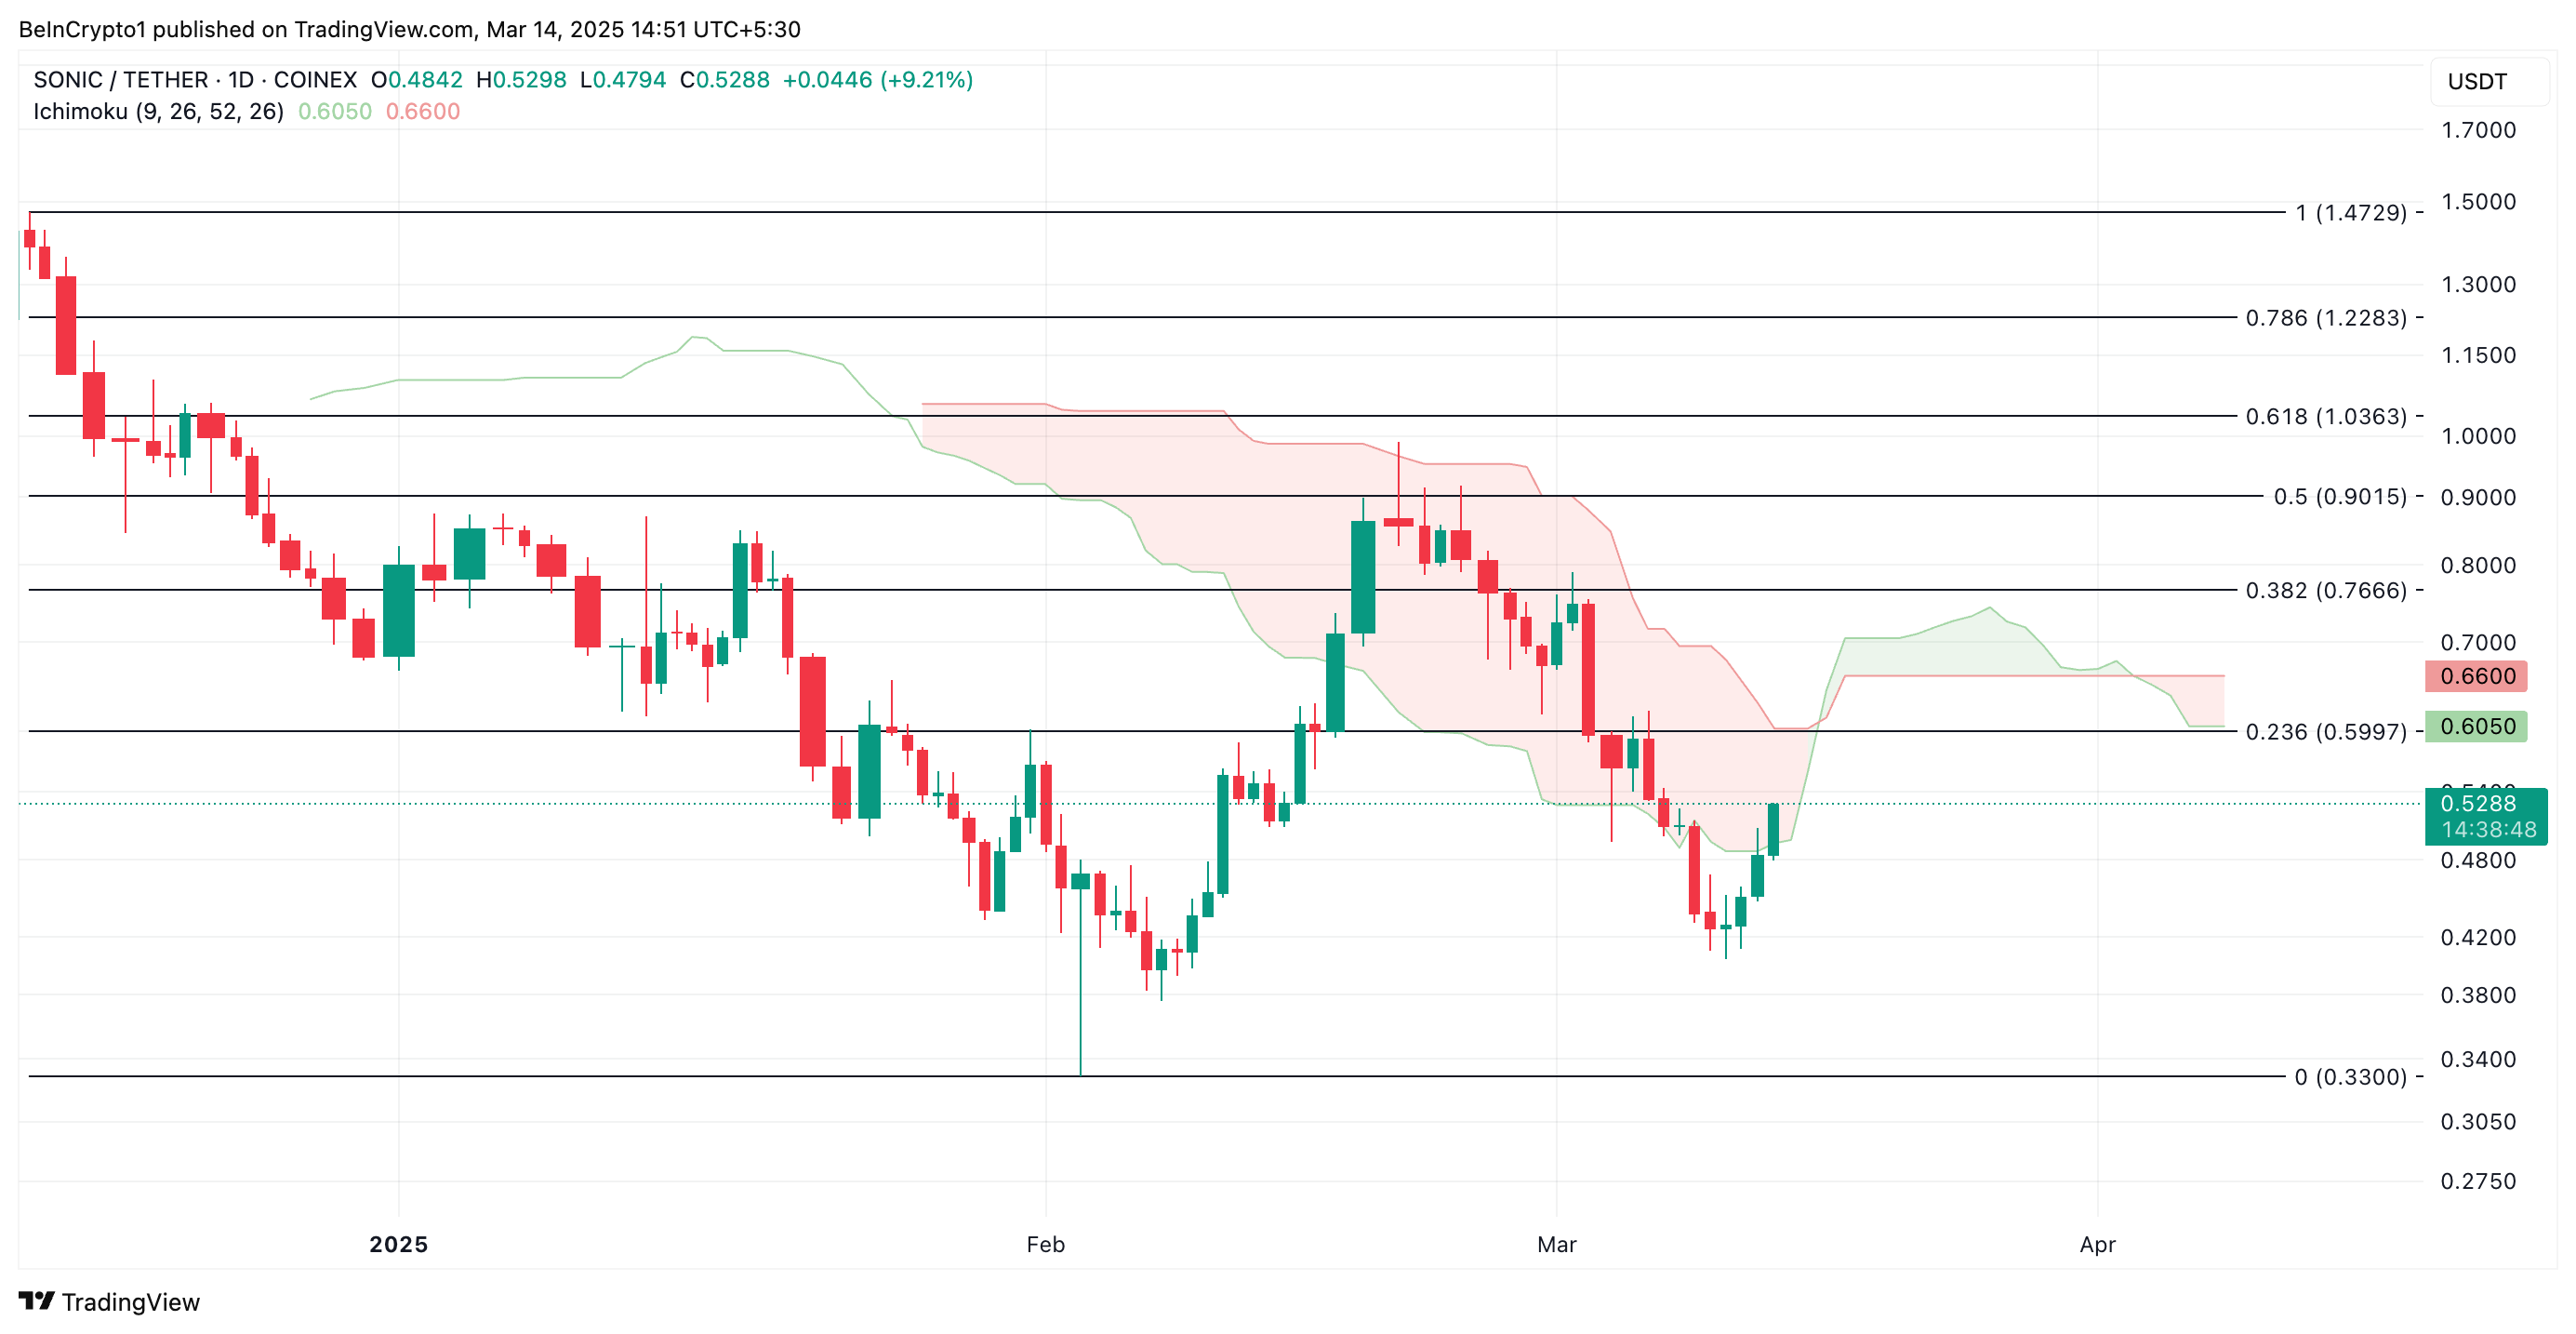
S Price Analysis. Source: TradingView
However, if selloffs resume, this bullish projection would be invalidated. In that scenario, S’ price could fall below the Cloud to trade at $0.33.



