


The Solana (SOL) price created a short-term bullish pattern that could generate a relief rally. Despite this, the long-term readings remain bearish.
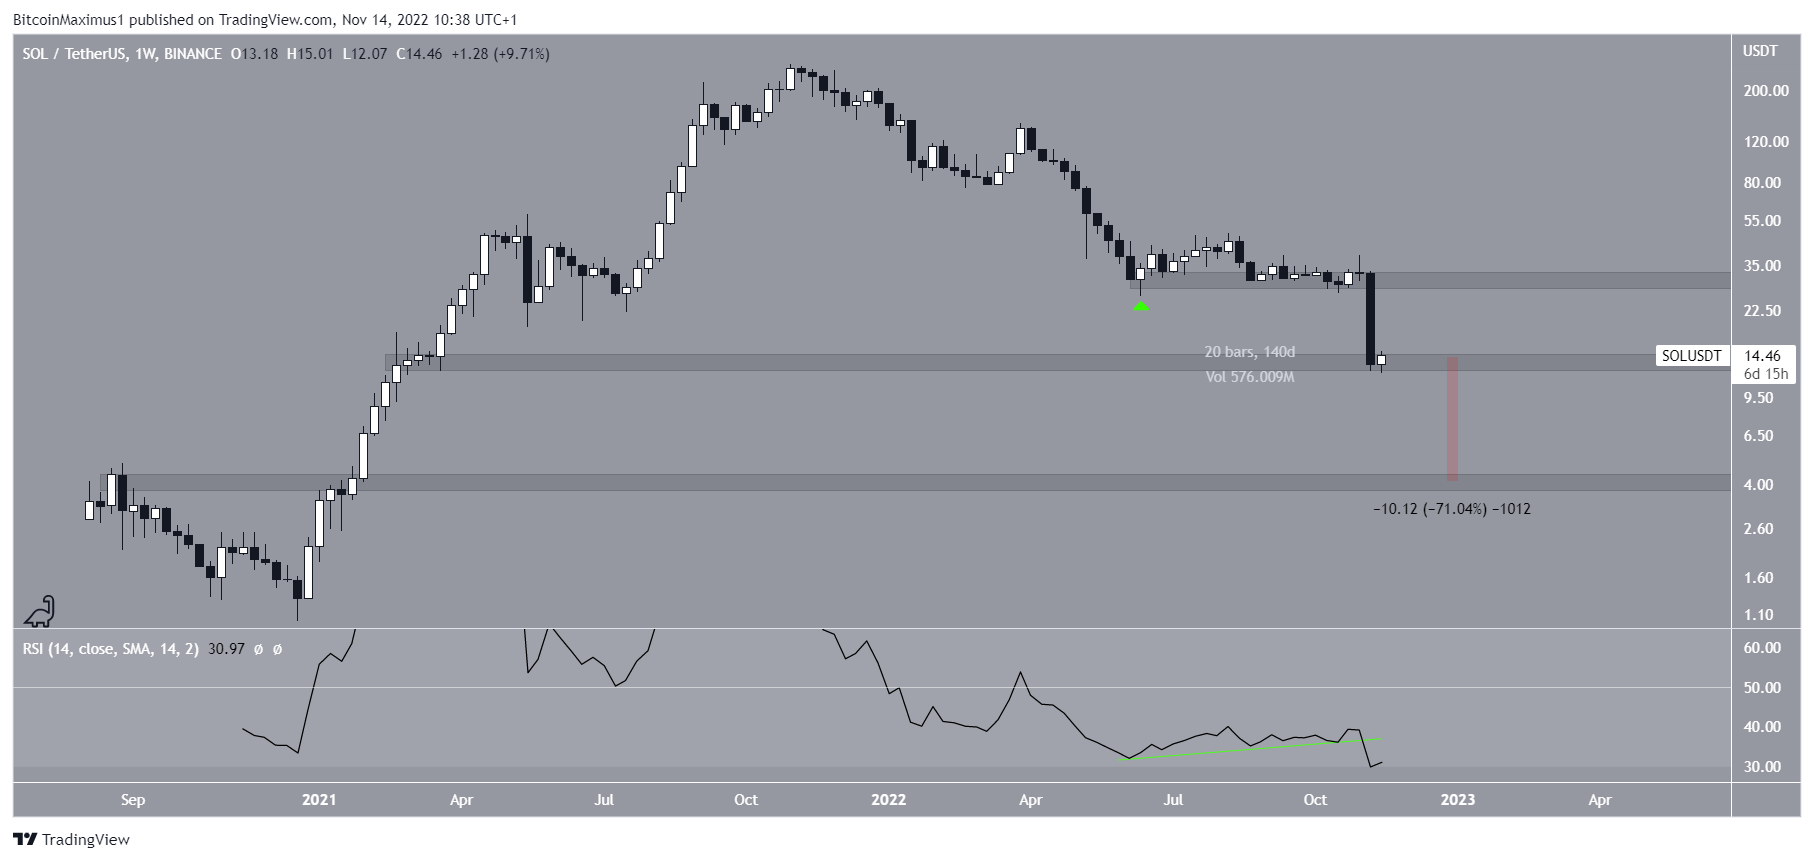
The Solana price has fallen since Nov. 2021, after it reached an all-time high price of $253.30. The SOL price bounced (green icon) at the $29 horizontal support area and traded above it for 140 days.
However, it broke down in the beginning of Nov. 2022. The breakdown led to a low of $12.07. It is possible that it was caused due to negative Solana news relating to the FTX implosion, which caused a similar decrease throughout the crypto market.
Currently, the Solana price is trading inside the $13 horizontal support area after bouncing slightly in the past 24 hours. Despite SOL being at support, technical indicators are bearish. This is especially visible in the weekly RSI, which has broken down from its bullish divergence trend line (green line).
However, it is worth mentioning that the weekly RSI is at an all-time low. If a breakdown from the $13 area transpires, the next closest support would be at $4. A fall to it would be a decrease of roughly 70%.
Solana Price Prediction: Double Bottom Initiates Relief Rally
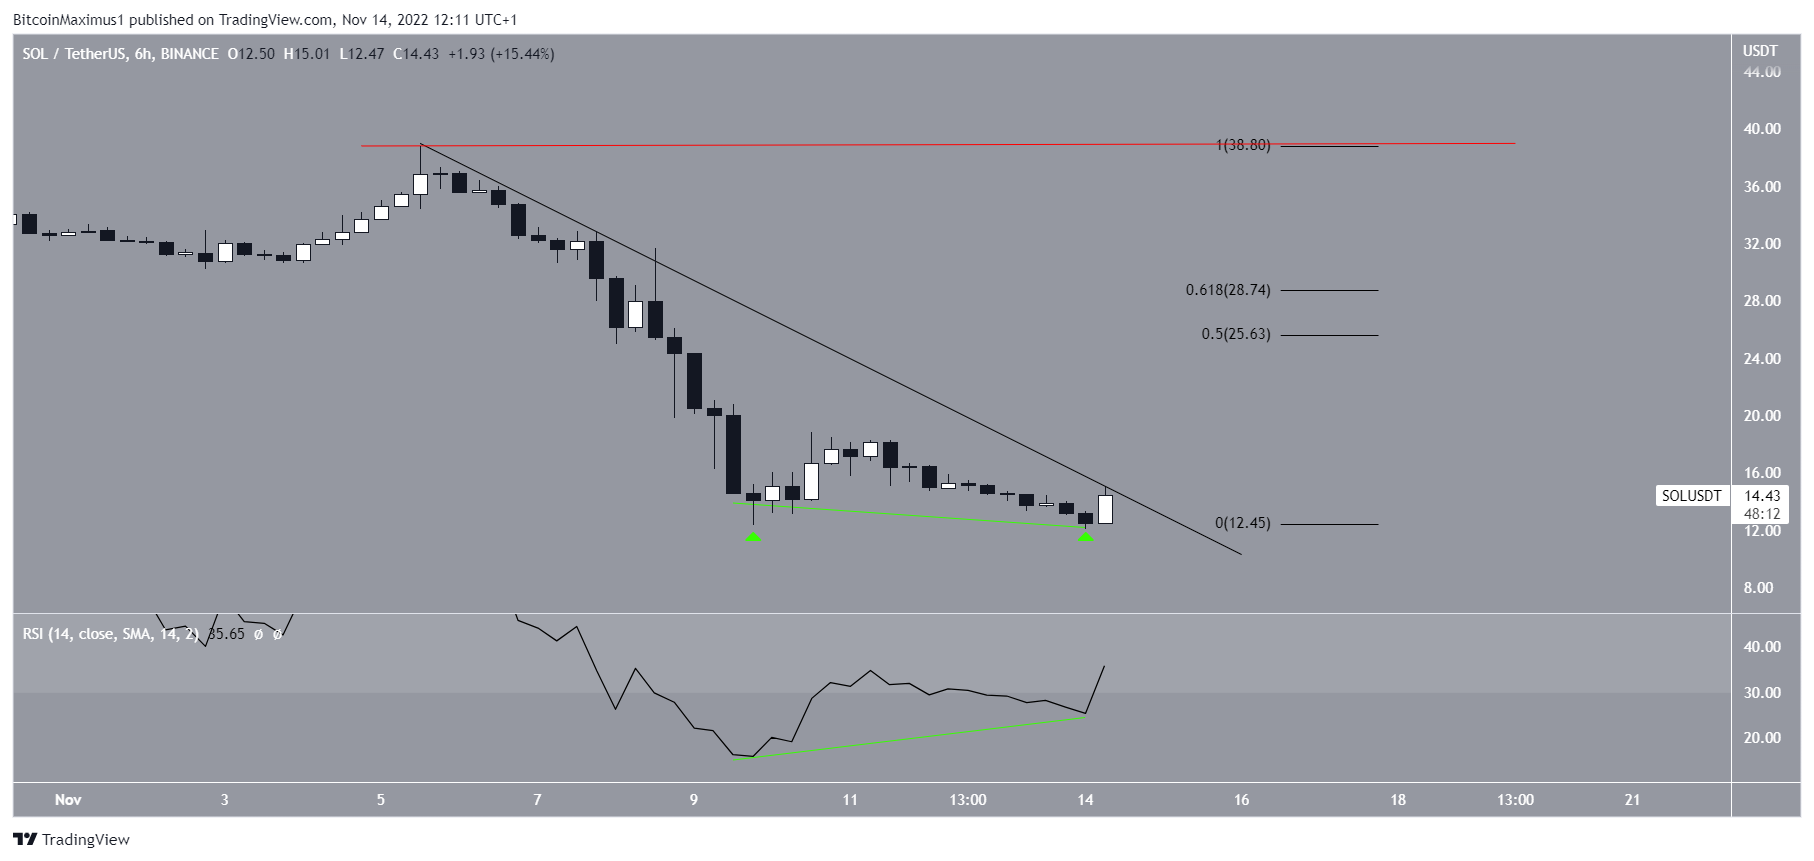
The short-term six-hour chart provides a slightly more bullish outlook. The reason for this is a double bottom pattern between Nov. 11 and 14. The double bottom is combined with a bullish divergence in the RSI (green line).
The Solana price has reached a descending resistance line in place since Nov. 6. If the Solana price breaks out from the resistance line, the closest resistance area would be between $25.63-$25.74, created by the 0.5-0.618 Fib retracement resistance levels.
Due to the bearish readings from the weekly time frame, a rejection from the area would be expected. Afterward, the Solana price could re-test the $13 support area.
An increase above the Nov. 5 high of $38.79 (red line) would invalidate this bearish Solana (SOL) price prediction.
For BeInCrypto’s latest Bitcoin (BTC) analysis, click here.
Disclaimer: BeInCrypto strives to provide accurate and up-to-date information, but it will not be responsible for any missing facts or inaccurate information. You comply and understand that you should use any of this information at your own risk. Cryptocurrencies are highly volatile financial assets, so research and make your own financial decisions.


