
Solana (SOL) may face a potential roadblock after a bullish breakout earlier this month. On July 19, the altcoin rallied past the upper line of its symmetrical triangle, within which it had traded since March 18.
However, with waning buying pressure amid growing bearish sentiments, Solana is retracing and nearing the critical breakout level.
Solana Makes Move To Retest Key Breakout Level
SOL began trading within the symmetrical triangle channel on March 18. This pattern is formed when an asset’s price trades between two converging lines. It often indicates a period of price consolidation in the market as buyers and sellers battle for control.
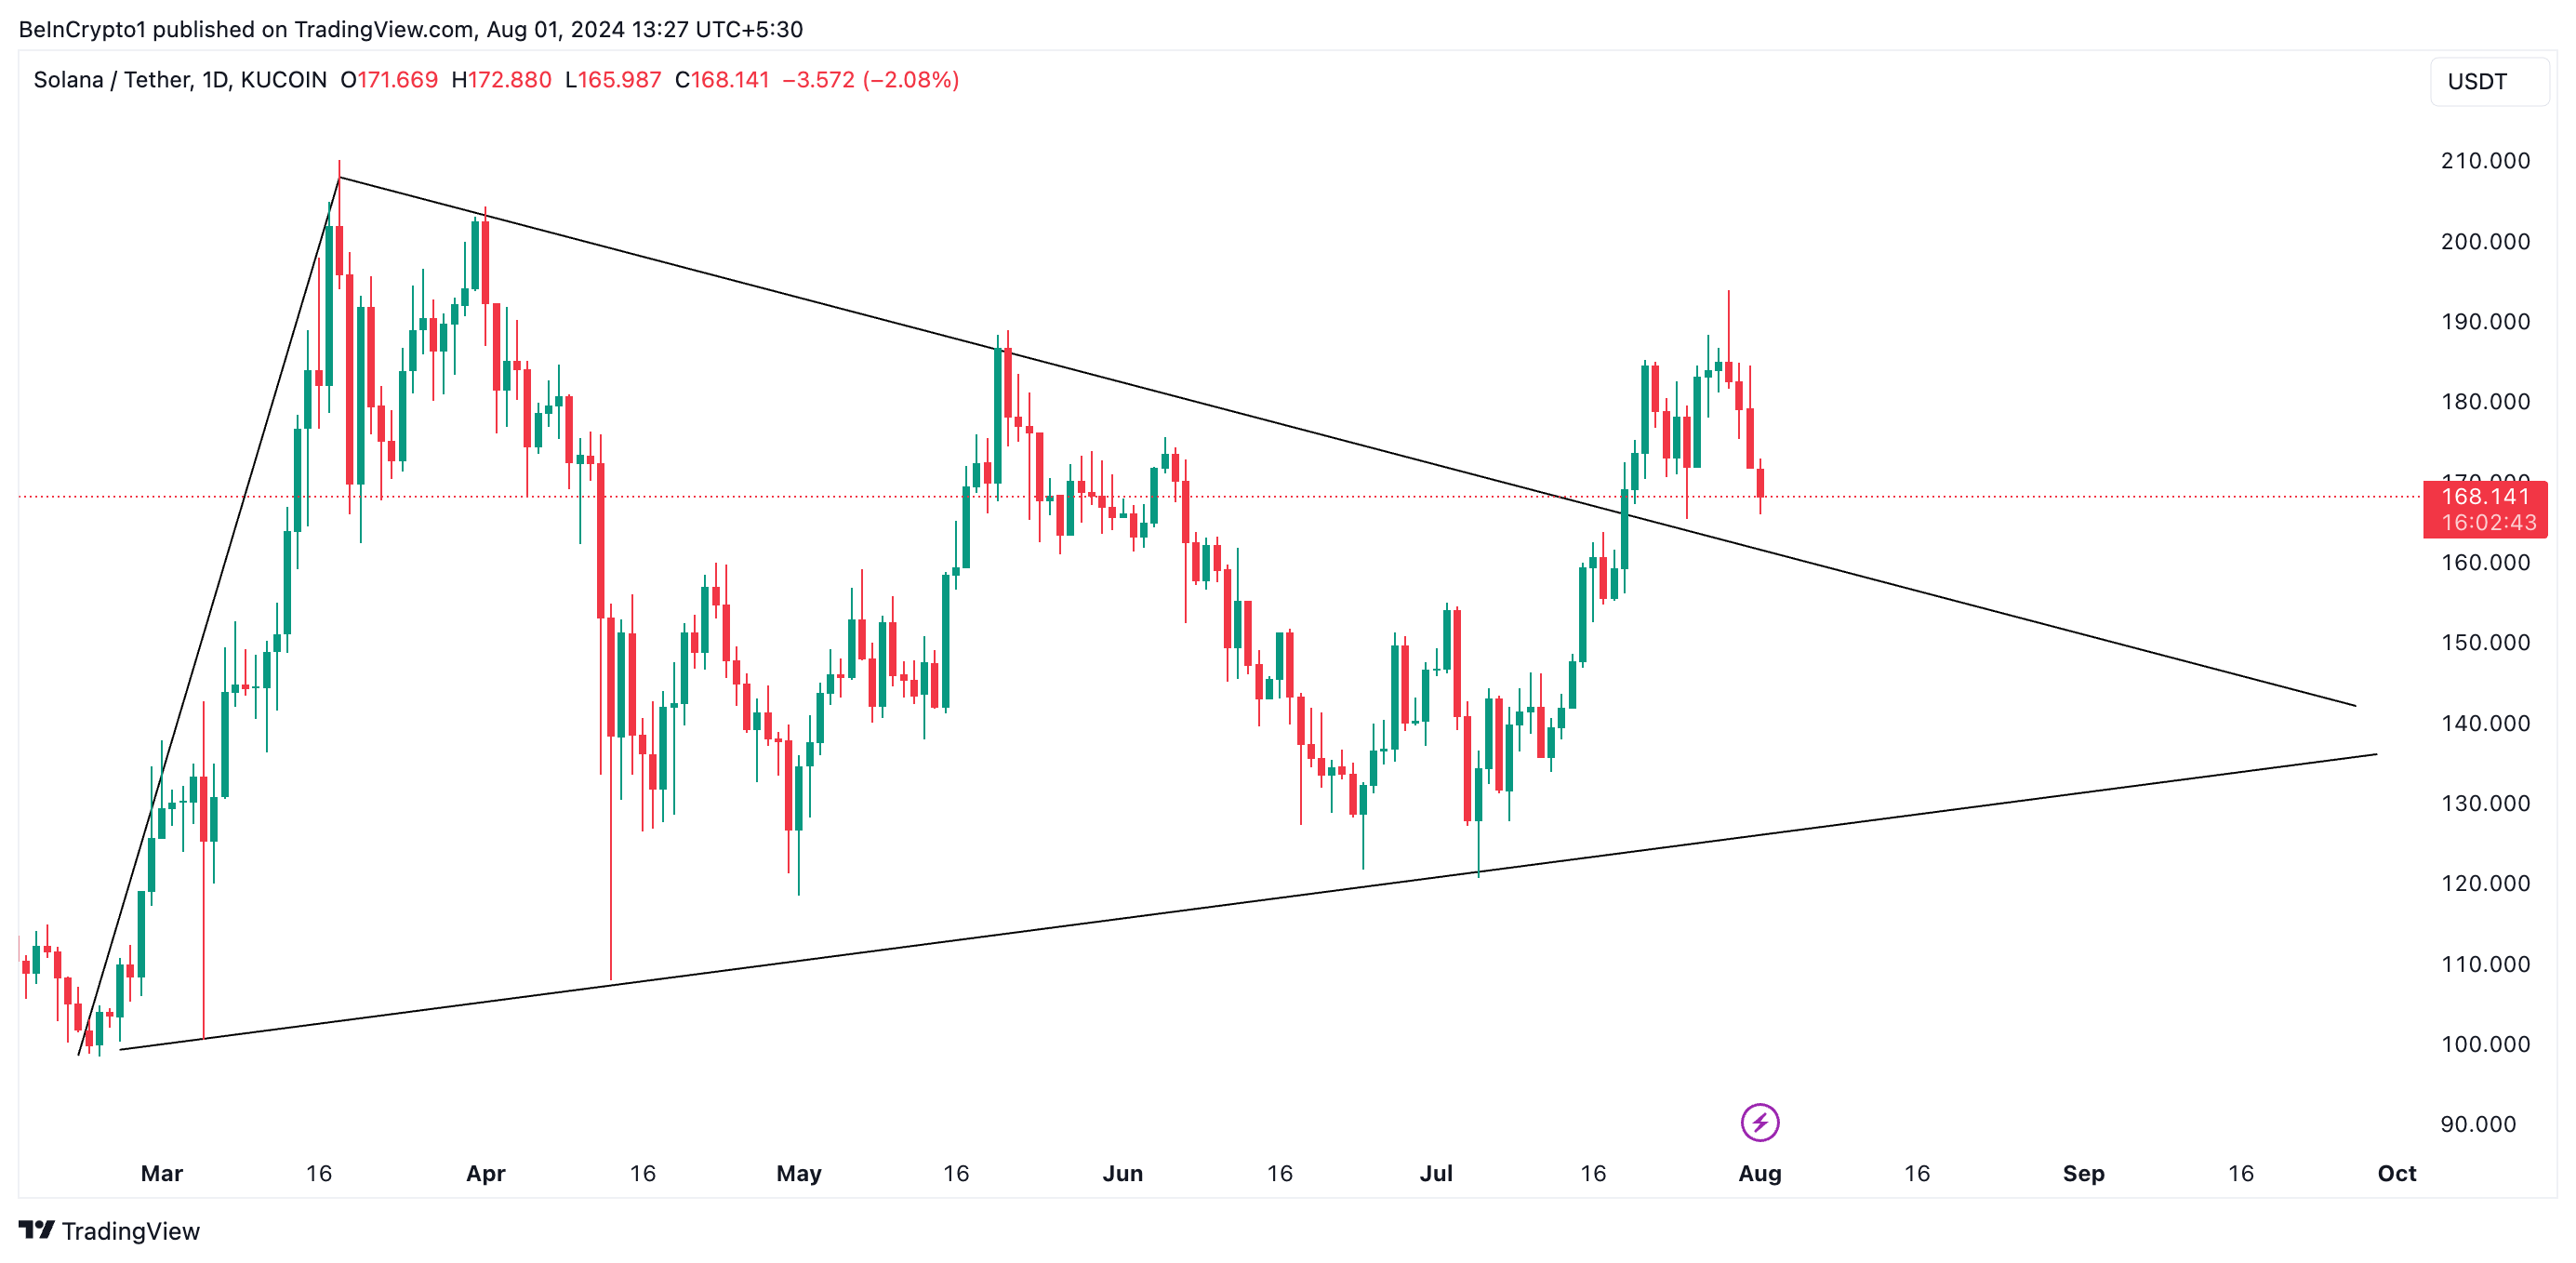
When an asset’s price breaks out of this pattern, whether upward or downward, it signals the end of the current trend and the beginning of a new one, either bearish or bullish.
SOL broke above this pattern on July 19 and continued its uptrend. However, on July 29, buyers exhaustion set in, causing its price to peak at $182.52. The coin reversed its trend and has since trended downward. At press time, SOL trades at $168.93, declining by 7% since then.
As of this writing, SOL is in a downtrend and poised to retest the breakout level. Generally, a pullback to retest the breakout line can be a healthy phase before the new uptrend resumes.
However, the initial breakout may have been a false signal, and the price is reverting back to the previous trend, which in SOL’s case would mean consolidating within a range.
In the SOL market, the bearish bias toward the altcoin is gaining momentum. For example, the dots that make up its Parabolic Stop and Reverse (SAR) indicator currently lie above its price.
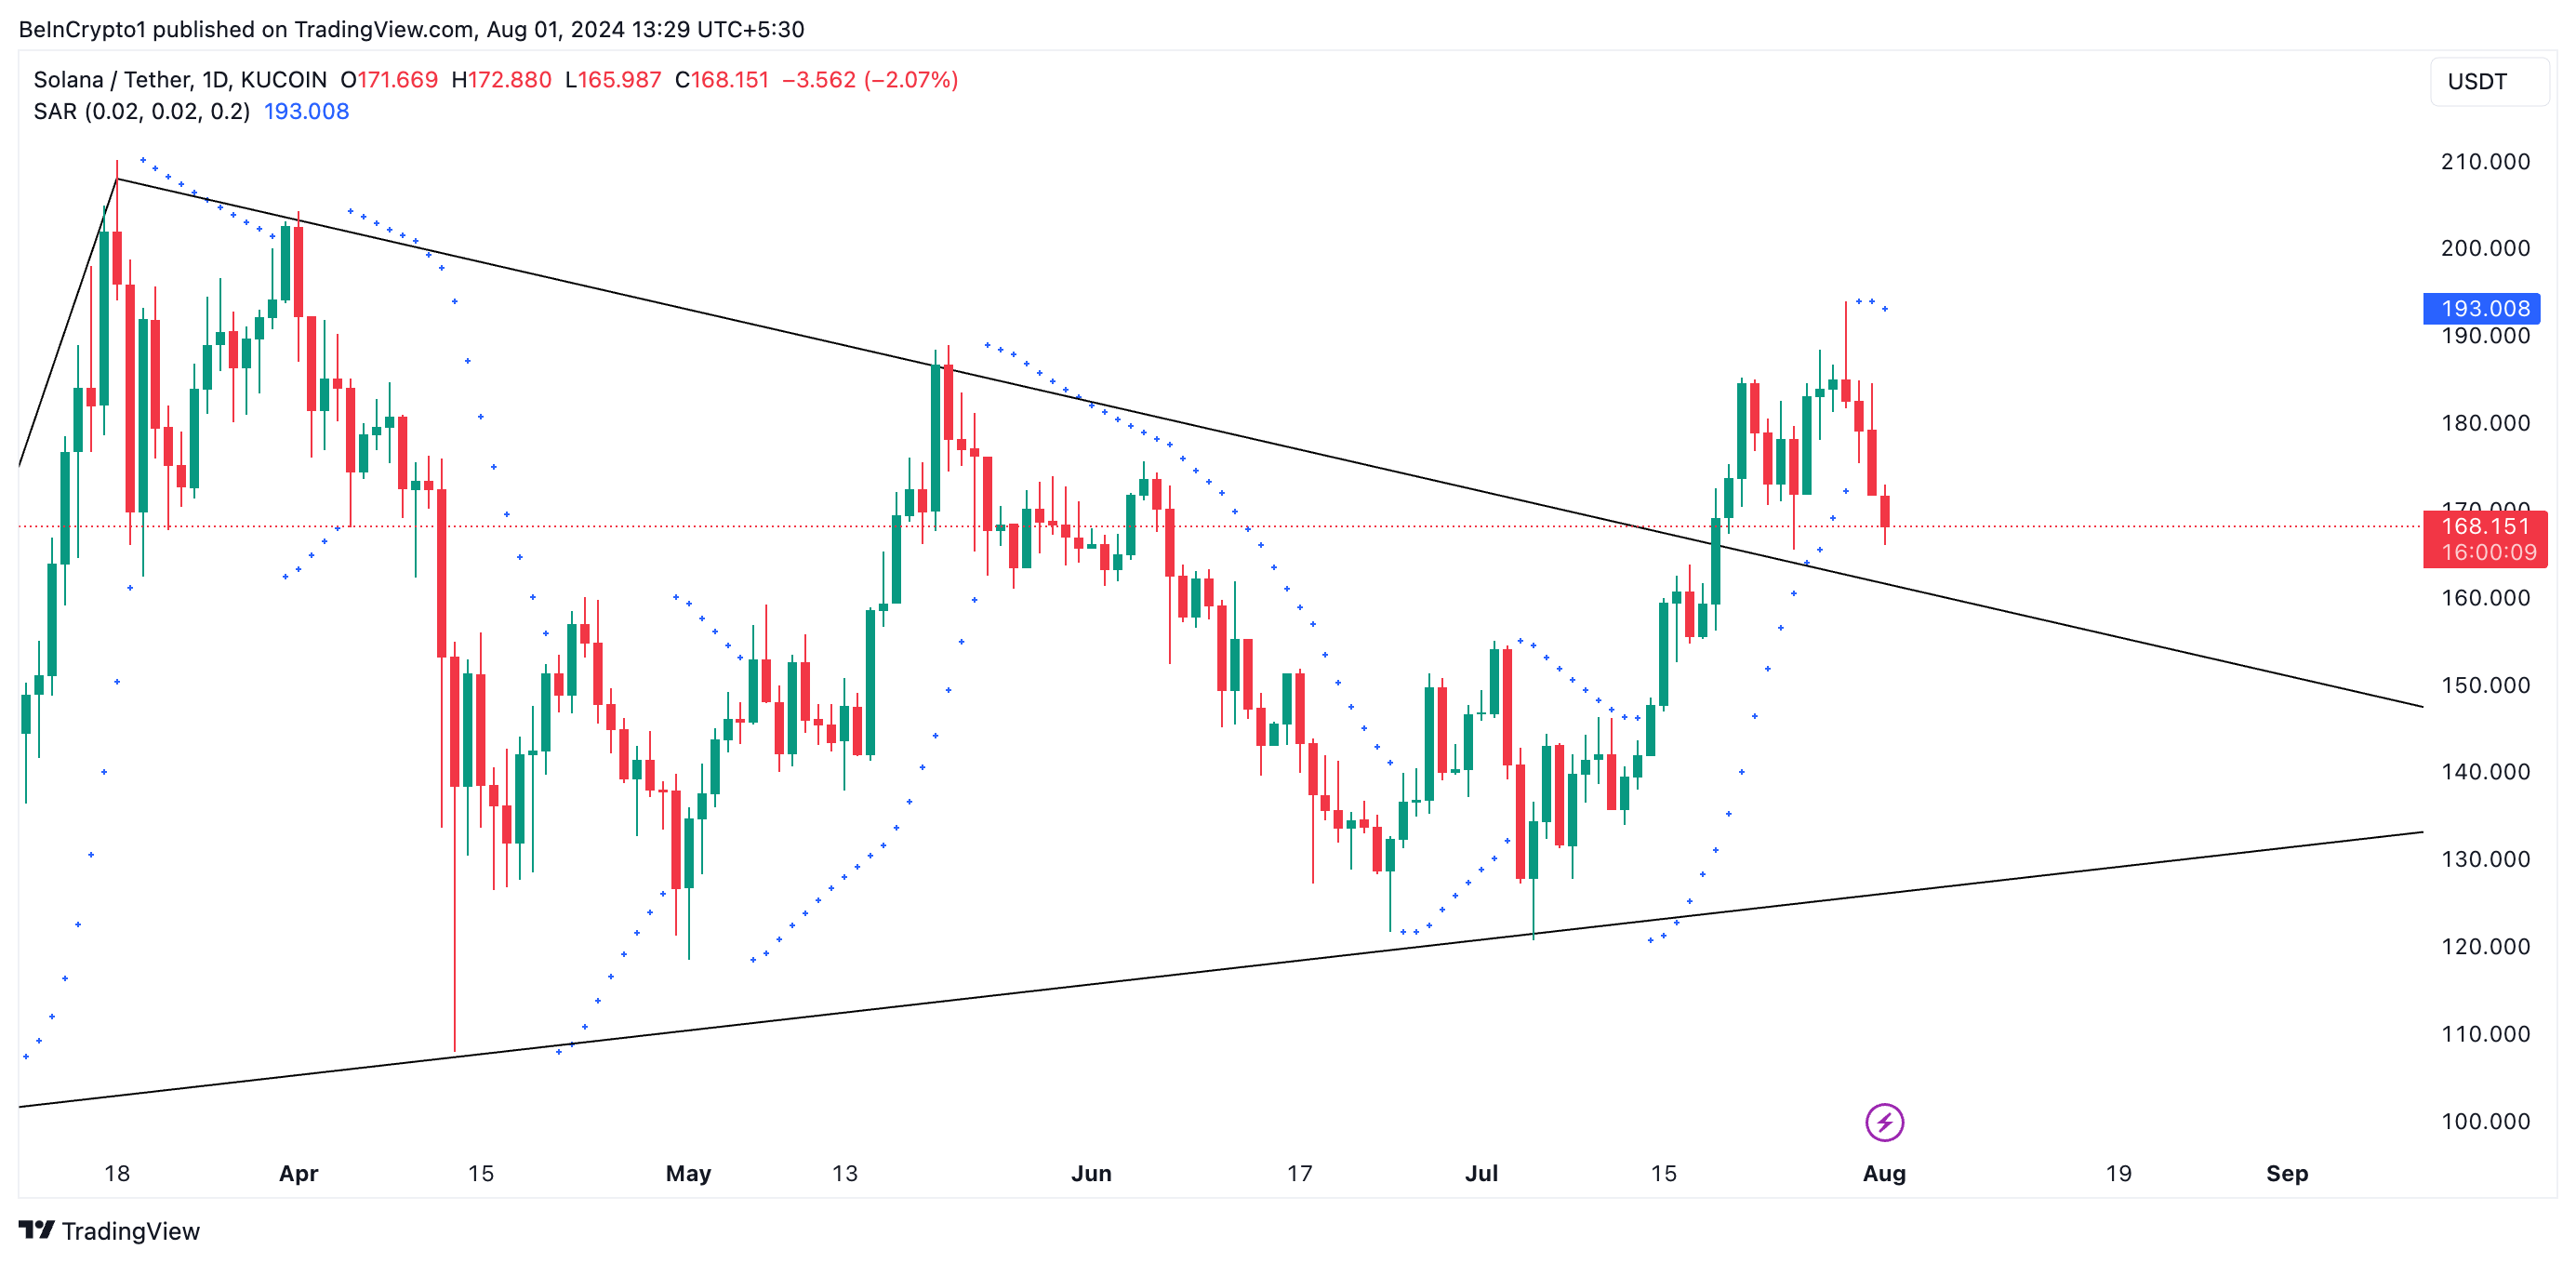
This indicator tracks an asset’s price trends and potential reversal spots. When its dots are above the asset’s price, the market is said to be in a decline. It indicates that the asset’s price has been falling, and the downtrend may continue.
Further, readings from SOL’s Chaikin Money Floe (CMF) reveal a decrease in liquidity inflow into the market. The indicator measures the flow of money into and out of the market.
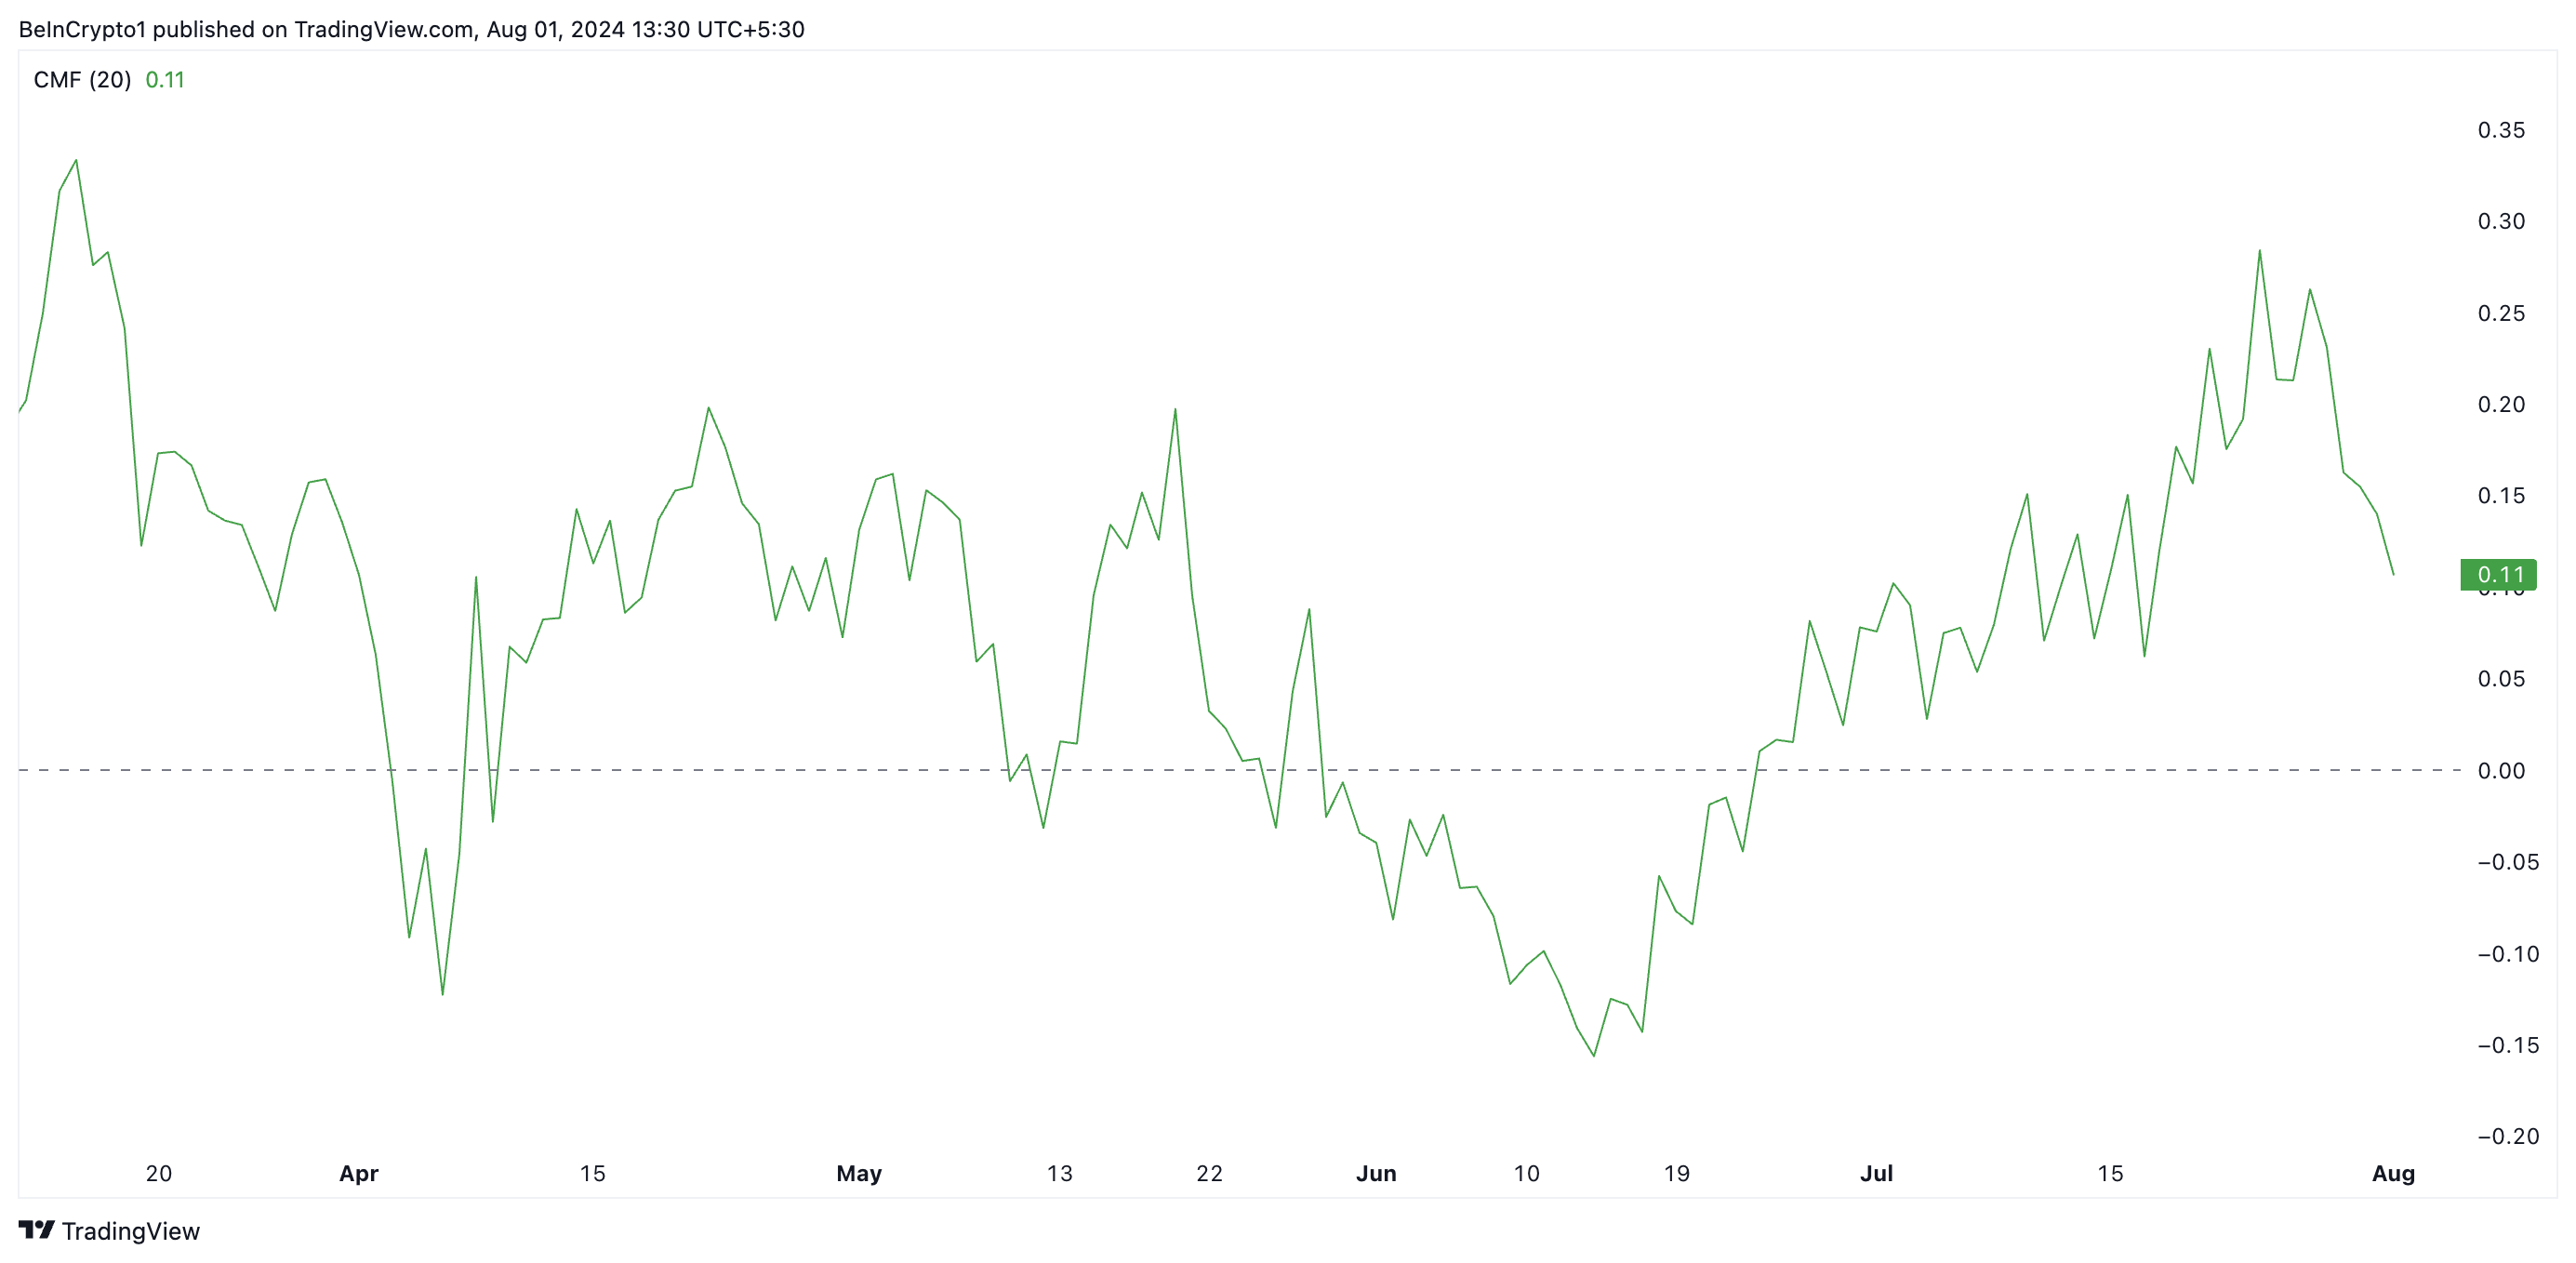
When it starts to fall, it means there is less capital inflow, a notable precursor to a sustained price decline.
SOL Price Prediction: A Rally Above $200 in the Books if Retest Is Successful
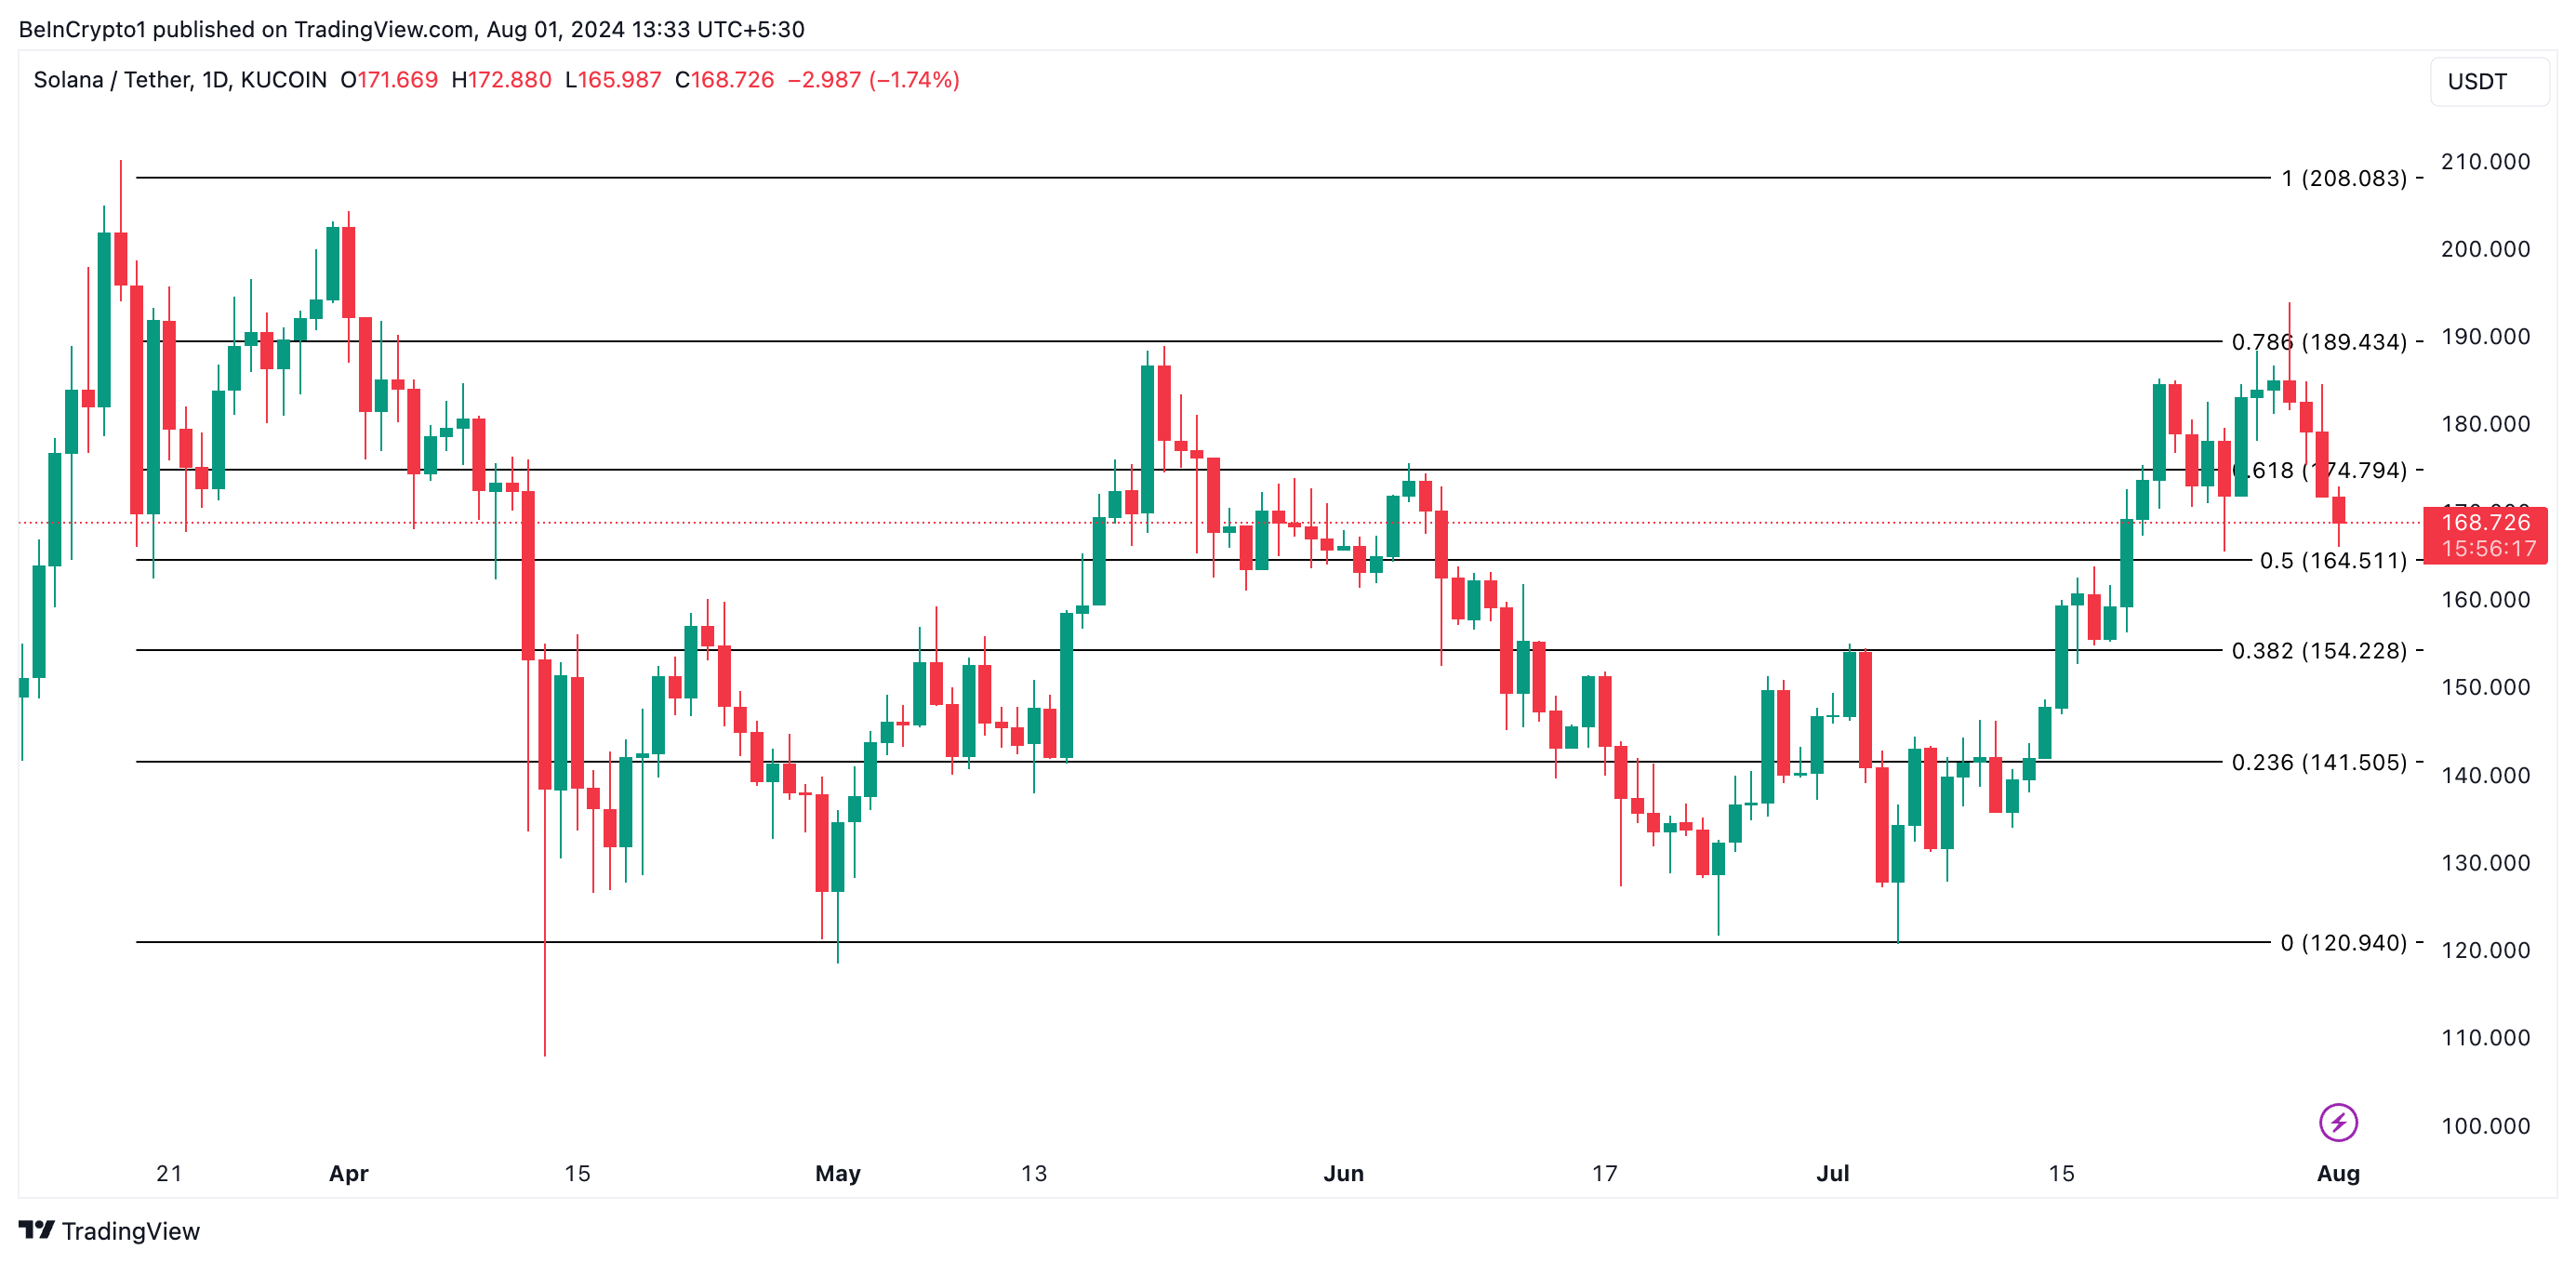
If the downtrend persists, SOL’s price may fall below the breakout level and resume trending within the symmetrical triangle pattern. SOL’s next price target would be $154.22 if this happens.
However, analysts have opined that a rally in SOL’s price is imminent. Brian Quinlivan, Lead Analyst at Santiment, told BeinCrypto that the coin’s current muted price performance might be related to its significantly positive correlation with Bitcoin (BTC), which has only increased by 1% over the past week.
Solana’s discussion rate has surprisingly been fairly neutral, even during its big rally between July 4th and July 27th. The lack of FOMO could indicate a further rally is in store once Bitcoin gets its legs and shows a minor bounce itself once again, Quinlivan noted.
If the coin successfully retests the breakout line and resumes its uptrend, its price may climb toward $200.
