


Solana (SOL) has presented a buying opportunity for those looking to trade against the market trend.
However, its technical setup suggests that any coin acquired at current prices might suffer a brief devaluation. This is because SOL bears do not appear ready to relinquish control.
SOL’s Buy Signal, But There Is a Catch
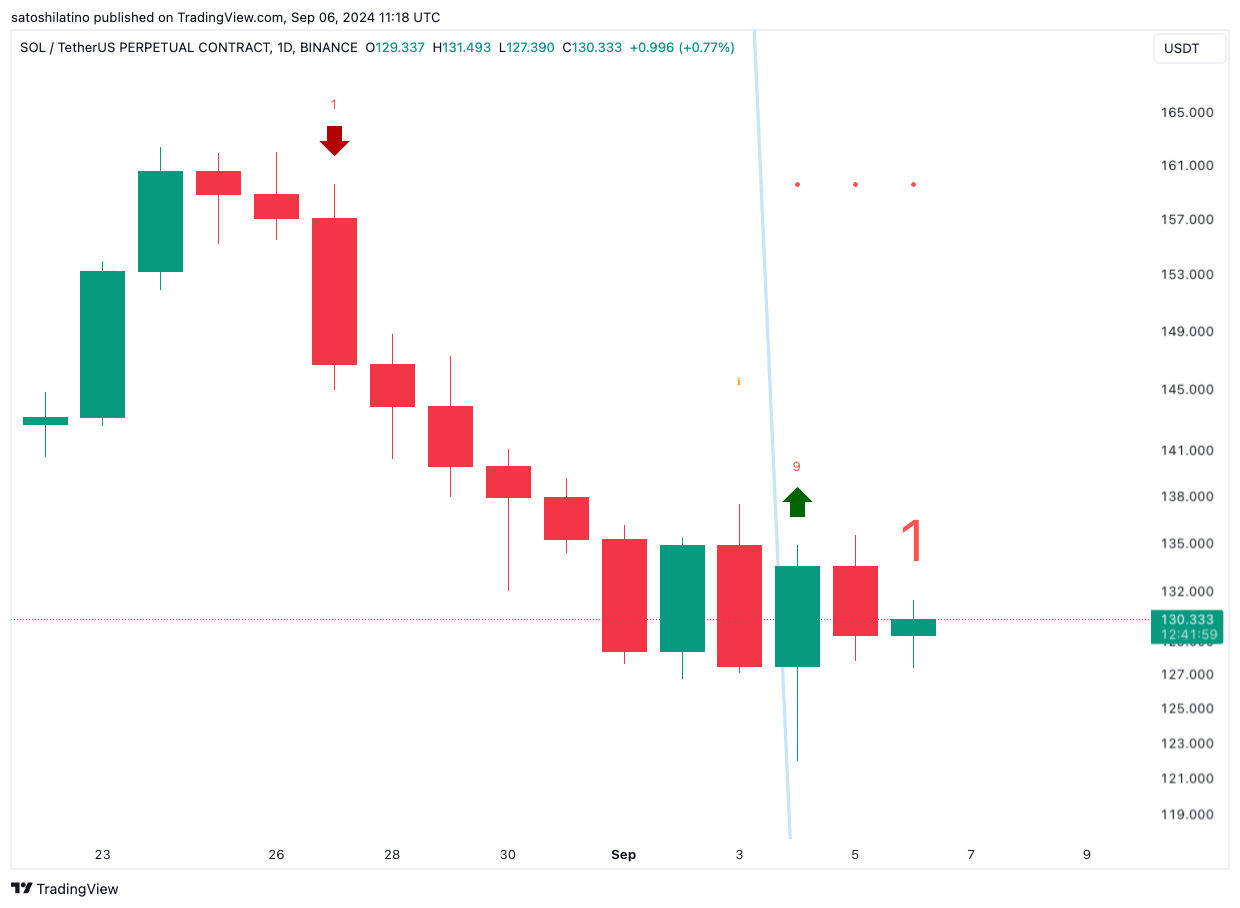
The Tom DeMark Sequential indicator on the daily chart reveals a buy signal, suggesting Solana may witness a rebound if accumulation gains momentum.
The indicator measures the time of an asset’s trend exhaustion and identifies potential price reversal points. It does this by tracking the price action over a series of nine candlesticks. A buy signal is generated when the indicator reaches nine on a downtrend.
Although this presents a bullish opportunity for those who have been waiting to buy Solana at a low and sell high, other key indicators hint at the possibility of a further decline in the coin’s value.
Read more: How to Buy Solana (SOL) and Everything You Need To Know
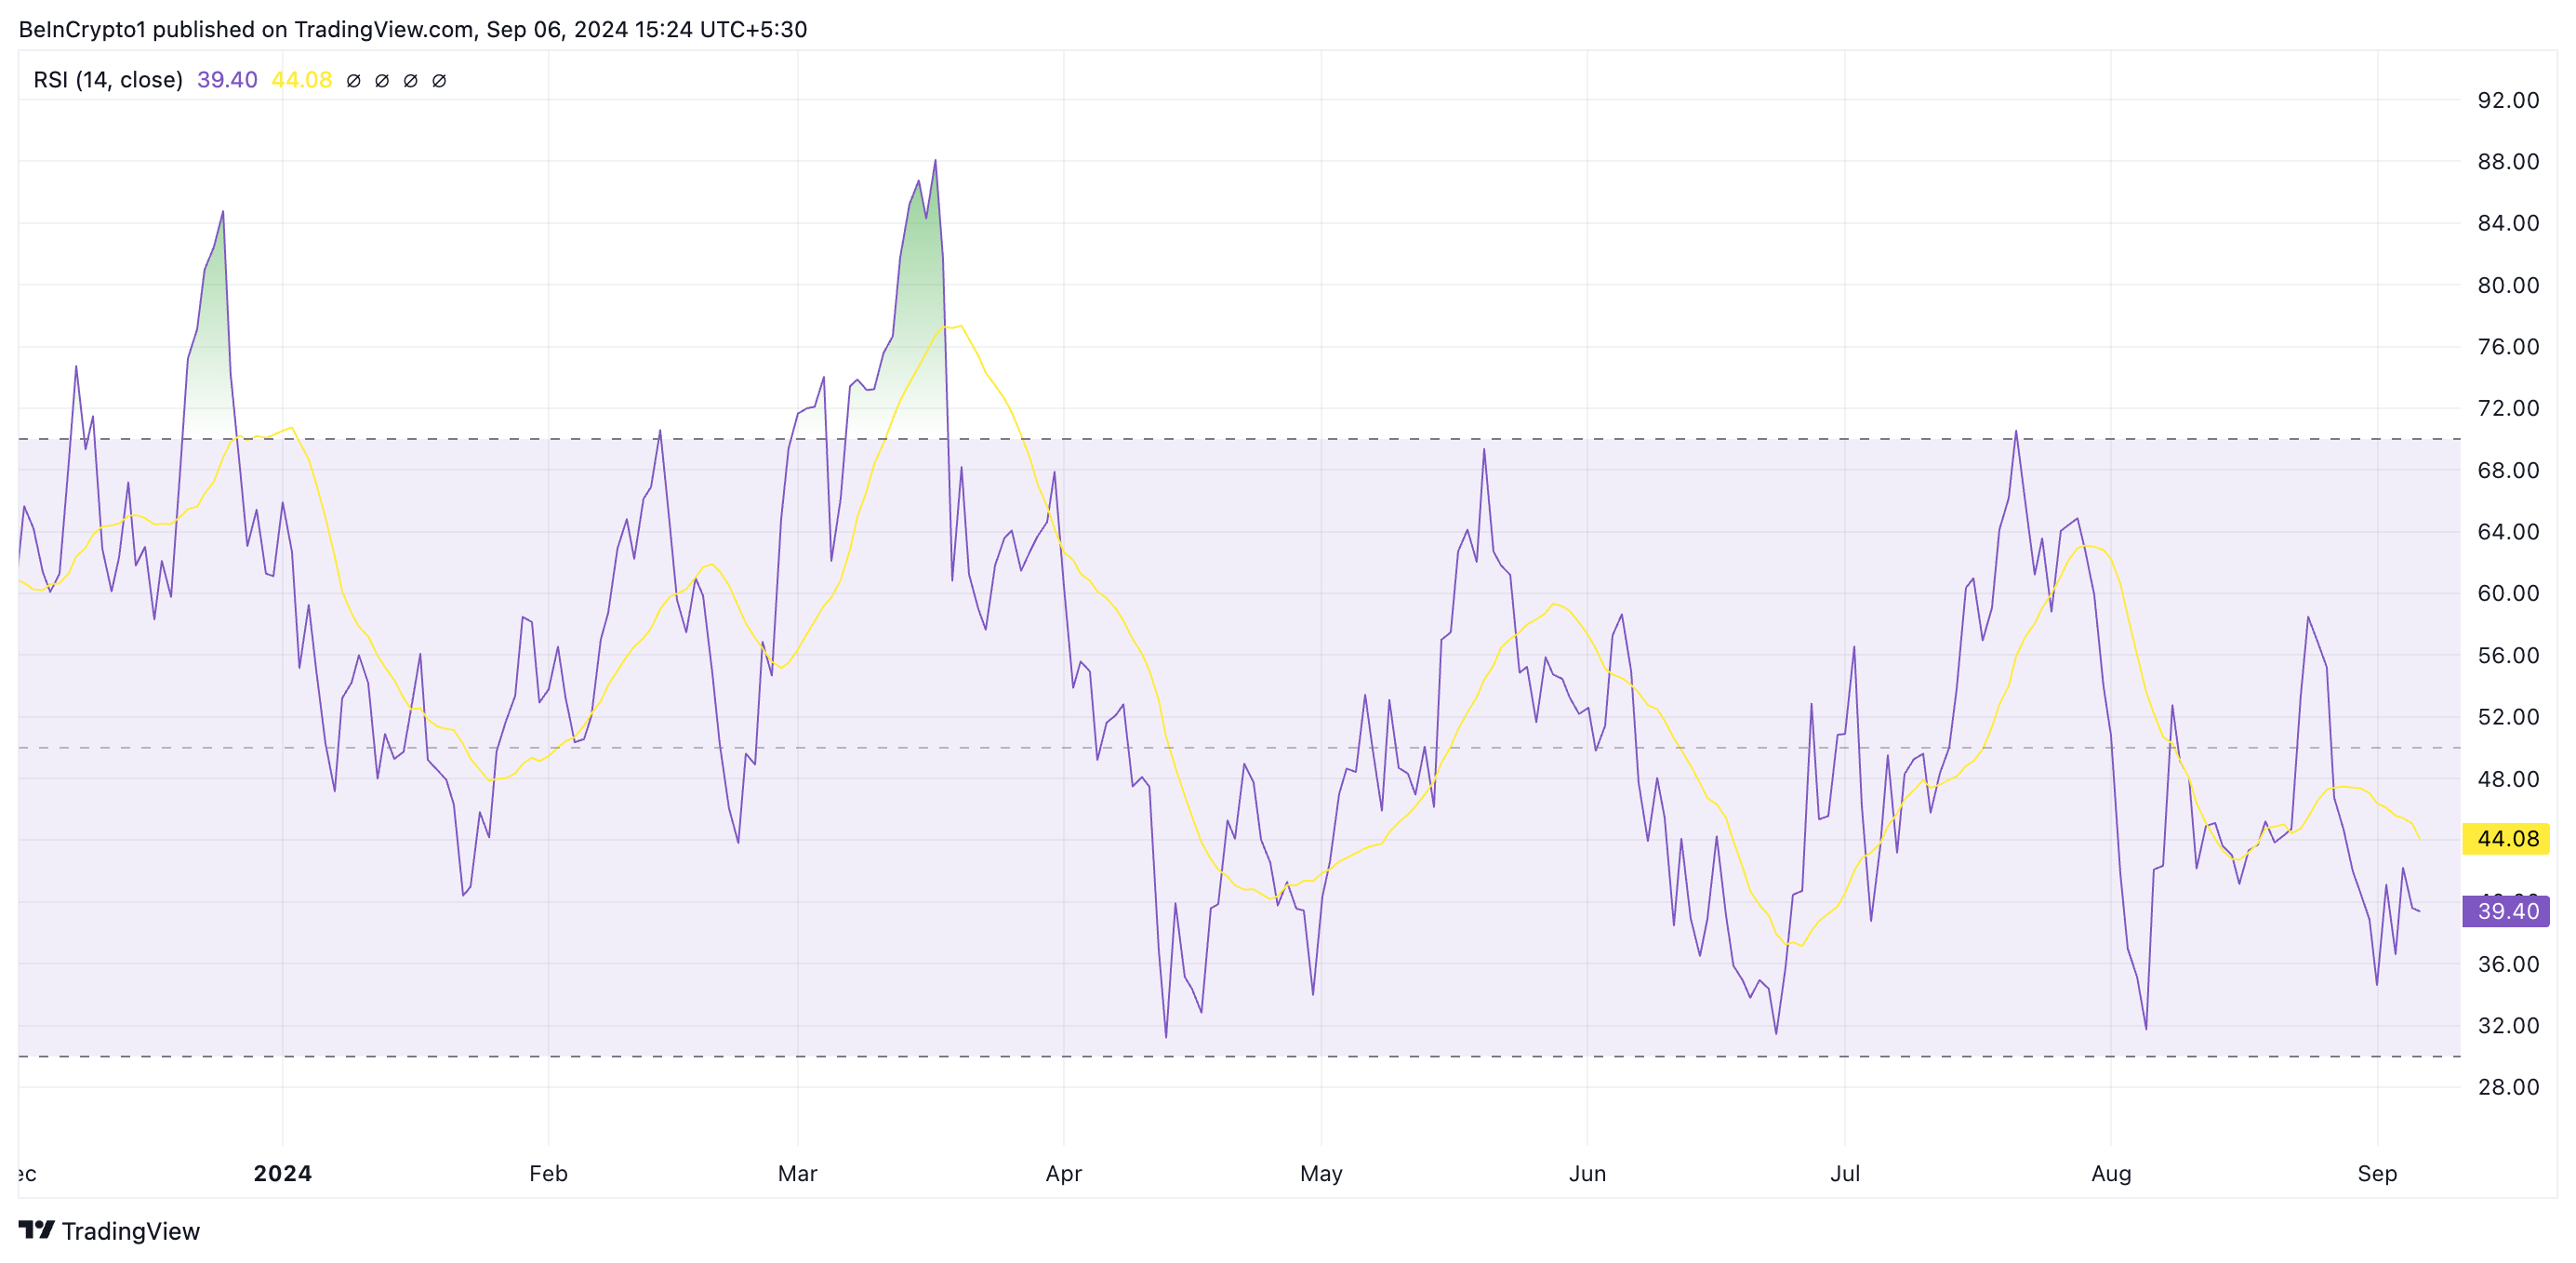
For example, general buying pressure in the market is too weak to sustain a rally, as evidenced by its Relative Strength Index (RSI). This indicator, which measures SOL’s overbought and oversold market conditions, is at 39.07 as of this writing.
It indicates that many market participants prefer to sell their Solana holdings over accumulating new coins.
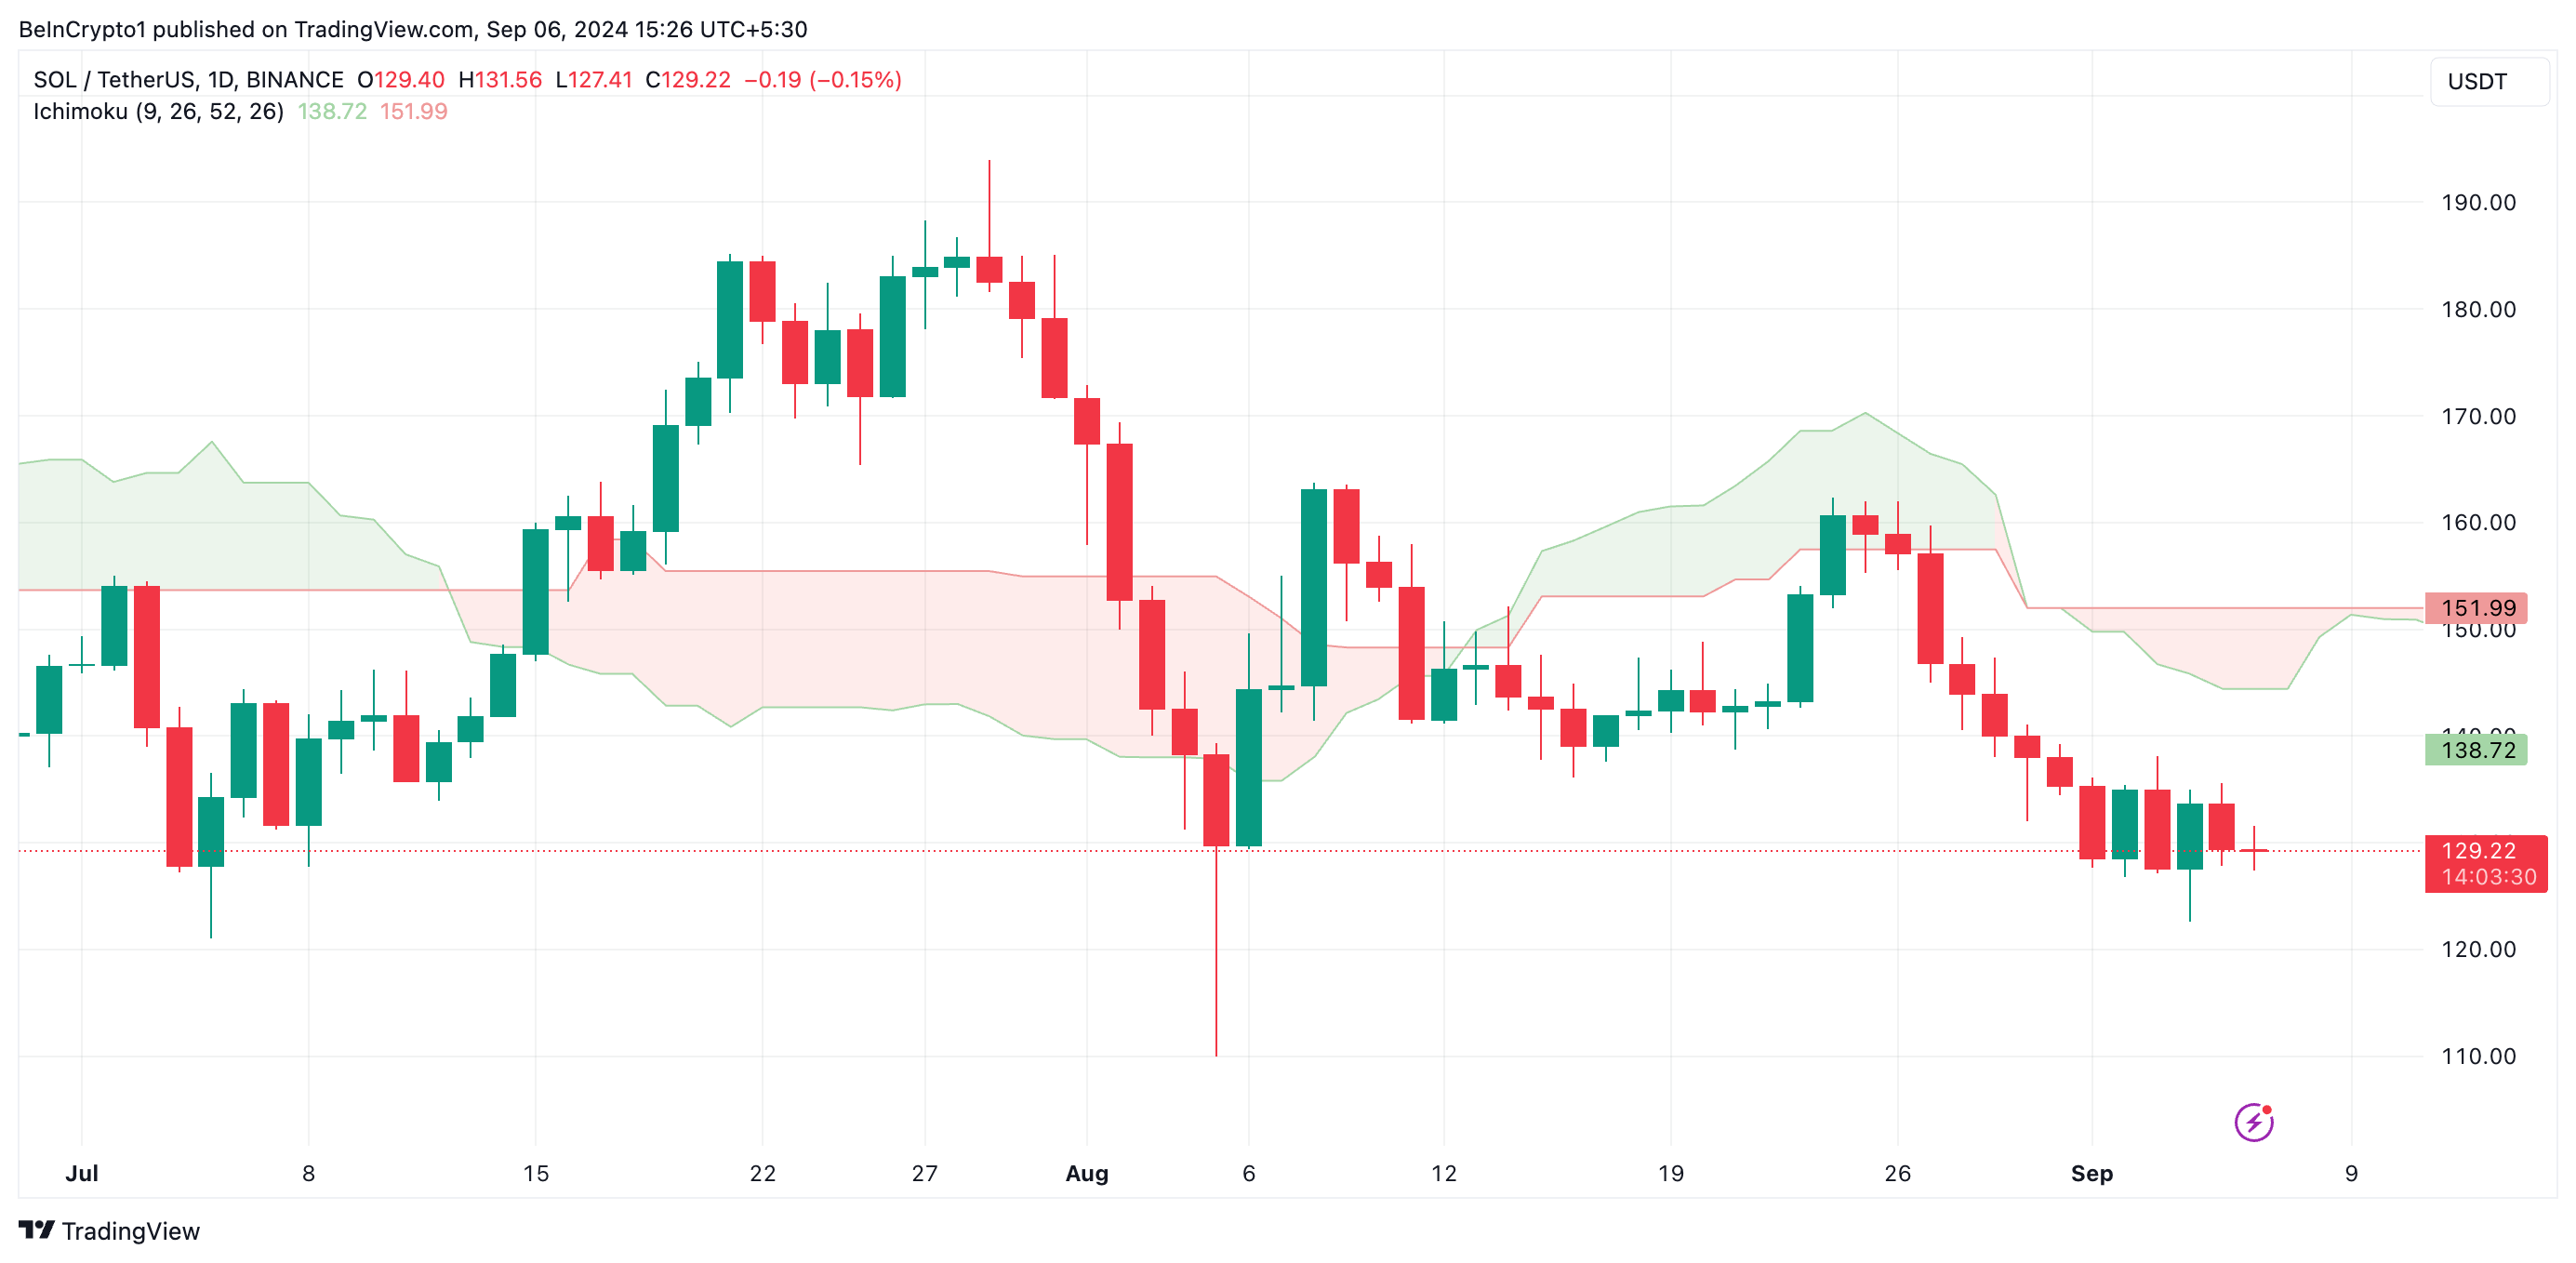
Additionally, the coin’s price continues to trend further from the Leading Span A and B of its Ichimoku Cloud, which now forms critical resistance levels.
The Ichimoku Cloud indicator identifies trends, support and resistance levels, and potential market reversal points. When an asset’s price trades below the cloud, it is under significant resistance. This indicates that the market is in a bearish condition and that the downtrend may continue.
Solana Price Prediction: Time to Watch
Mosy Alpha, a crypto trader and analyst on X, has shared an optimistic projection for Solana ahead of the Breakpoint conference on September 20-21. He notes that historically, SOL’s price tends to perform well during this event.
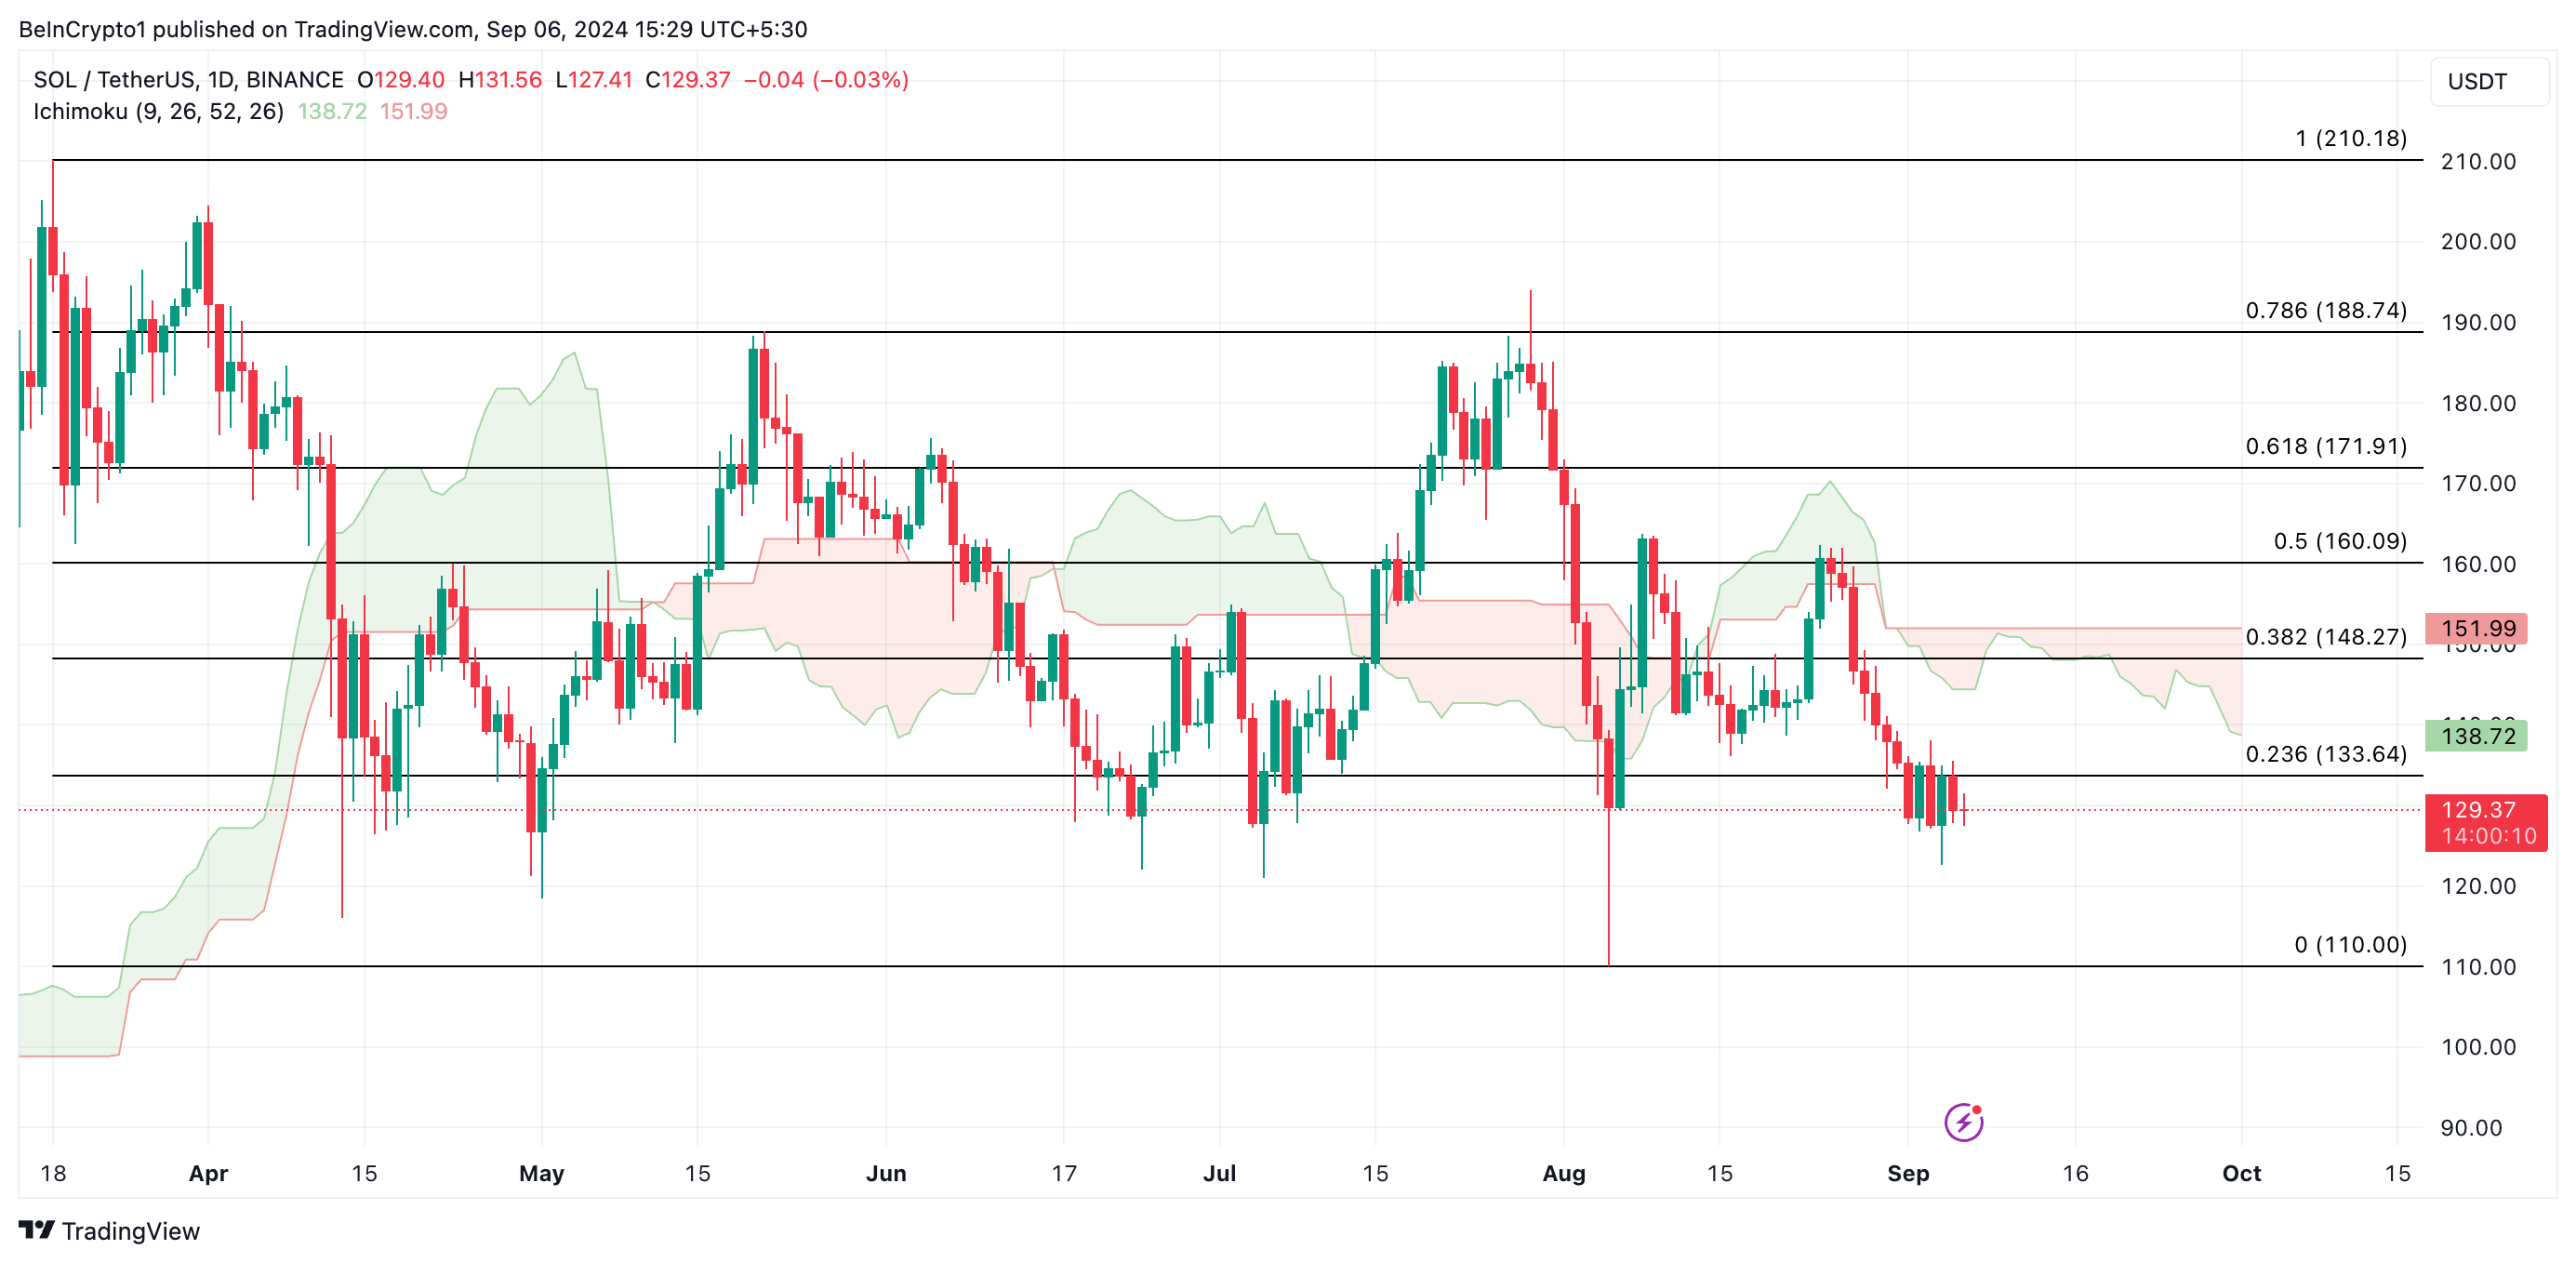
If traders heed the buy signal in preparation for this, it may push SOL’s price past the resistance formed by the Ichimoku Cloud to trade at $171.91.
Read more: Solana (SOL) Price Prediction 2024/2025/2030
However, Mosy emphasizes that the outcome will depend on “the market’s liquidity and marginal capital, as well as whether Solana Breakpoint can surpass market expectations.” Therefore, if traders fail to supply the market with enough liquidity, the bullish projection will be invalidated.
If this is the case, a sustained close below $126 could trigger a correction toward the August 5 low of $110, and if this level fails, the losses may extend to $90.


