


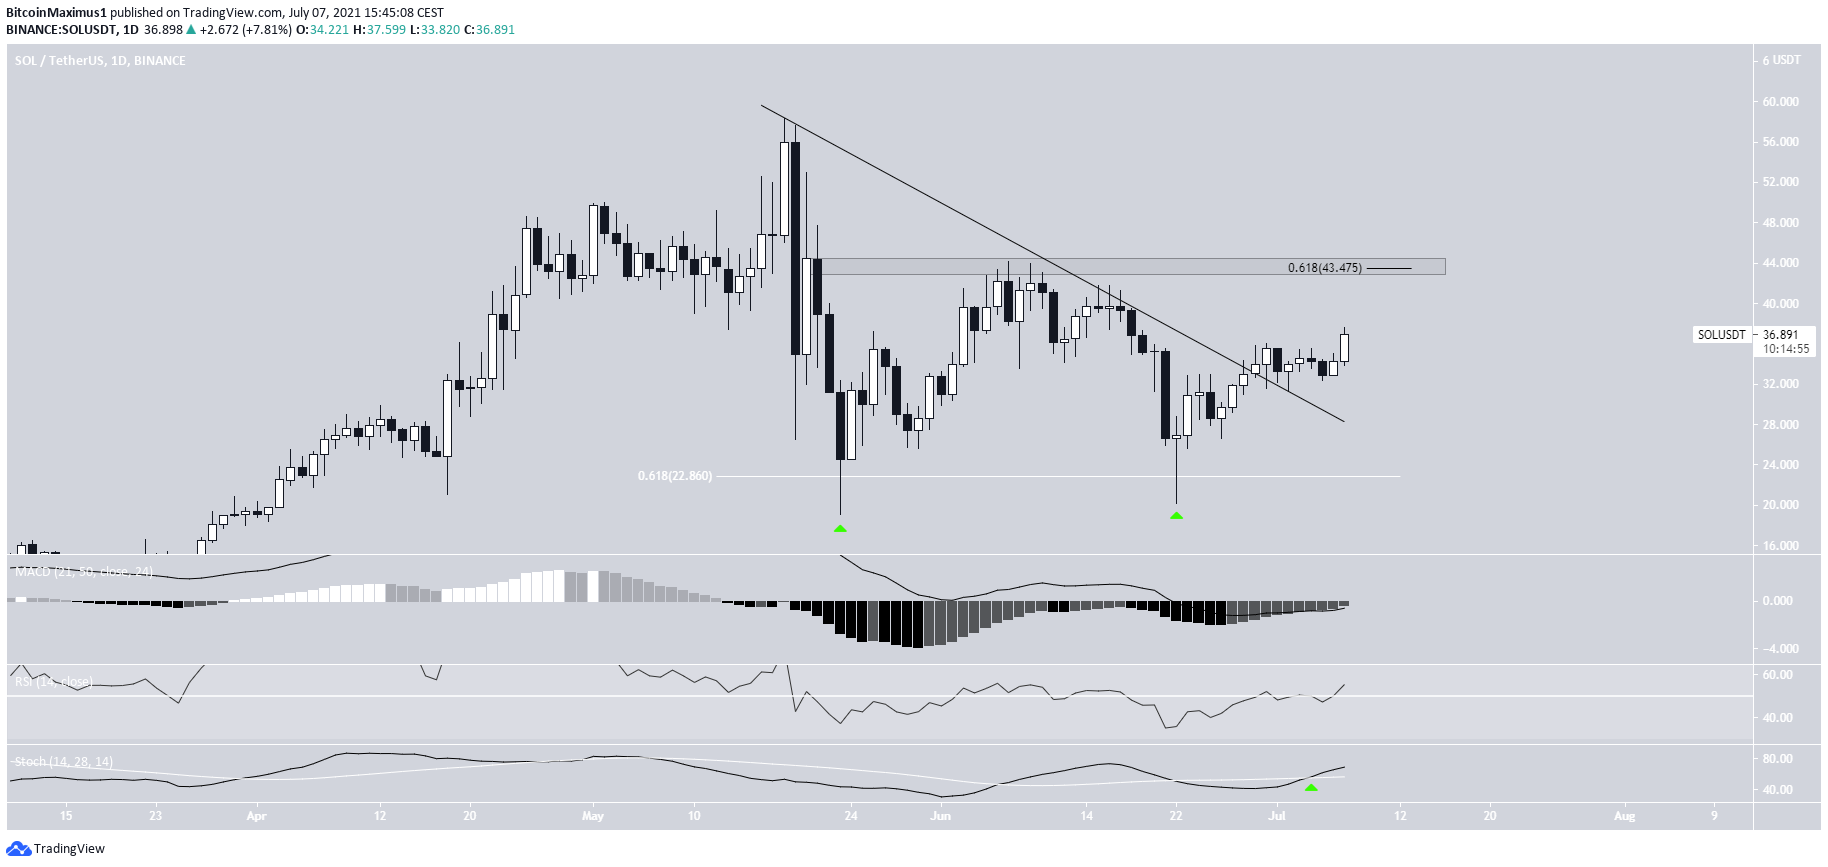
Solana (SOL) created a double bottom pattern on May 23 & June 22 and proceeded to break out from a descending resistance line afterwards.
While the direction of the longer-term trend is still uncertain, an upward movement towards $43.5 seems likely.
SOL breaks out
Since reaching a high of $58.38 on May 18, SOL initiated a downward movement alongside a descending resistance line.
The movement culminated with a low of $19.11, reached on May 23. After a bounce, the token returned to this level on June 22 and created a double bottom pattern. Both lows were accompanied by long lower wicks (green icon).
Afterwards, SOL managed to break out from the aforementioned line on June 19.
Technical indicators are bullish, supporting the continuation of the upward movement. The Stochastic oscillator has made a bullish cross, the RSI has moved above 50 and the MACD is nearly positive.
The closest resistance is at $43.50, the 0.618 Fib retracement resistance level.
Wave count
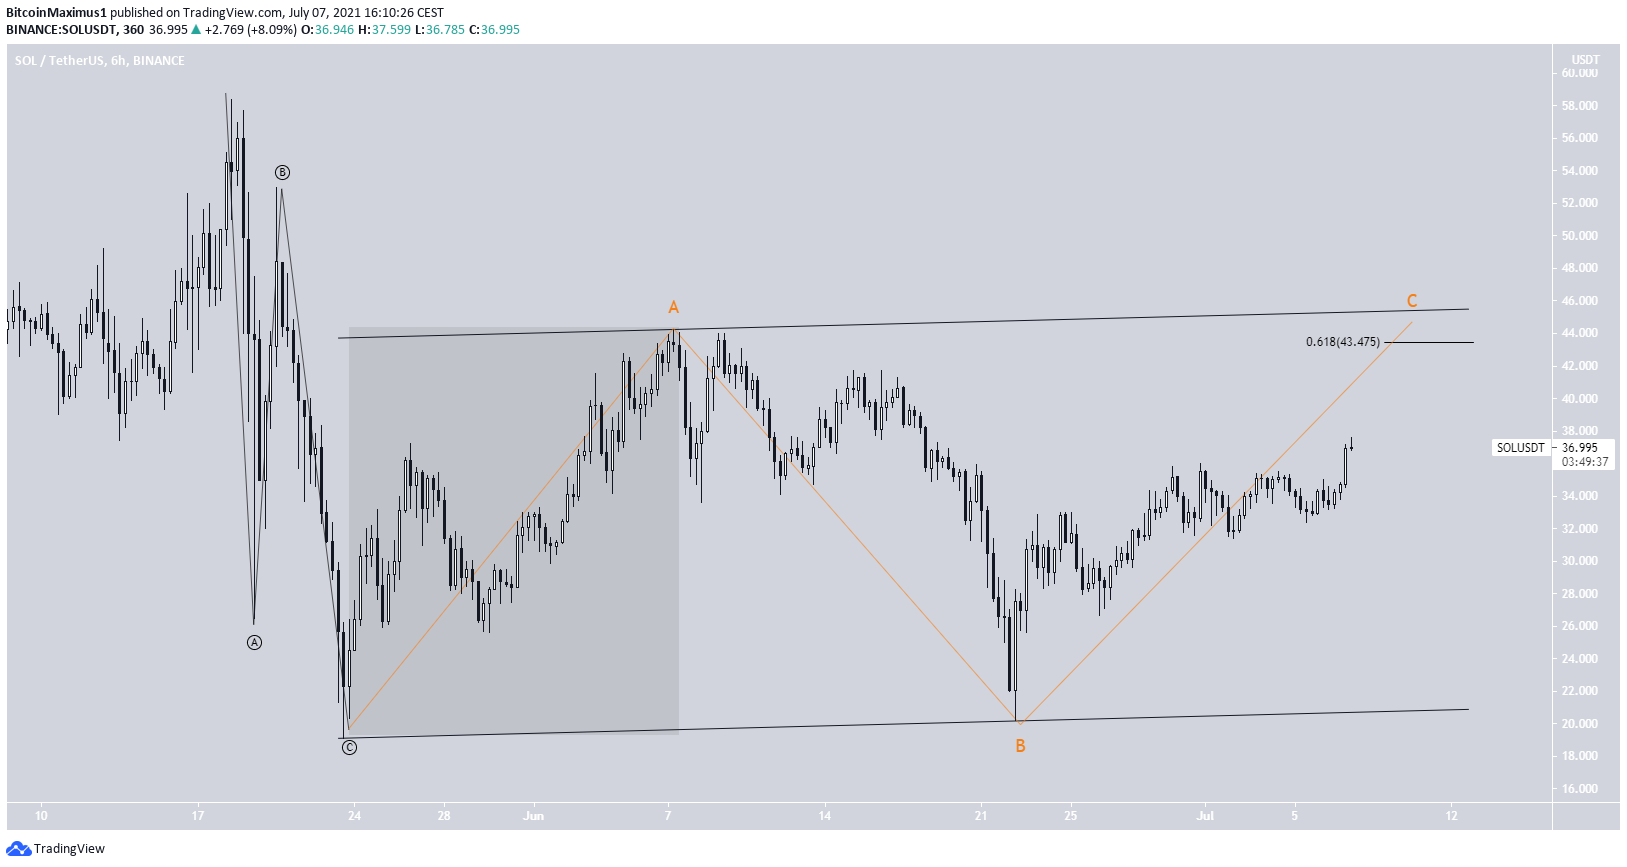
The downward movement from the aforementioned May 18 high is a three wave structure (black, meaning that it is corrective).
The ensuing bounce also looks like a three wave structure (highlighted). Therefore, it is likely the A wave of an A-B-C corrective structure (orange). This would take SOL towards the previously outlined resistance near $43.5.
However, it is possible that the movement is some type of diagonal instead, which would lead to new all-time highs. Therefore, the reaction at $43.5 will be crucial in determining the future trend.
SOL/BTC
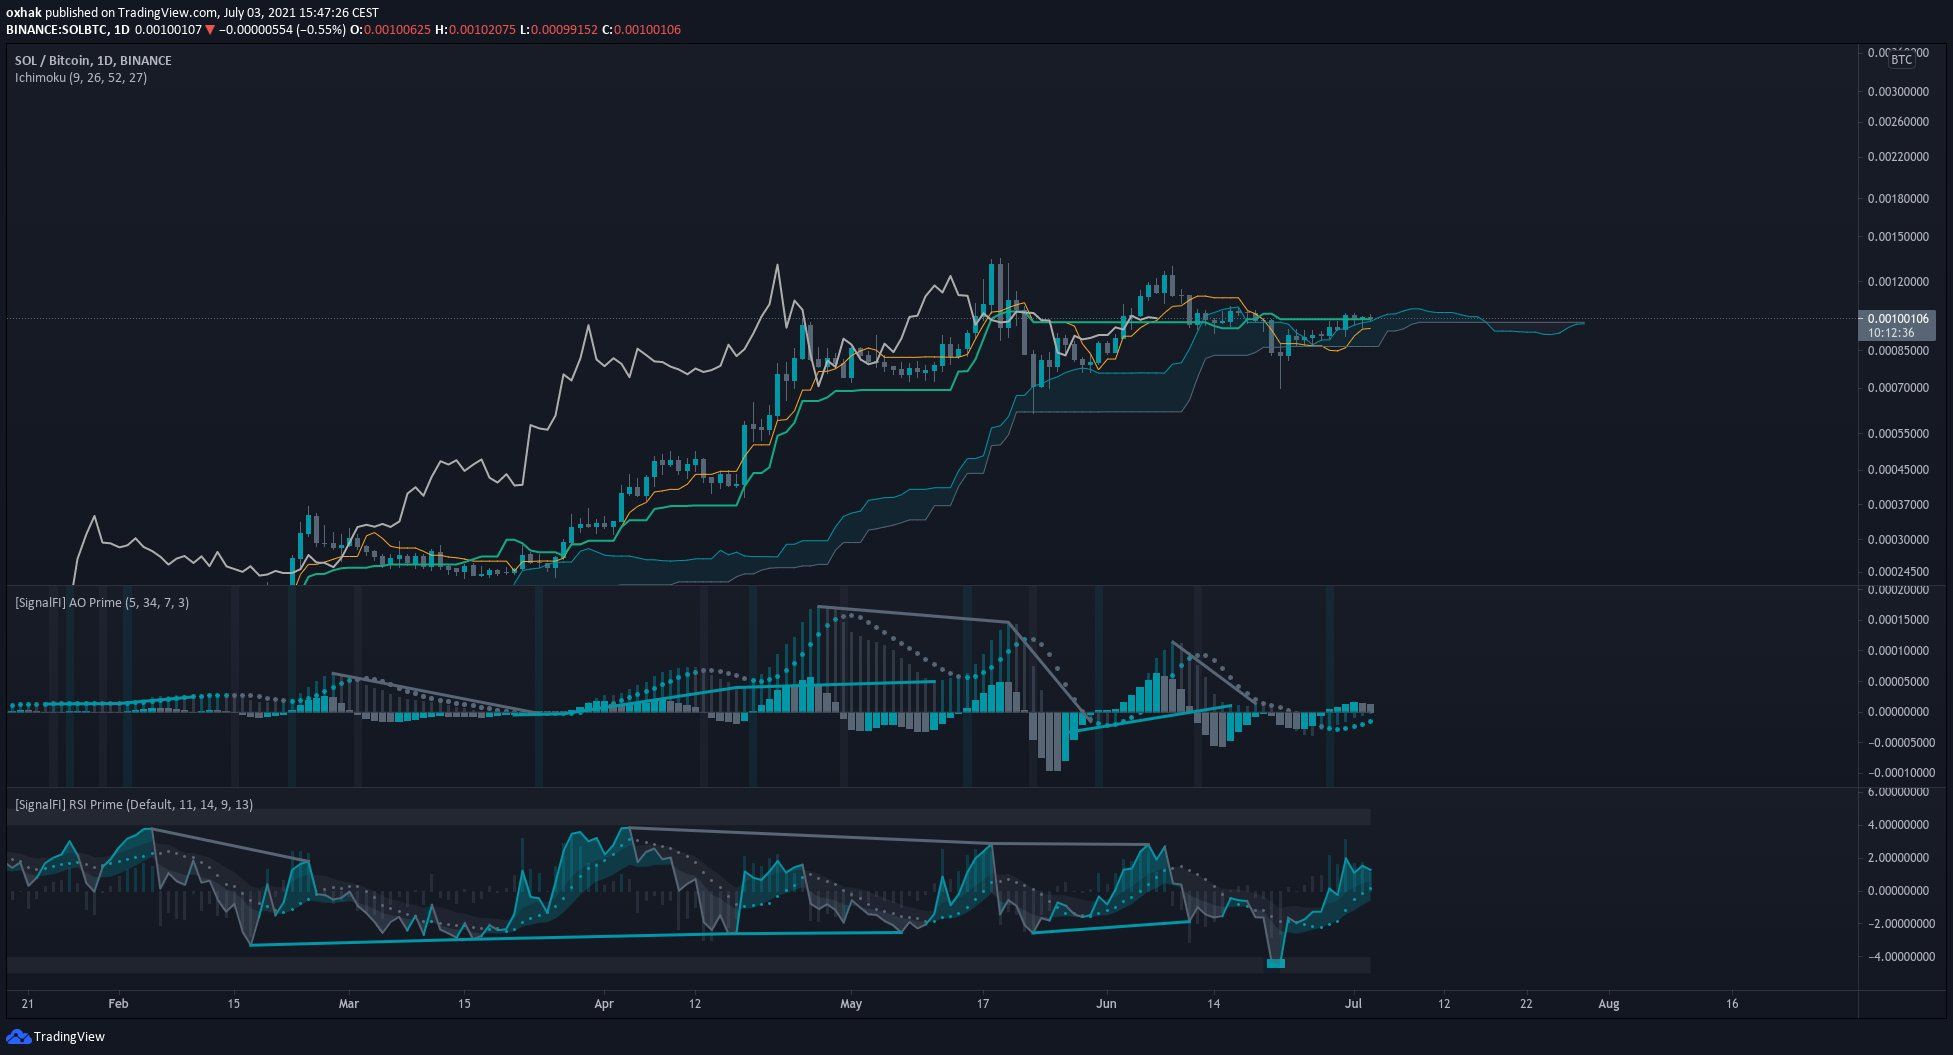
Cryptocurrency trader @oxhak tweeted out a SOL/BTC chart, stating that it could soon break out.
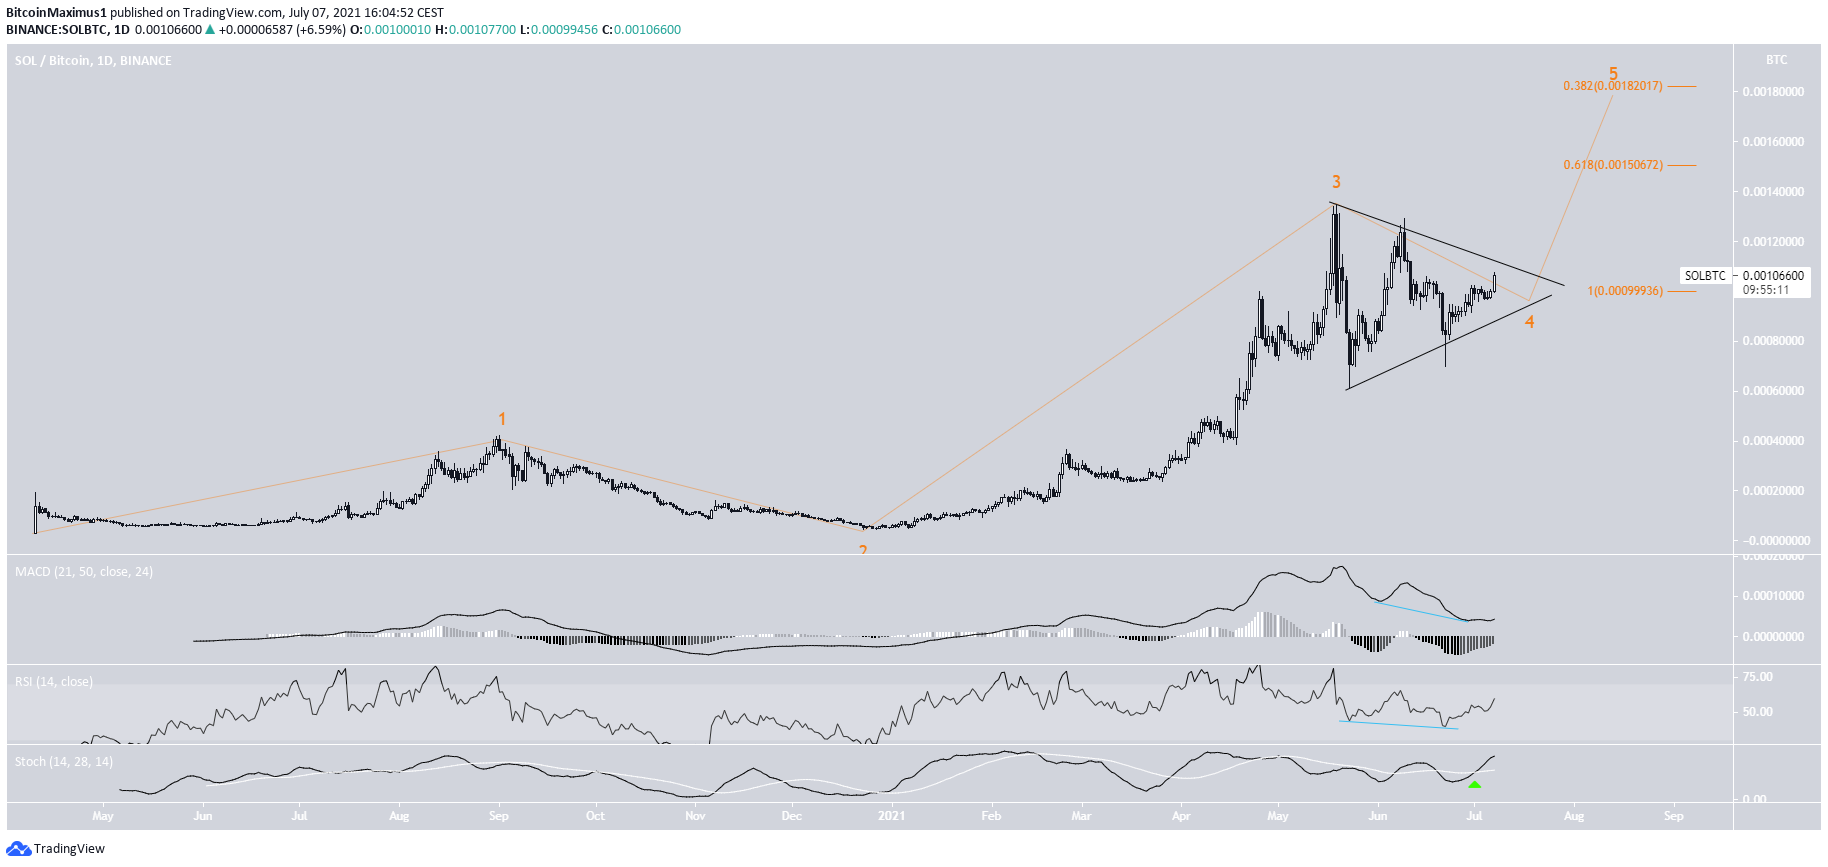
SOL/BTC has been moving downwards since May 19, when it reached a high of ₿0.00135. It is likely that the token is in wave four, which has taken the shape of a symmetrical triangle.
Technical indicators are decisively bullish. Both the RSI & MACD signal line have generated considerable hidden bullish divergence. In addition to this, the RSI has moved above 50 and the Stochastic oscillator has made a bullish cross.
The most likely targets for the top of the upward movement are at ₿0.0016 and ₿0.00182. However, the targets depend on the actual bottom of wave four. The targets are found using a Fib projection on waves 1-3.
For BeInCrypto’s latest bitcoin (BTC) analysis, click here.



 Bitrue