


Solana (SOL) has been increasing since bouncing on May 19.
However, it has broken down from the trendline of its upward movement and is showing several bearish signs.
Ongoing SOL bounce
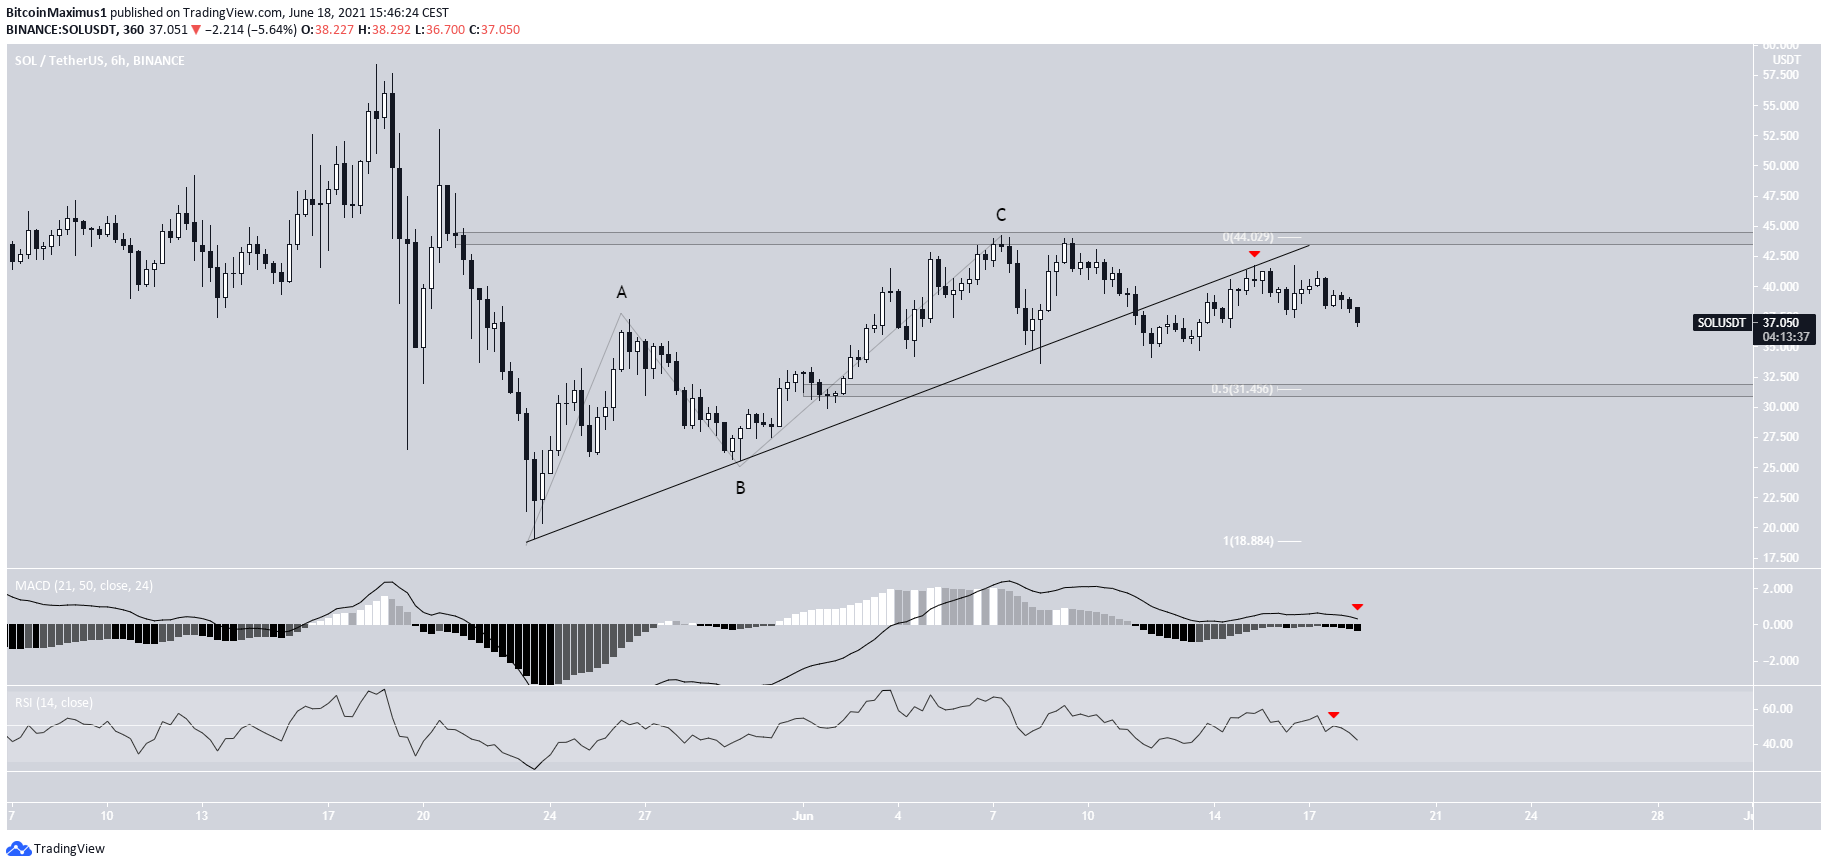
SOL has been increasing since bouncing on May 19. The upward movement continued until a high of $44.2 was reached on June 7. The high coincided with the 0.618 Fib retracement resistance level (black).
While the token has been decreasing since, it has managed to hold on above the $36 support level, This area previously acted as resistance on May 26.
Despite being above support, technical indicators are gradually turning bearish. The RSI is in the process of crossing below 50 and the MACD is almost negative.

Current breakdown
Cryptocurrency trader @Altcoinsherpa outlined a SOL chart, stating that until the token moves outside the current range, the direction of the trend cannot be determined.
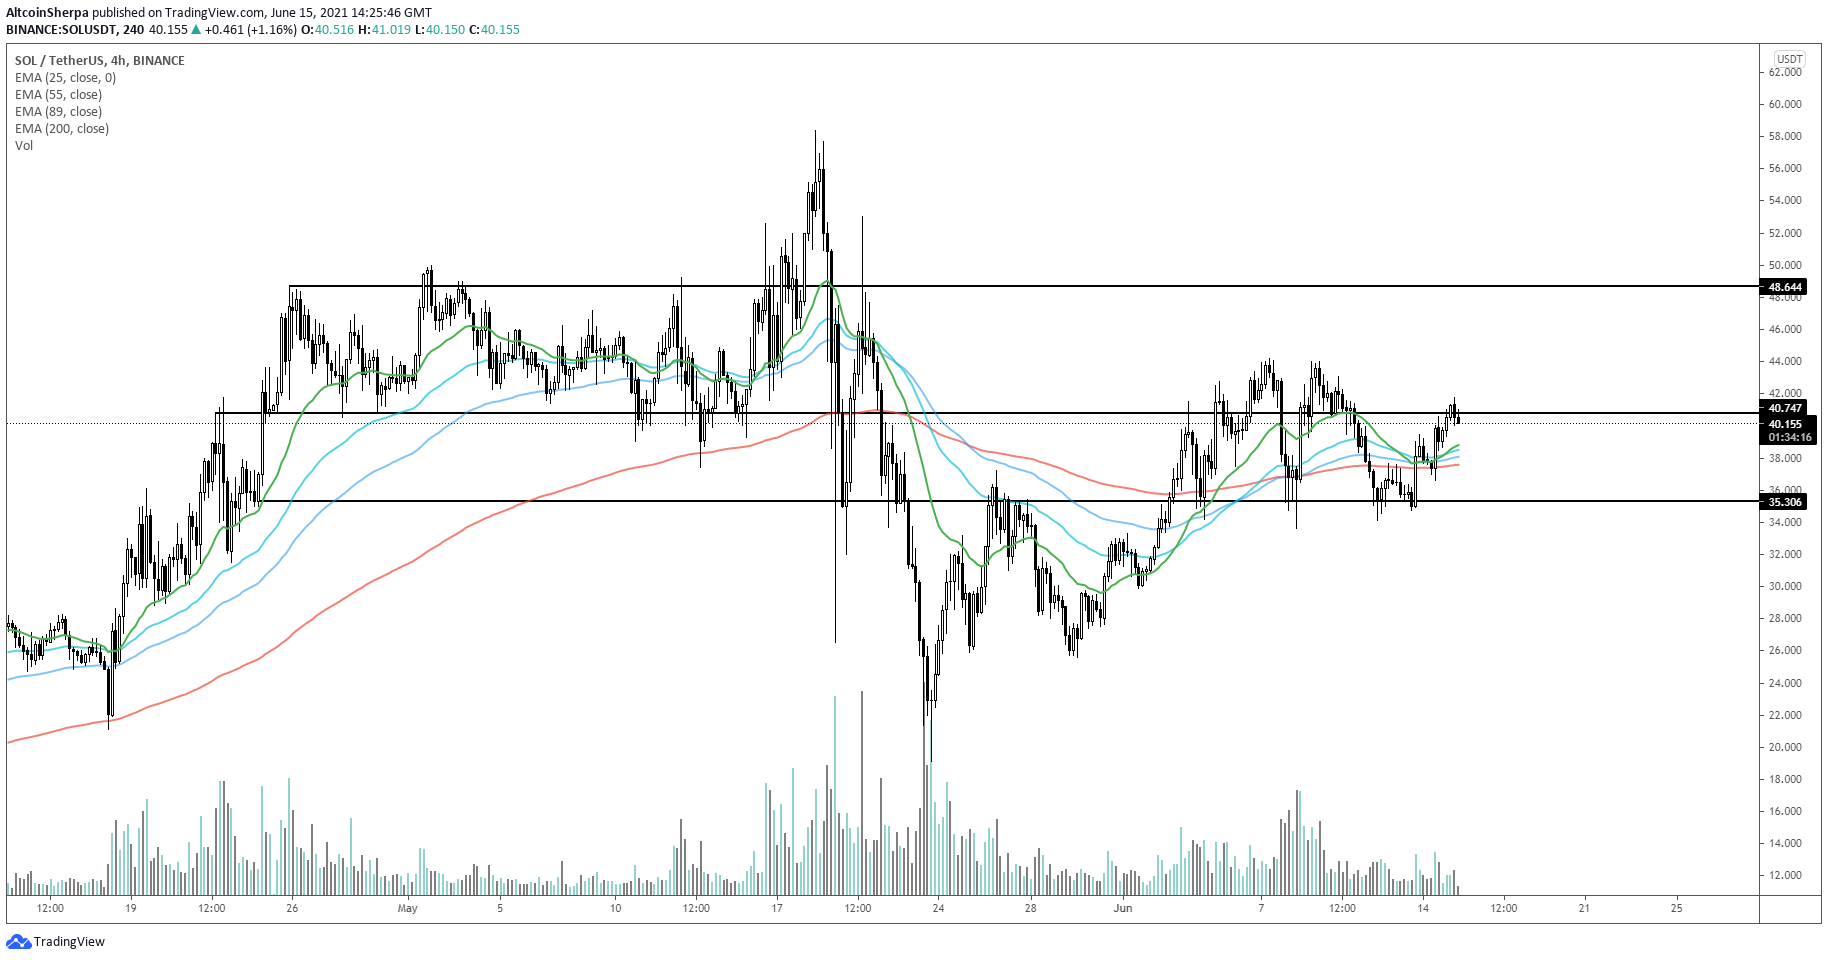
The resistance area of the range is the same as the previously outlined $36 resistance area. On the other hand, the closest support is the 0.5 Fib retracement (white) support level at $31.5.
There are several bearish signs in place. First, the upward movement looks like an A-B-C corrective structure, since it is a three wave instead of a five wave structure. Second, SOL has broken down from an ascending support line and validated it as resistance afterwards.
Finally, technical indicators are bearish, similarly to those in the daily time-frame.
Therefore, a decrease towards the $3.50 support area and potential breakdown are likely.
SOL/BTC
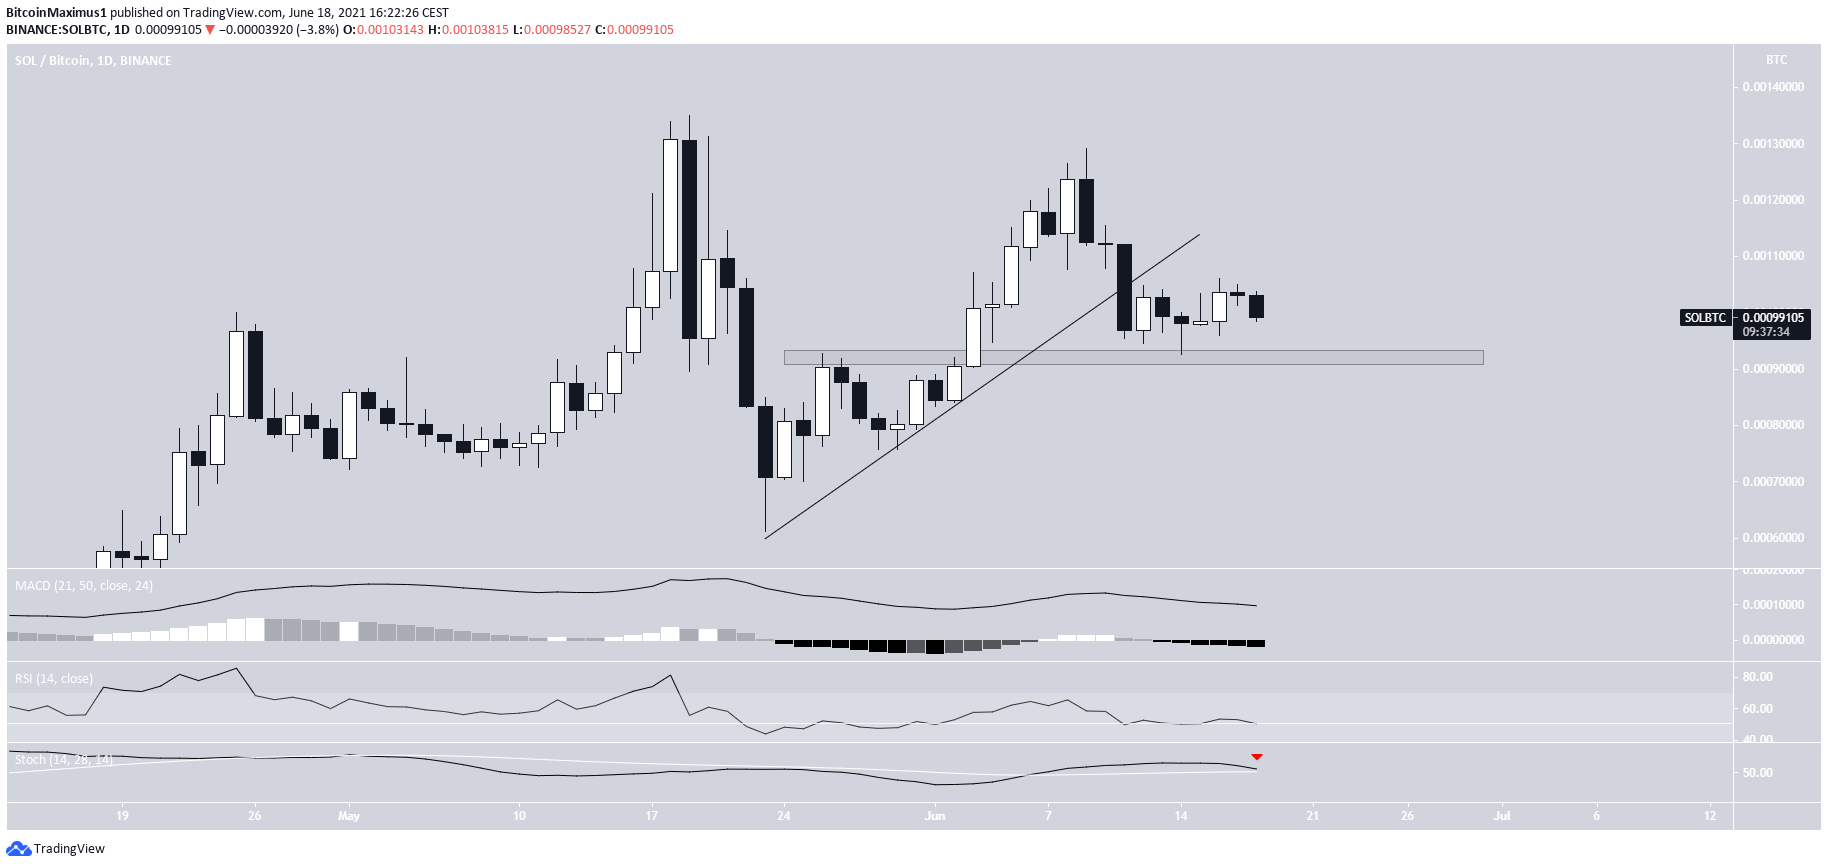
The SOL/BTC chart has some similarities to its USD counterpart. It has broken down from an ascending support line and is trading just above the horizontal support level of 92,000 satoshis.
In addition, technical indicators are bearish. This is especially evident by the imminent bearish cross in the Stochastic oscillator (red icon).
Therefore, a drop to this area and potential breakdown could transpire.
For BeInCrypto’s latest bitcoin (BTC) analysis, click here.


