


The SingularityNET (AGIX) price is correcting after a 1,285% increase since the beginning of the year. A short-term relief rally may occur before another decrease.
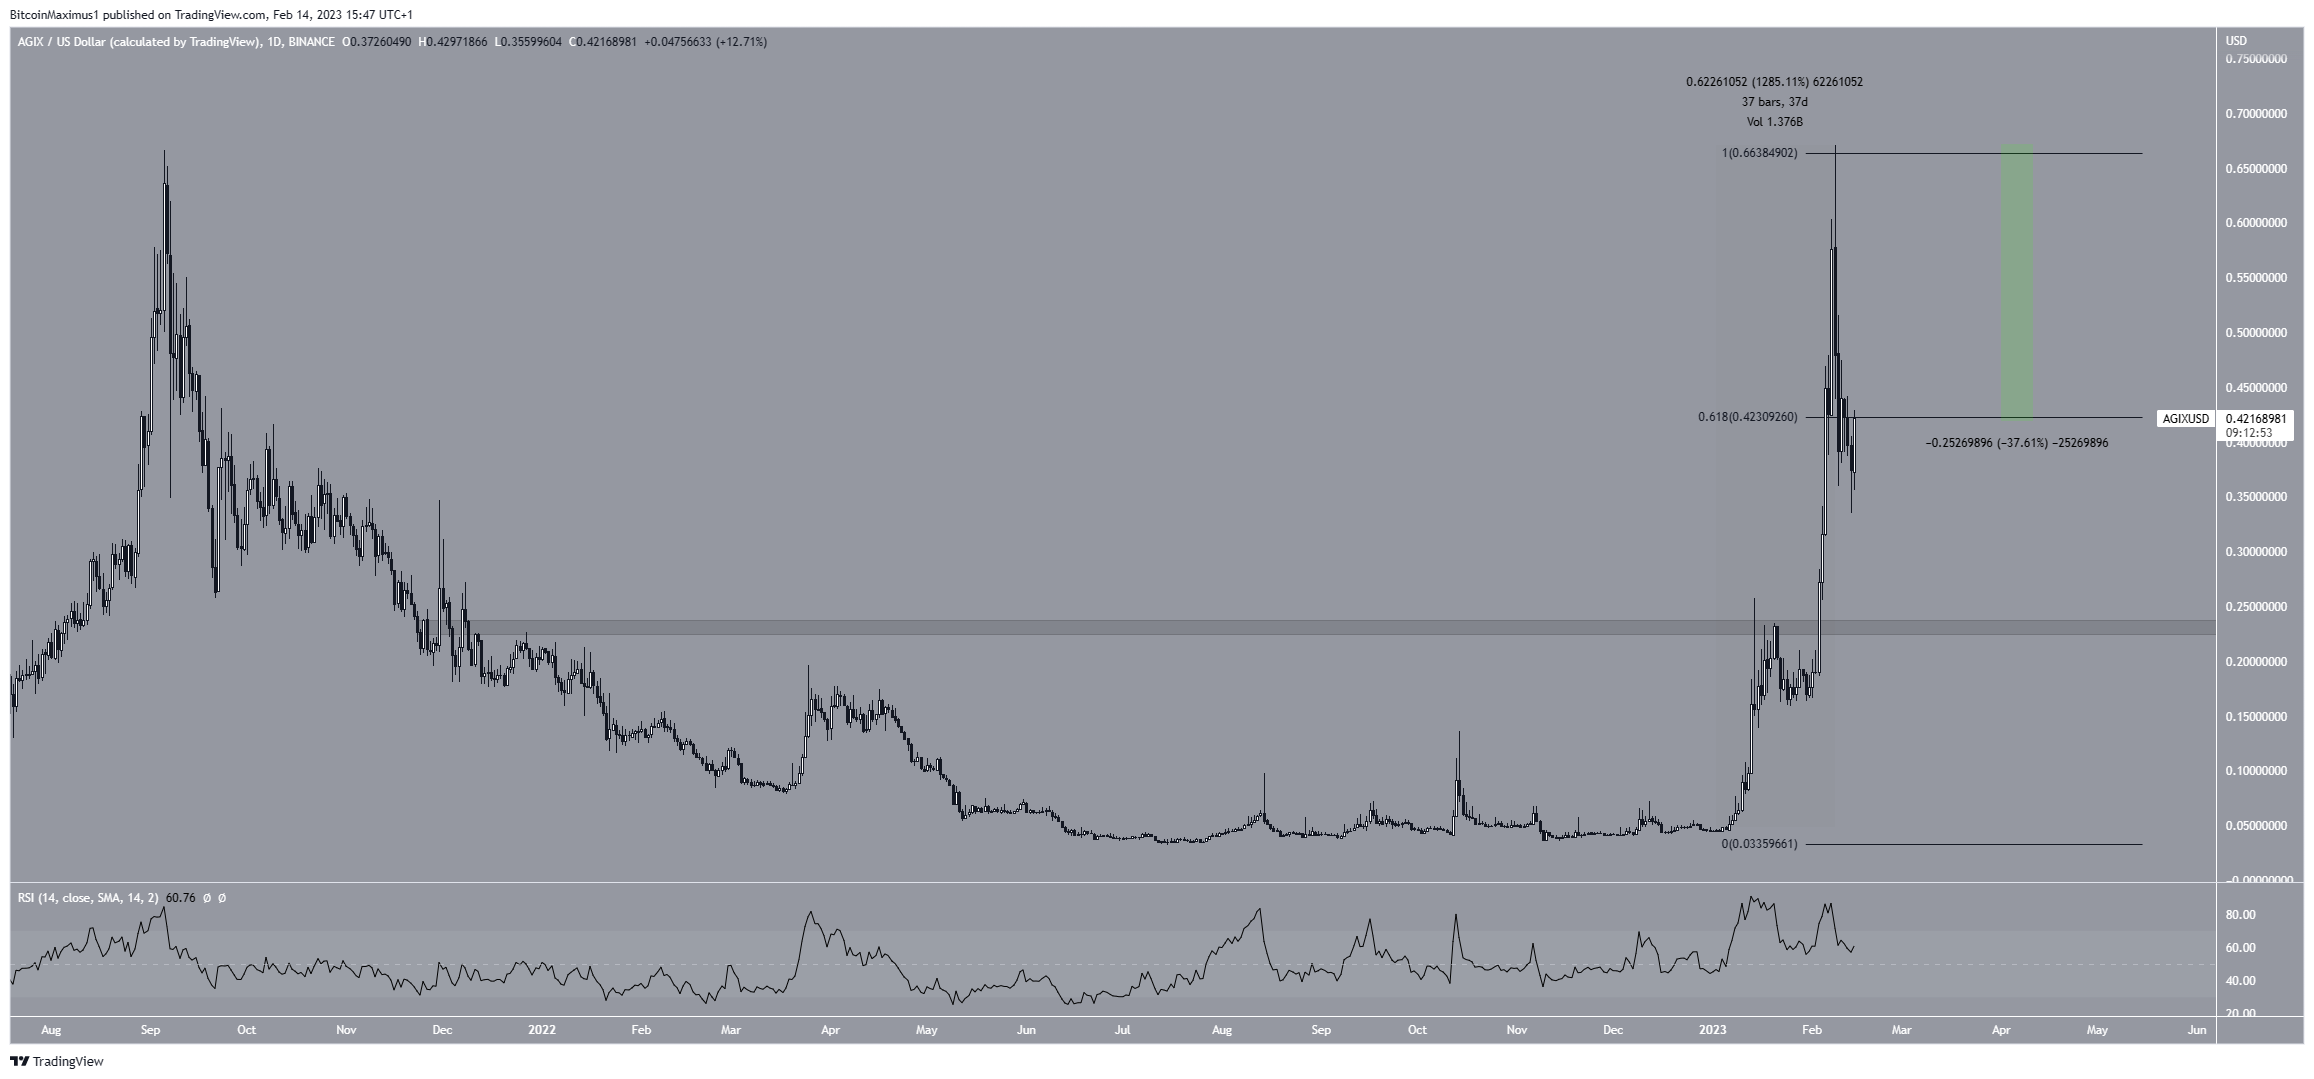
The AGIX price has been on an absolute tear since the beginning of the year. In a span of 37 days, the AGIX price increased by 1,285%, leading to a new all-time high of $0.67 on Feb.8.
However, the price fell sharply immediately after the all-time high and has decreased by 37.61% so far. The decrease was preceded by a bearish divergence in the daily RSI.
Currently, the price is attempting to reclaim the 0.618 Fib retracement support level at $0.42. If it does, it would be possible for the correction to be done.
However, if the price fails to reclaim the area, it could fall down to $0.23.
A look at a lower time frame is required in order to determine if the AGIX price will reclaim the area or get rejected from it instead.
SingularityNET Price Begins Relief Rally
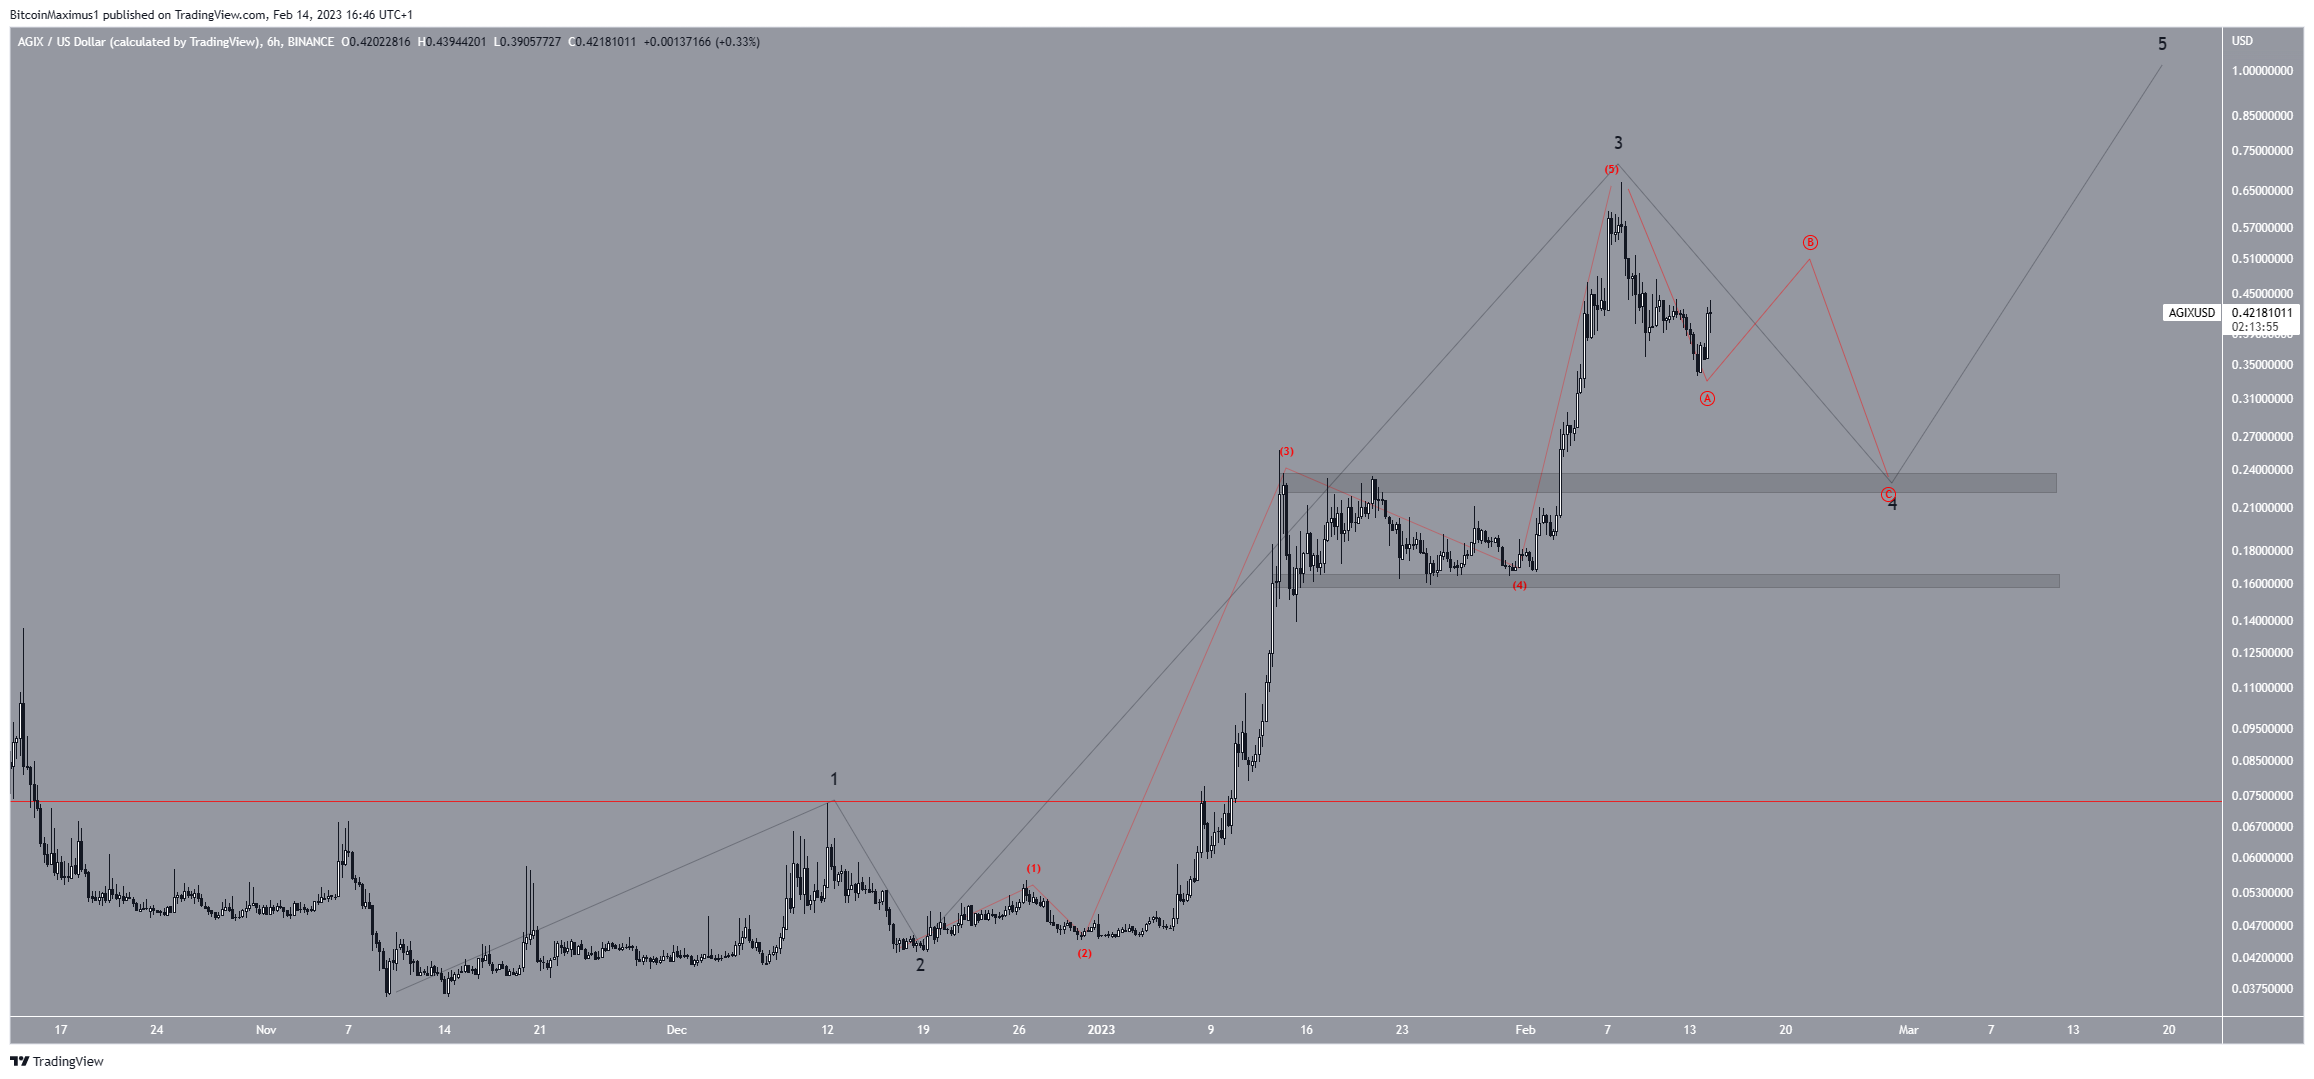
The wave count shows that the AGIX price is likely in wave four of a five-wave upward movement (black). Wave three extended considerably. The sub-wave count for it is given in red.
If the count is correct, the SingularityNET price is in an A-B-C corrective structure that will complete wave four. The most likely level for the wave to end is at $0.24. If the price closes below it, it could fall to the next support at $0.15. However, a relief rally is expected in the next 24 hours before the final drop. Afterward, an increase toward a new all-time high price is expected.
A fall below the wave one high of $0.073 (red line) would invalidate the bullish count and suggest that the price will fall below $0.04.
A movement above the current all-time high would indicate that wave 5 is in progress. In that case, the next resistance levels would be at $0.84 and $1.06, respectively.
To conclude, the most likely AGIX price forecast is a fall toward $0.23 followed by an upward movement toward a new all-time high. On the other hand, if the AGIX token price breaks down below $0.23, it could fall down to $0.14.
For BeInCrypto’s latest crypto market analysis, click here.


