


The most significant inflow of bitcoin (BTC) into exchanges since March 2020 preceded the massive decrease on May 19.
It is interesting to note that the inflow was present on Binance, but did not occur on Coinbase.
BTC inflow
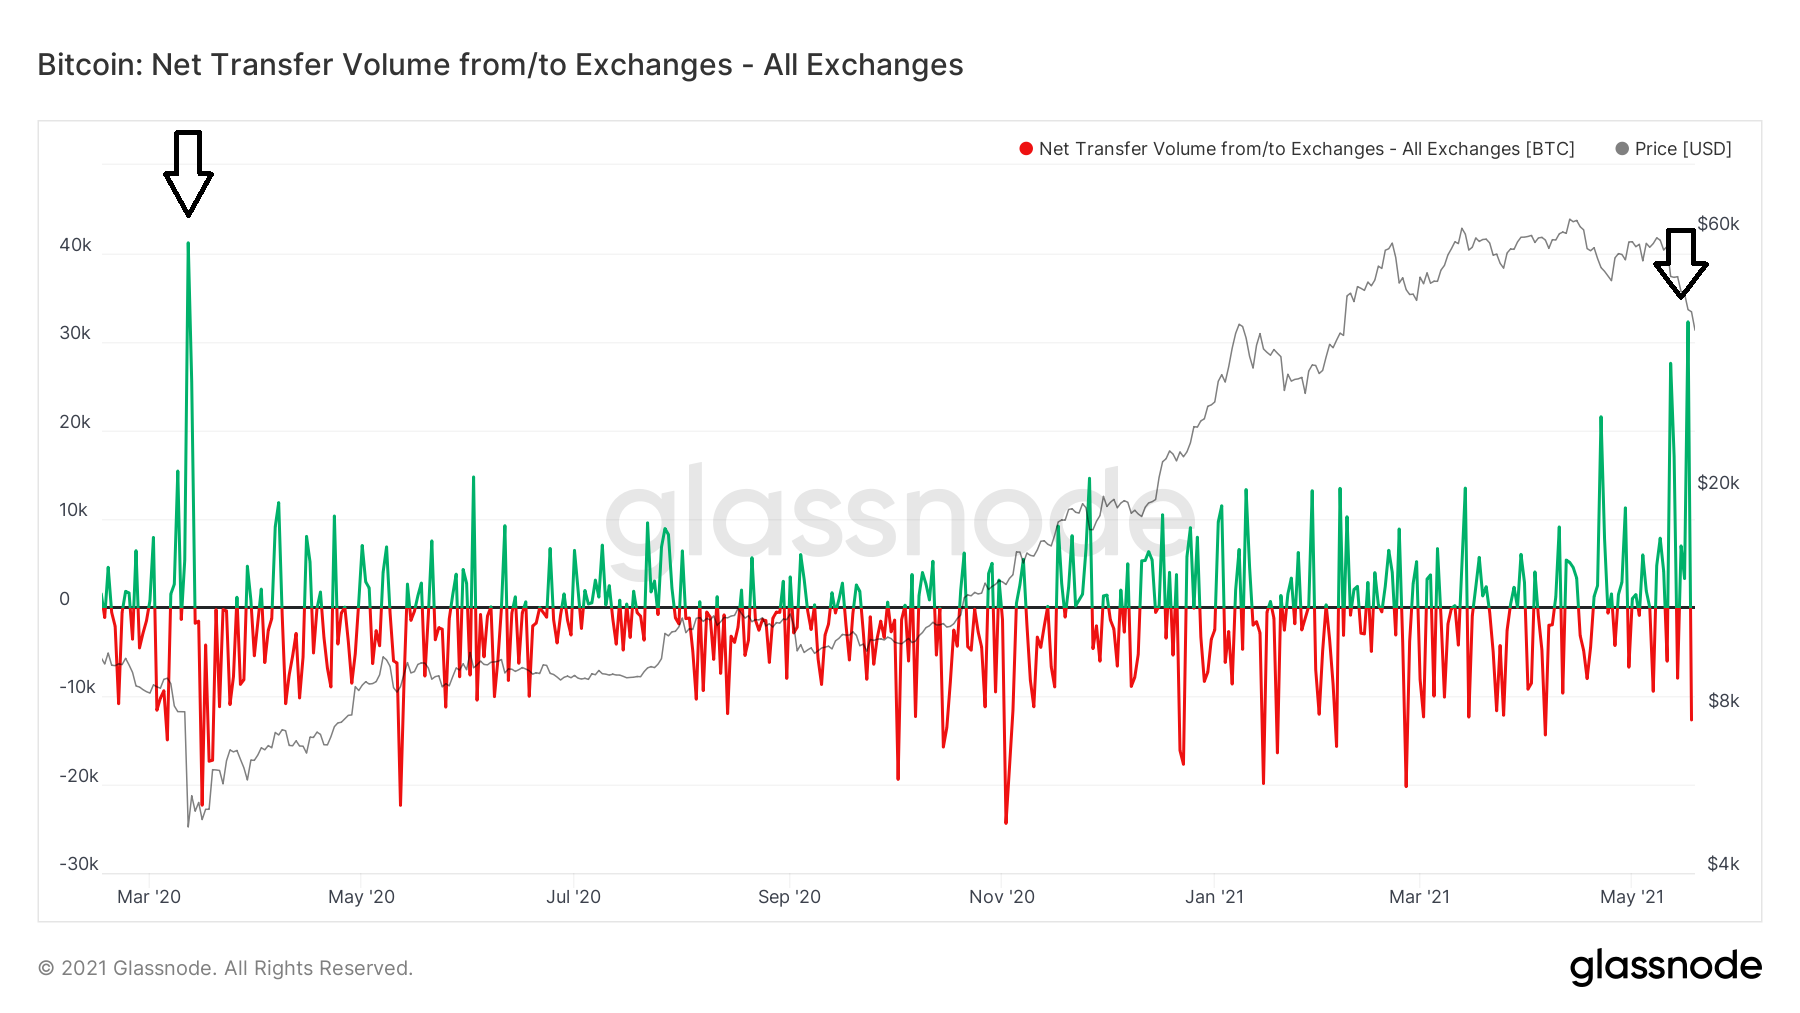
The net transfer volume is created by subtracting the number of coins withdrawn from the number of coins deposited into exchanges.
On May 17, the net BTC transfer volume to all exchanges was the highest recorded this year, measuring 32,274.
In fact, this was the highest number since March 12, 2020, when the net transfer volume was 41,204. Both inflows preceded a very significant drop.
Binance vs Coinbase
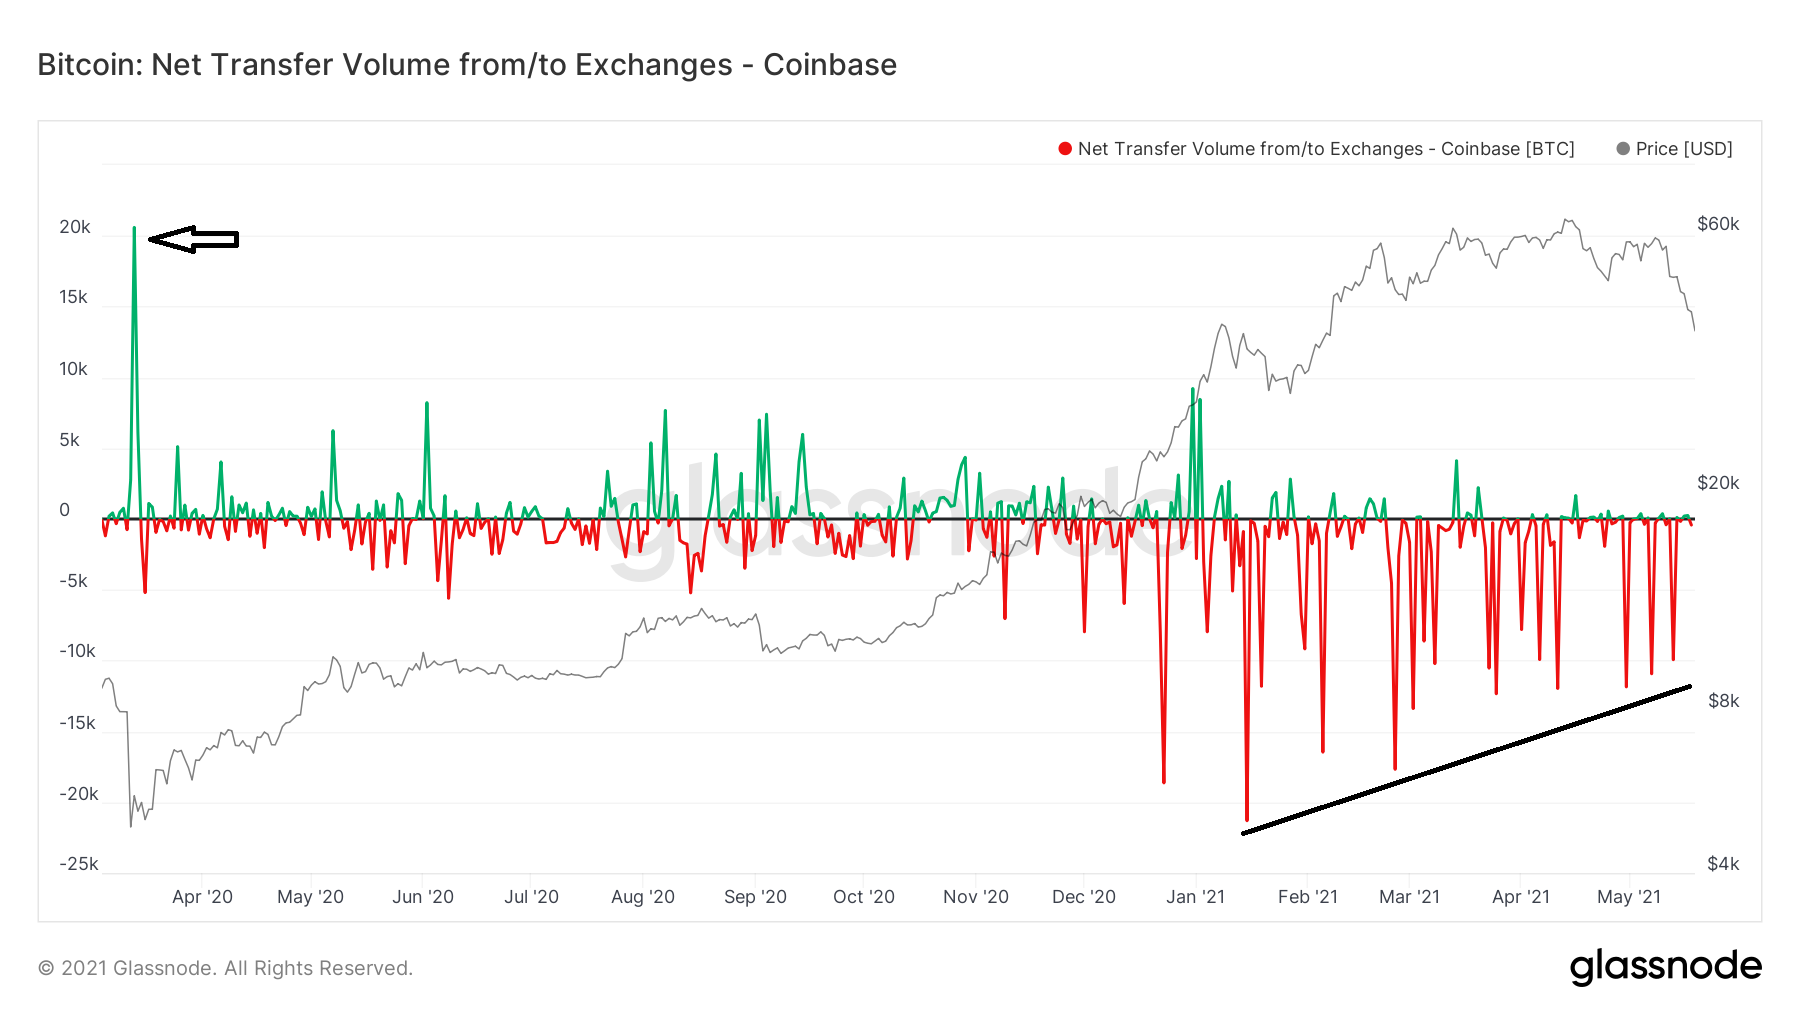
A closer look at different exchanges shows a distinct difference between the inflows for Coinbase and Binance.
In Coinbase, there was a virtually neutral inflow. Furthermore, there has been a general net outflow since January 21.
Coinbase is often associated with institutional buyers, so the assumption that institutions are increasing their positions can be made. On the other hand, there was a significant inflow in March 2020.
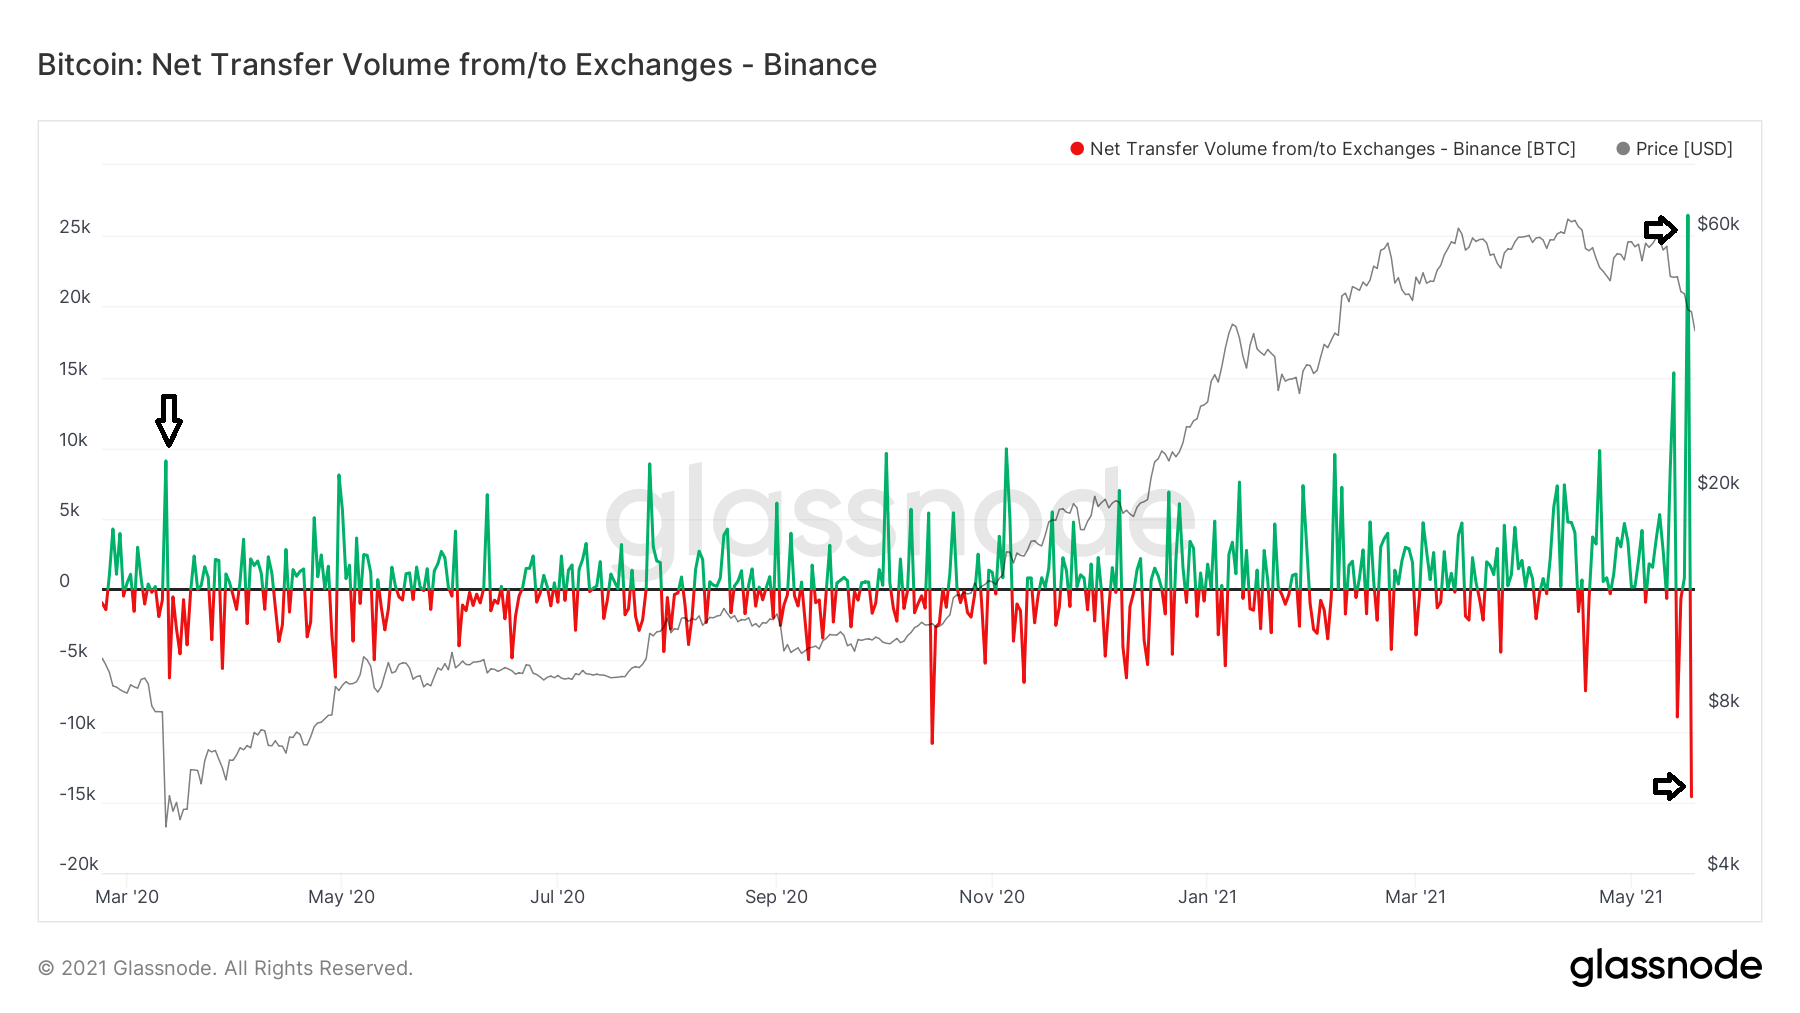
However, an entirely different story is present when looking at the data for Binance. In it, the May 17 inflow dwarfed that of March 2020.
Binance is usually associated with retail buyers. Therefore, the assumption can be made that retail investors were the instigators of the decrease.
Interestingly, there was an outflow right after the decrease, indicating that a significant number of BTC had been moved out of the exchange.
BTC all-time high drawdown
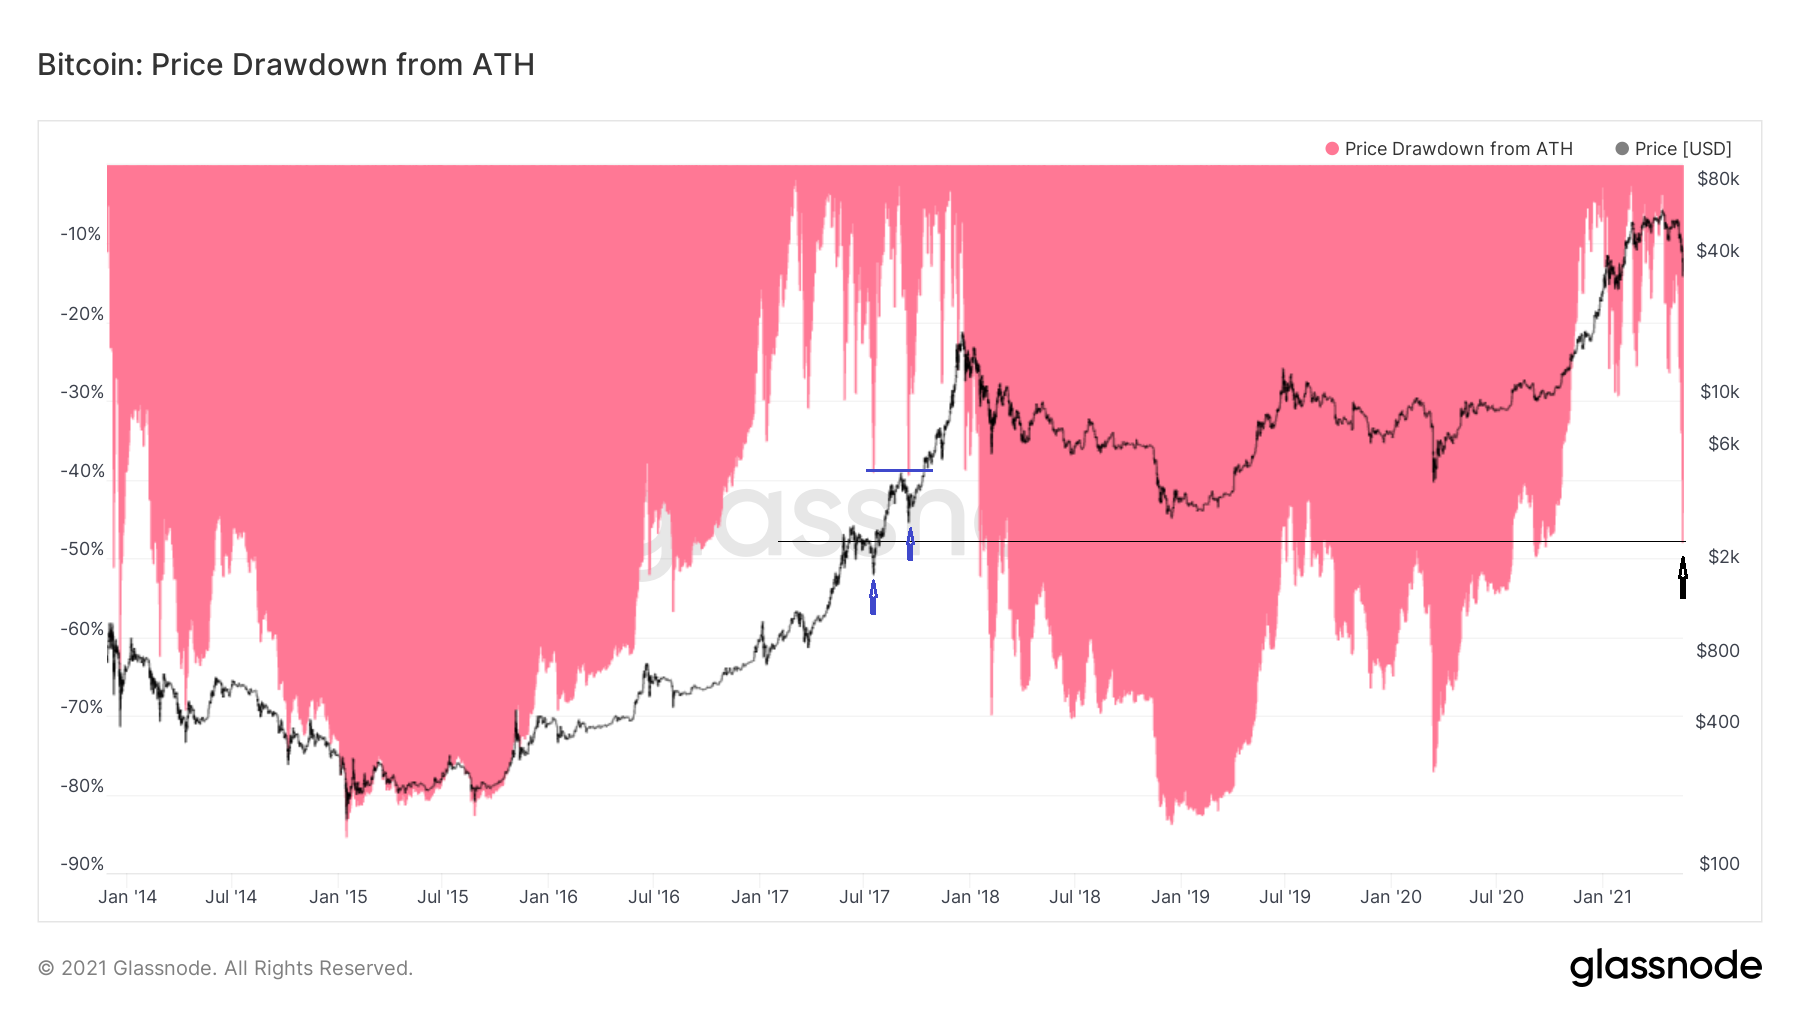
An intriguing visual is created when looking at the BTC price drawdown from all-time high.
In the 2017 bullish run, the two biggest drawdowns from the all-time high were at 39% (blue icons). Those occurred on July 16 and Sept. 15, respectively.
Yesterday’s decrease marked a 48% drawdown from the current all-time high. Therefore, it is unprecedented in terms of a bull run.
If the price is still in a bullish trend, it would be expected to bounce significantly from the current level.
For BeInCrypto’s latest bitcoin (BTC) analysis, click here.


