


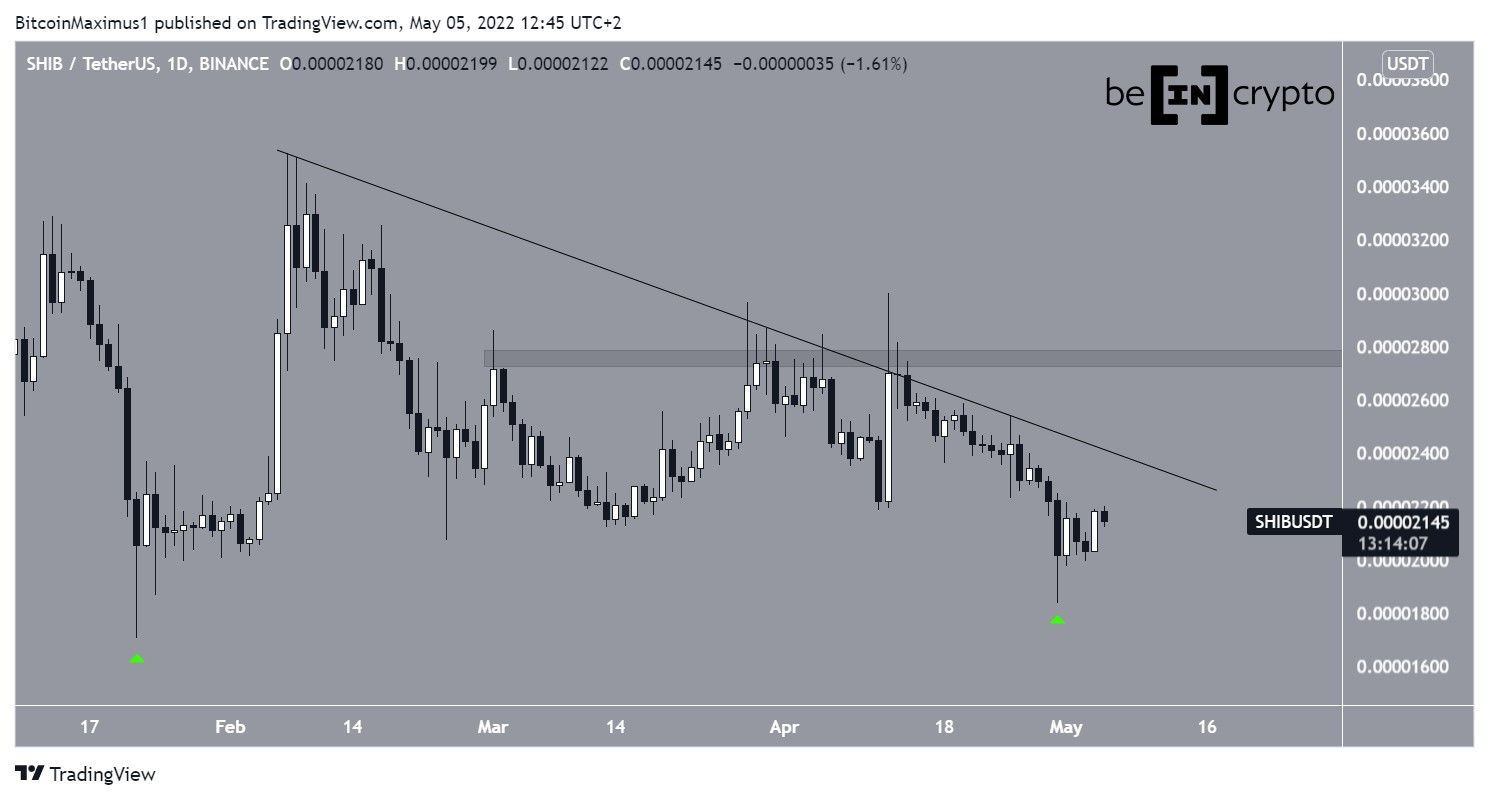
Relative to the price in Jan, Shiba Inu (SHIB) has created a double bottom pattern, which has also been combined with bullish divergences.
SHIB has been decreasing alongside a descending resistance line since reaching a high of $0.000035 on Feb 7. The line has been validated four times so far, most recently on April 25. The downward movement led to a low of $0.000018 on April 30.
Compared to the low in Jan, this created a double bottom, which is considered a bullish pattern. The double bottom has been combined with long lower wicks (green icons), which are considered signs of buying pressure.
If a breakout from the line occurs, the closest resistance area would be at $0.0000275.
Bullish readings
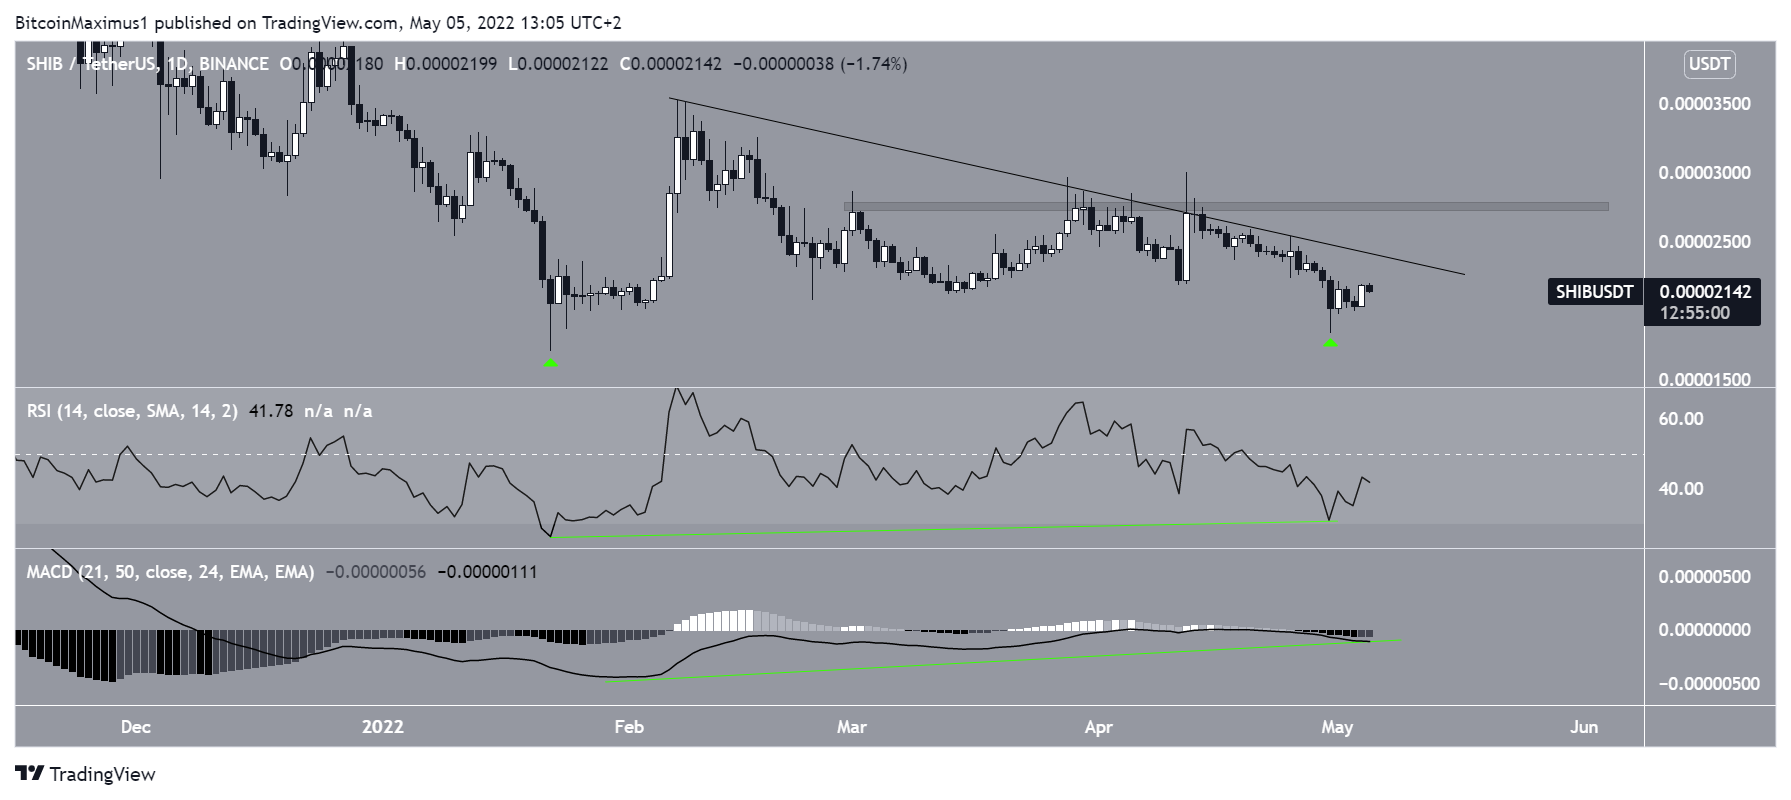
A look at daily time frame indicators for SHIB shows that the double bottom has been combined with bullish divergences in both the RSI and MACD. Such divergences often precede significant trend reversals. The fact that they have transpired over such a long period of time increases their validity.
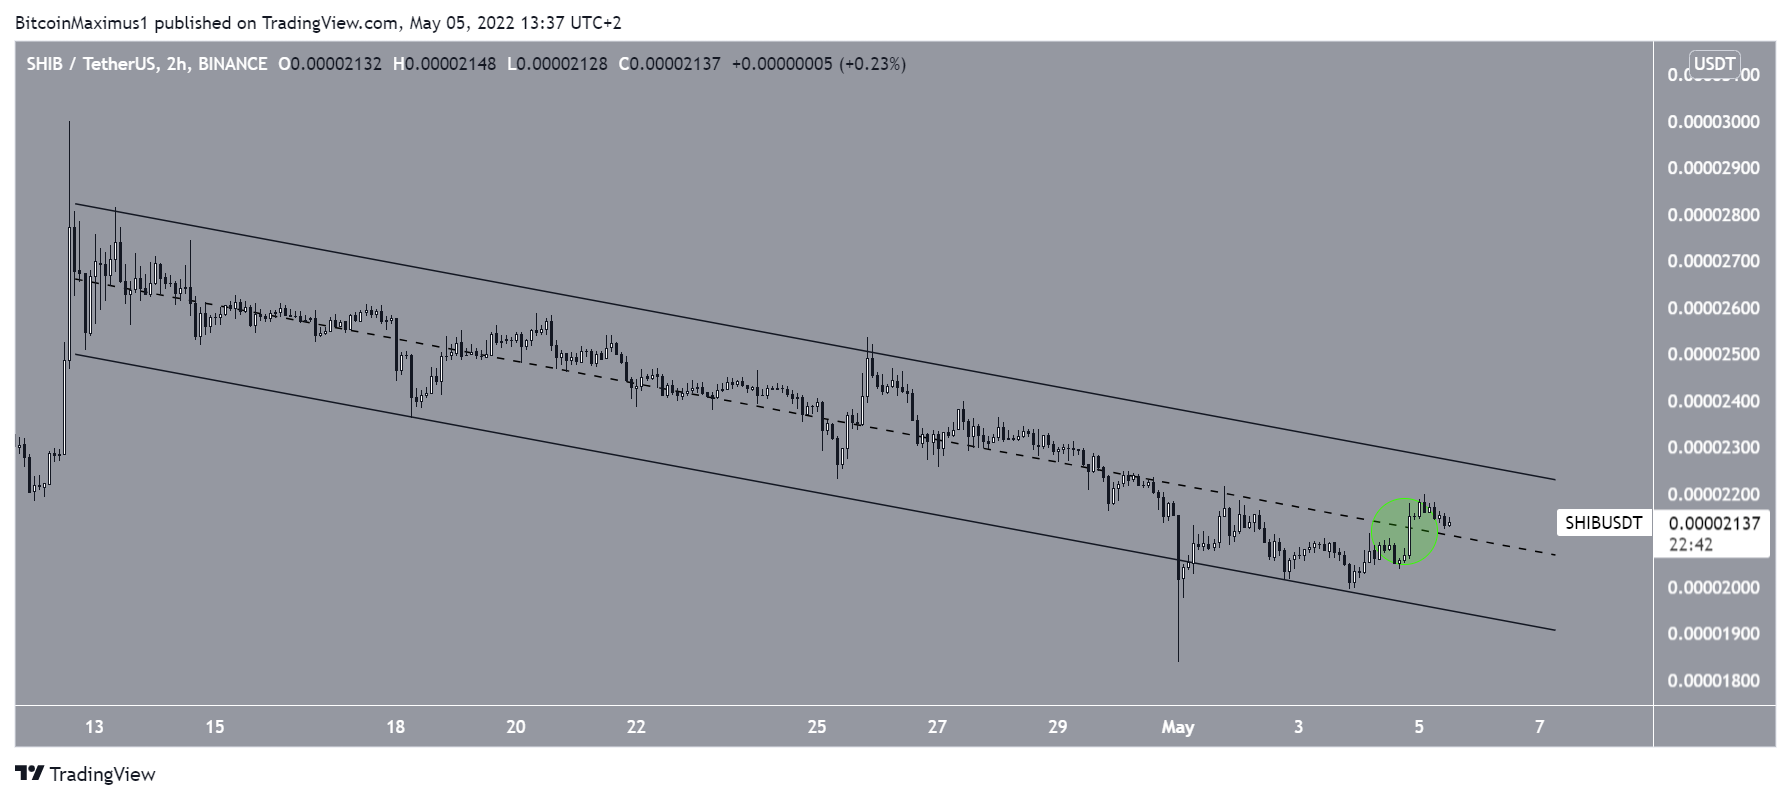
The two-hour chart shows that SHIB has been decreasing inside a descending channel since April 13. Such channels usually contain corrective movements, meaning that a breakout from them would be likely.
Additionally, the price has reclaimed the middle of the channel, something which can be considered a bullish development.
Therefore, the two-hour time frame is in alignment with the daily one, indicating that a breakout is likely.
SHIB wave count analysis
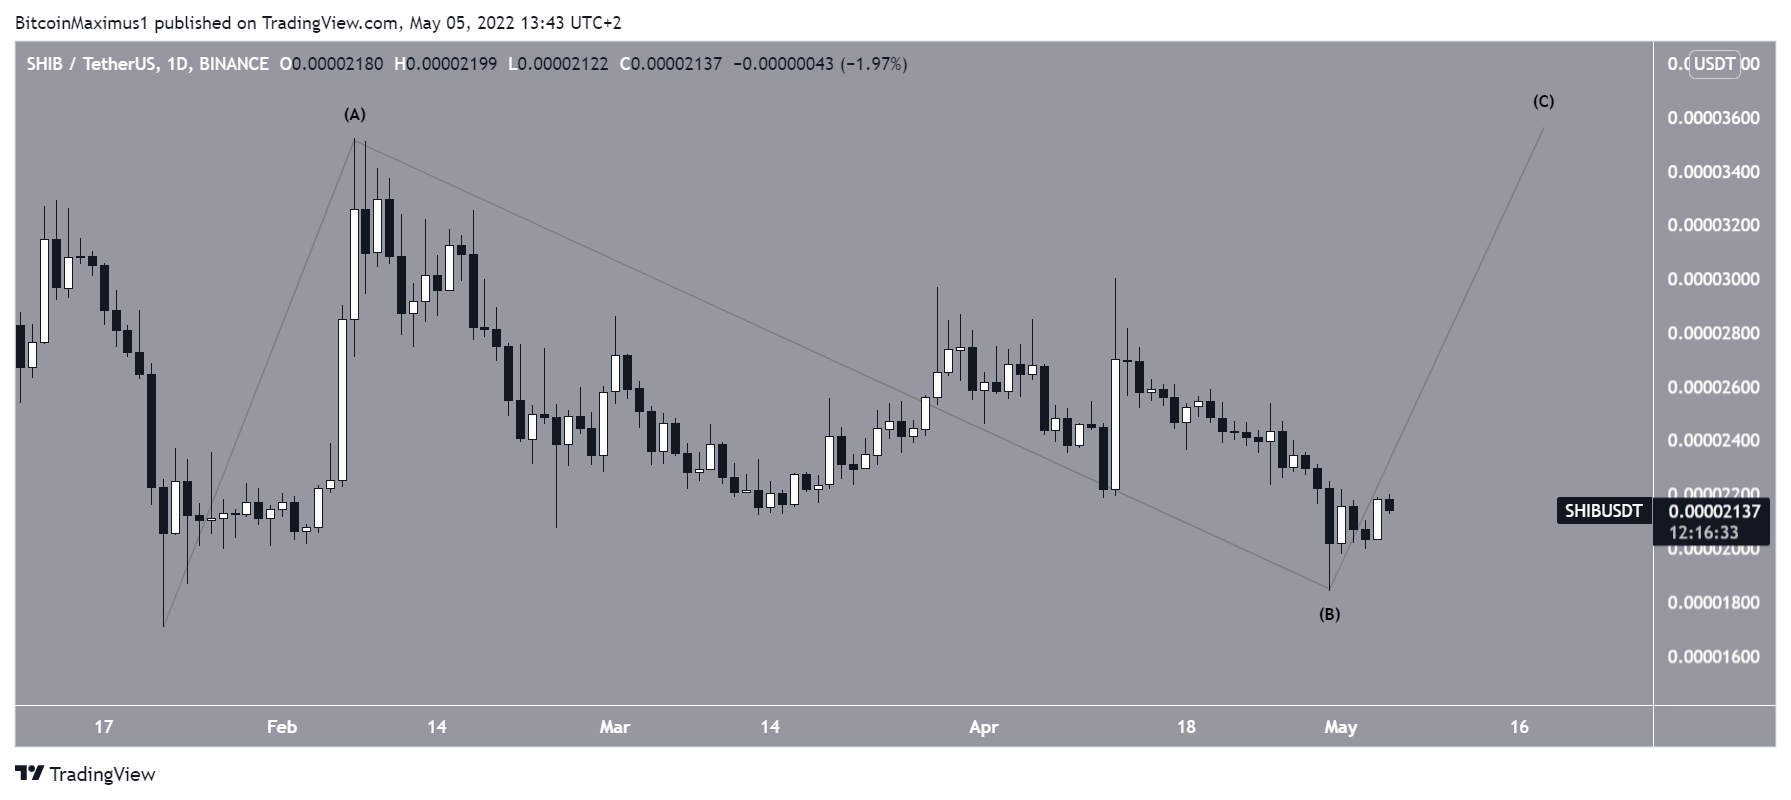
Due to the depth of the retracement, the most likely wave count suggests that the entire movement since Jan is part of an A-B-C, flat corrective structure. If this is correct, then SHIB has just begun wave C of this structure.
In such structures, waves A:C often have a 1:1 ratio. Therefore, it is possible that SHIB will increase all the way to $0.000035.
For Be[in]Crypto’s latest Bitcoin (BTC) analysis, click here


