


After decreasing by 50% since its all-time high, Shiba Inu (SHIB) has reached the first potential bounce area and is just above a confluence of support levels.
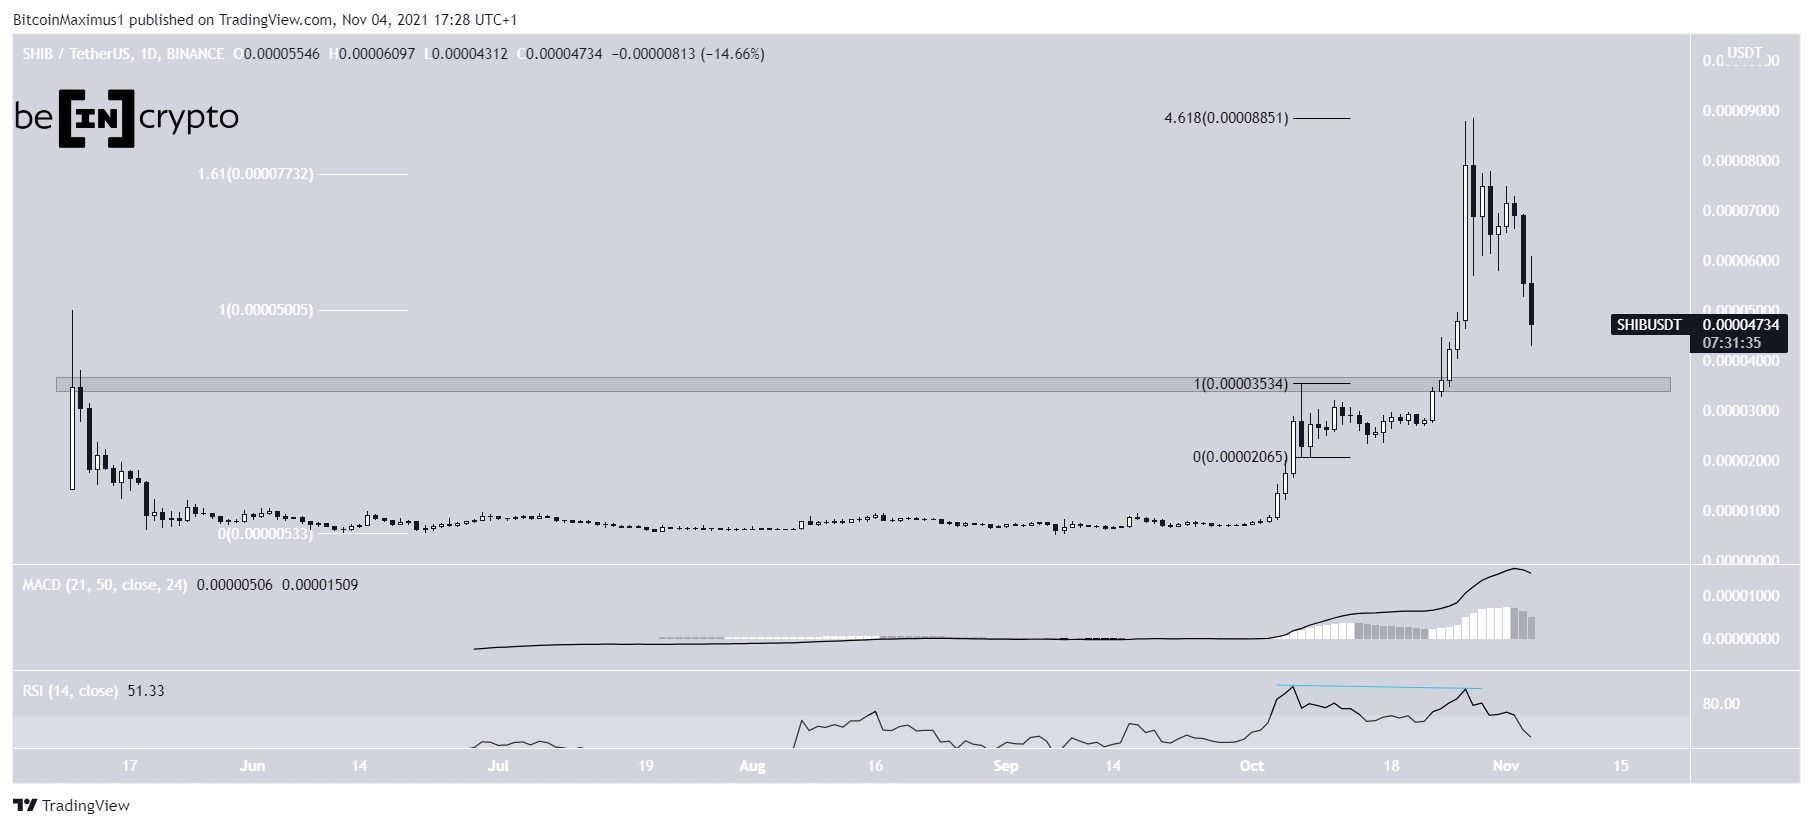
SHIB has been decreasing since Oct 28, when it reached a high of $0.00008854. So far, it has reached a low of $0.00004312 on Nov 4. This amounted to a downward move of 52%.
The high was reached inside an area suitable for a local top. The high was made between the 1.61 external Fib retracement level (white) when measuring the downward movement in May, and the 4.618 level when measuring the drop in October (black).
Furthermore, it was combined with a bearish divergence in the RSI. This occurs when the price creates a higher high but the indicator creates a lower high. The RSI is a momentum indicator, and this reading suggests that the increase in price was not accompanied by an increase in momentum.
The closest support area is found at $0.00003500. This is the previous all-time high region, which also acted as resistance at the beginning of October. Now, it is expected to act as support.
Where will SHIB find support?
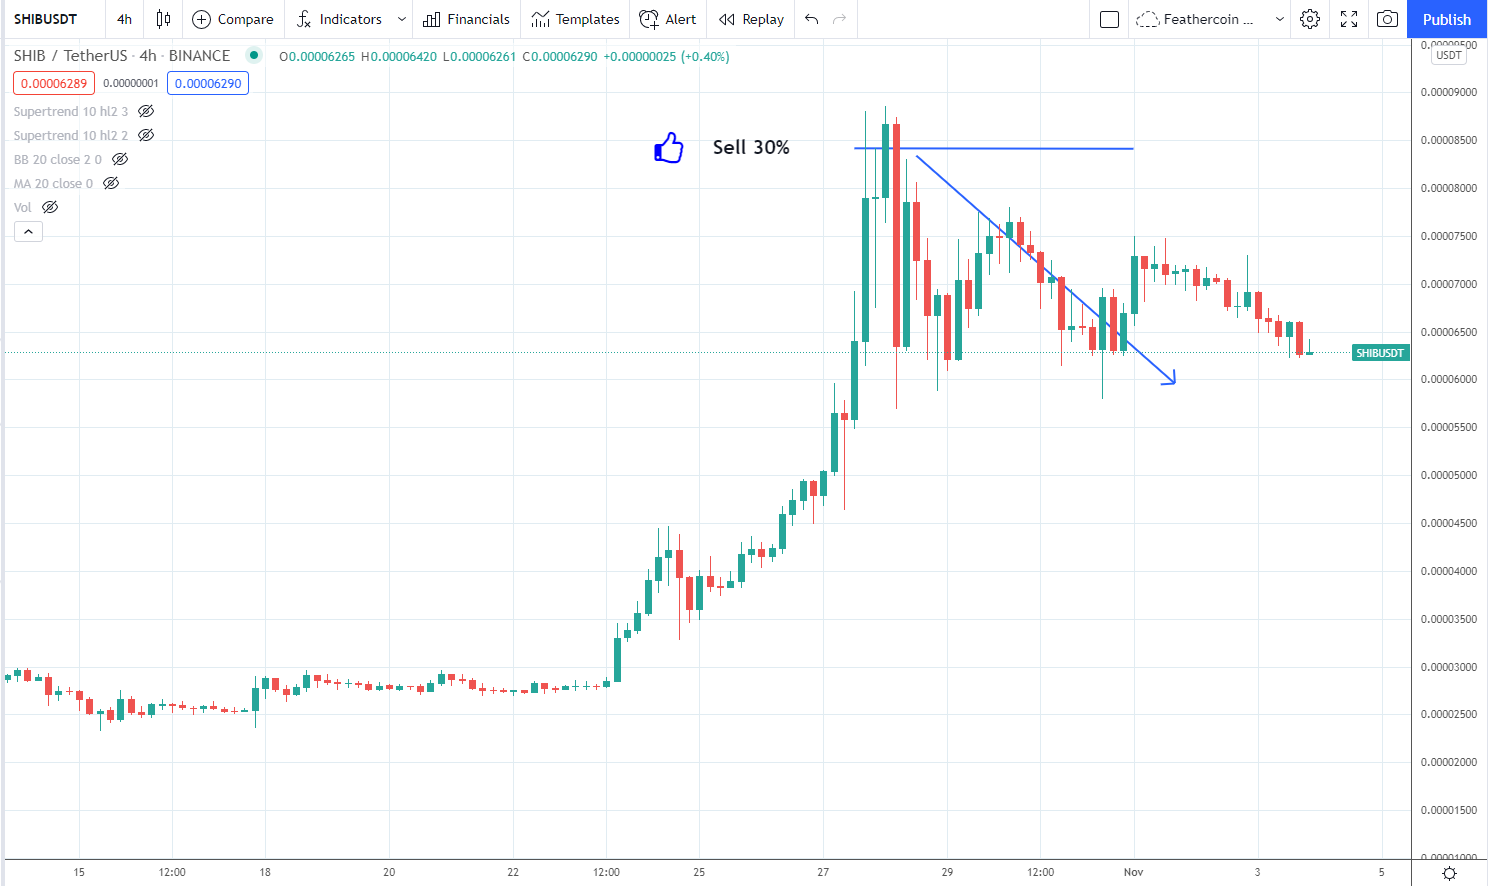
Cryptocurrency trader @IncomeSharks tweeted a SHIB chart, stating that the token has been decreasing and is close to breaking down.
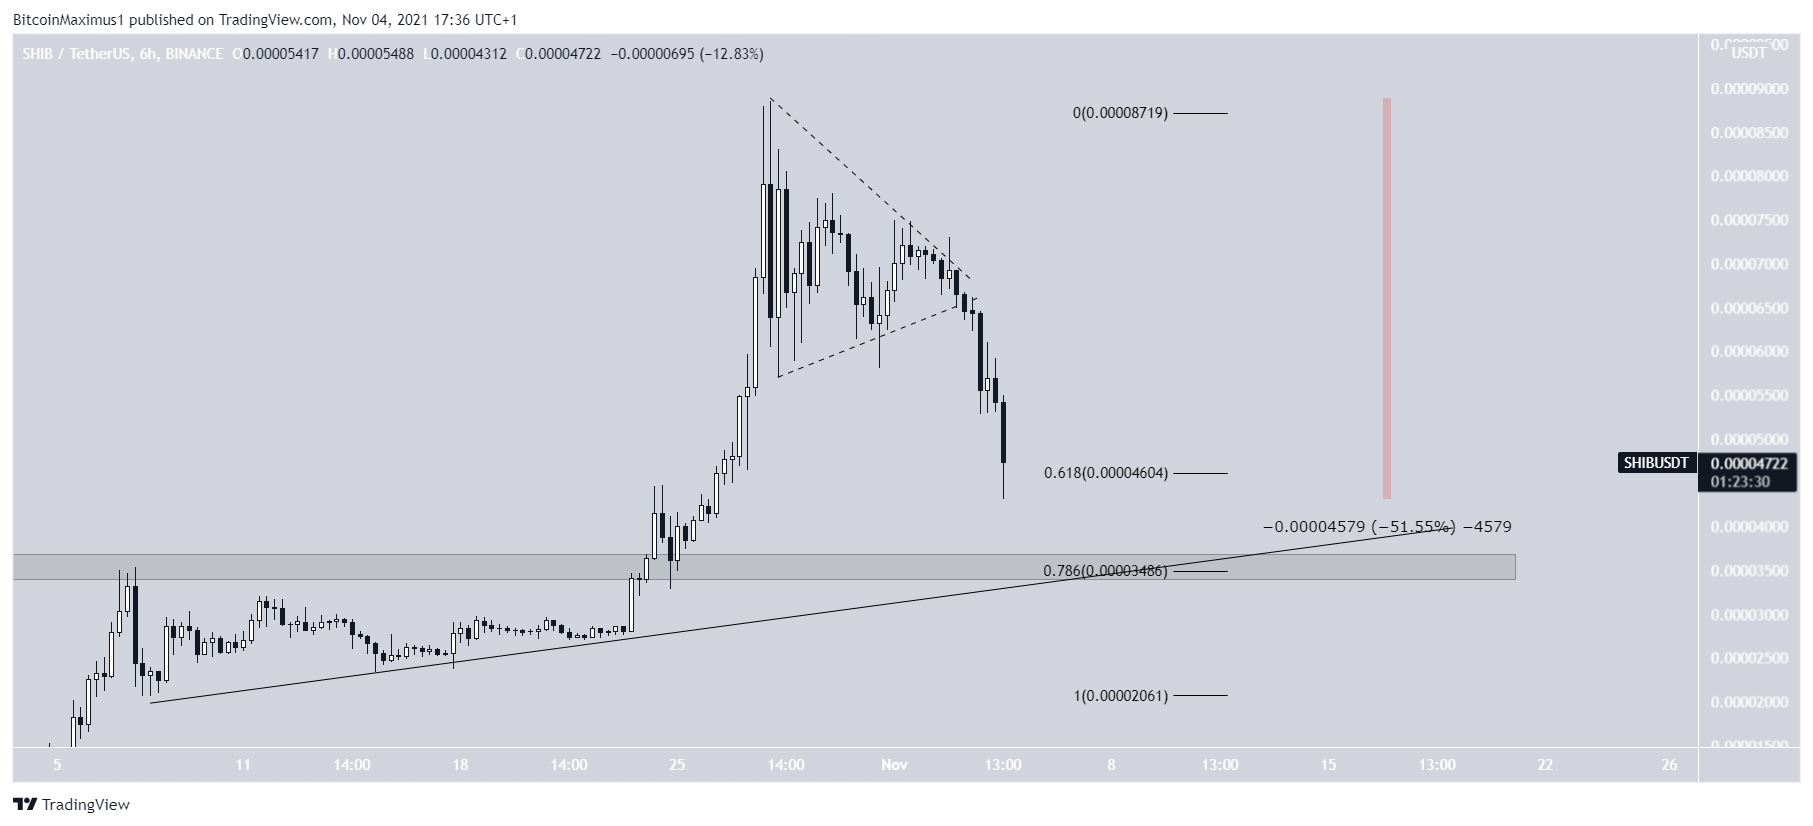
The six-hour chart shows that SHIB has broken down from a symmetrical triangle.
In addition to this, it shows that the $0.00003500 support area is extremely significant, due to a confluence of factors.
Besides being a horizontal area, it also coincides with an ascending support line and is the 0.786 Fib retracement support level. Therefore, if SHIB gets there, it would be very likely to bounce.
Future movement
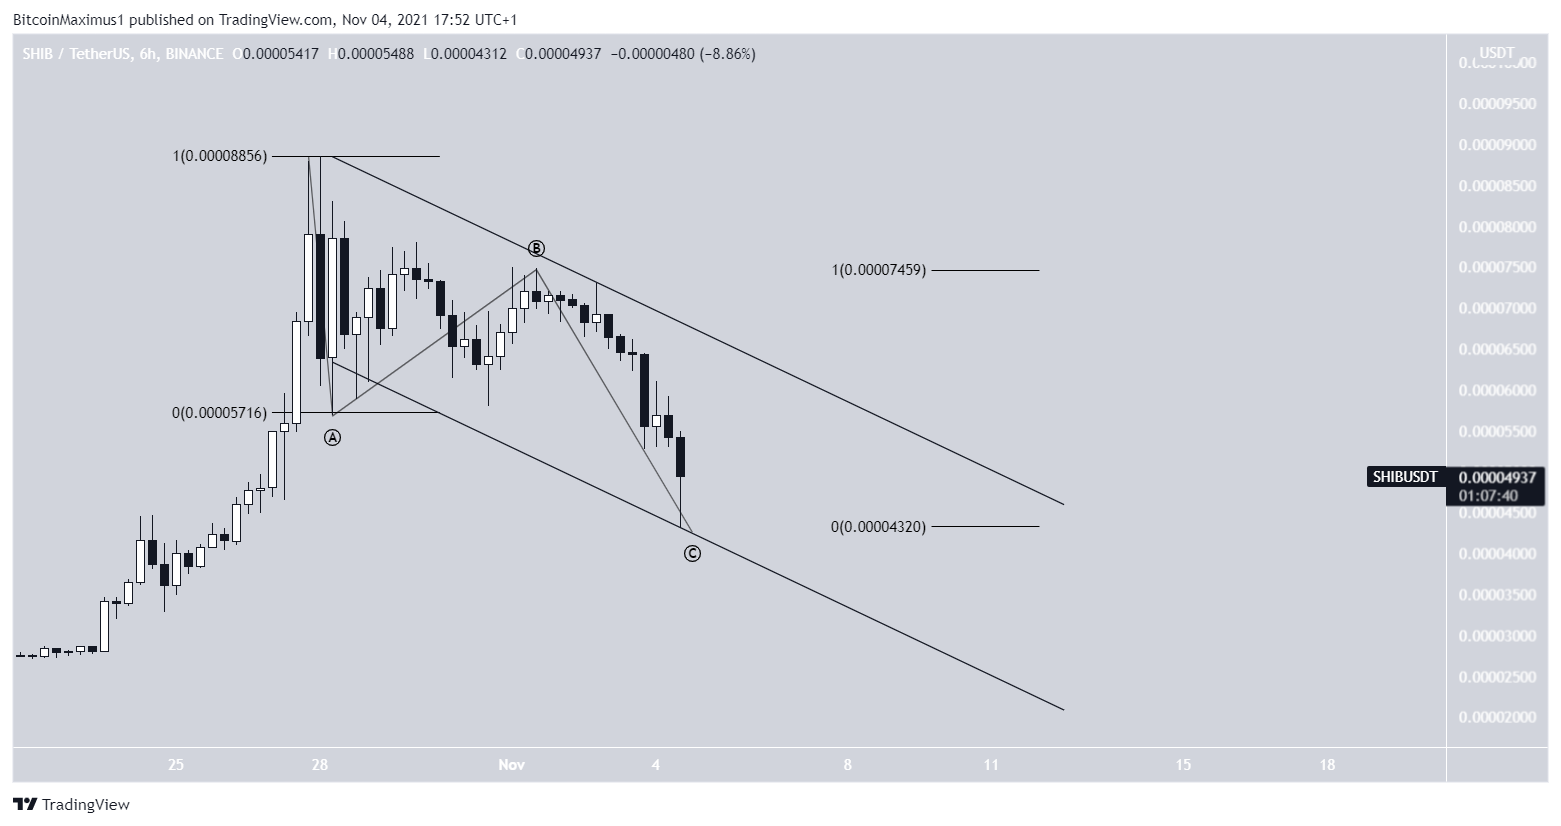
A closer look reveals that SHIB is potentially trading inside a descending parallel channel. If so, it has just bounced at its support line.
Furthermore, it’s possible that the decrease is a three-wave A-B-C structure. In this case, waves A:C have an exact 1:1 ratio, which is common.
Therefore, it’s possible that SHIB will reverse at the current levels instead of dropping all the way to $0.00003500. In any case, a considerable bounce is likely to transpire soon.
For BeInCrypto’s latest Bitcoin (BTC) analysis, click here.


