


The Shiba Inu (SHIB) price and the Dogecoin (DOGE) price are both following descending resistance lines, a sign of a downward trend.
Dogecoin Price Resumes Descent
Dogecoin is the largest meme token based on its market cap. Its most well-known fan is Elon Musk. Despite his decision of Dec. 19 to step down as CEO of Twitter and the negative ramifications this could have for Twitter crypto payments, the DOGE price has experienced no price setback yet.
Despite the poll’s results stating that most people want him to step down, Mr. Musk has received support from notable cryptocurrency figures, such as Vitalik Buterin, Michael Saylor, and Changpeng Zhao.
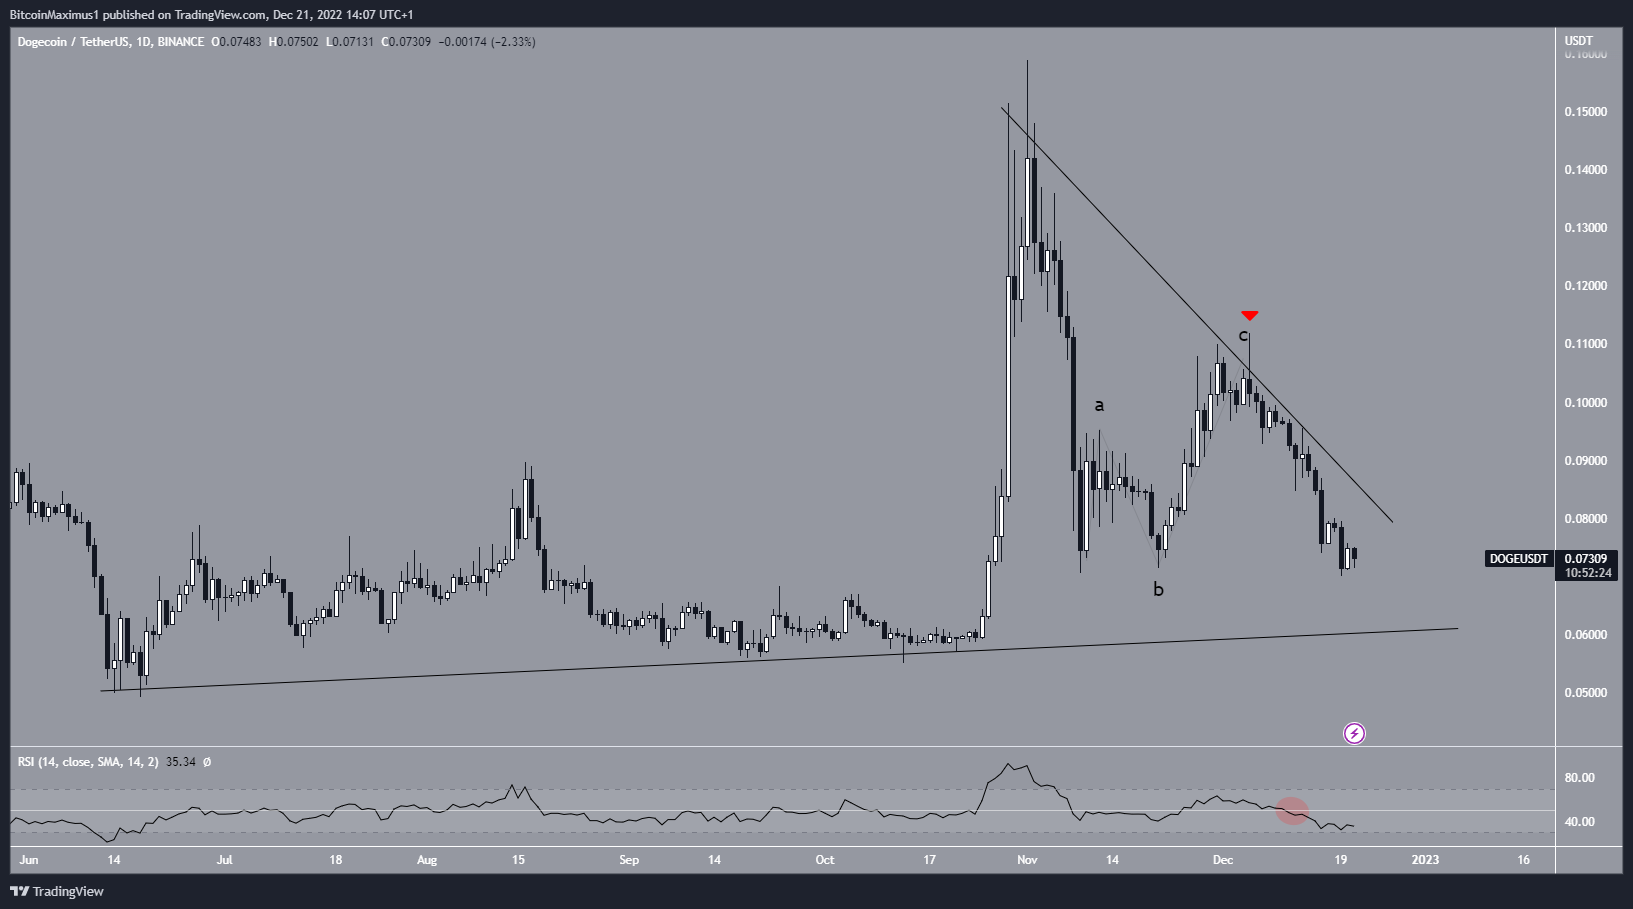
However, the DOGE price has already been mired in a decrease below a descending resistance line since Nov. 1. The resistance line caused a rejection on Dec. 5 (red icon), accelerating the rate of decline. This led to a low of $0.069 on Dec. 19.
Additionally, it caused the daily RSI to decrease below 50 (red circle), a sign associated with bearish trends.
Finally, the Dogecoin price movement since Nov. 9 resembles a completed A-B-C corrective structure. All these signs indicate that the continuation of the Dogecoin price decrease is expected.
If so, the DOGE price could find support near an ascending support line at $0.06.
Conversely, breaking out from the resistance line would invalidate this bearish DOGE price forecast.
Shiba Inu Price Fall Below Support
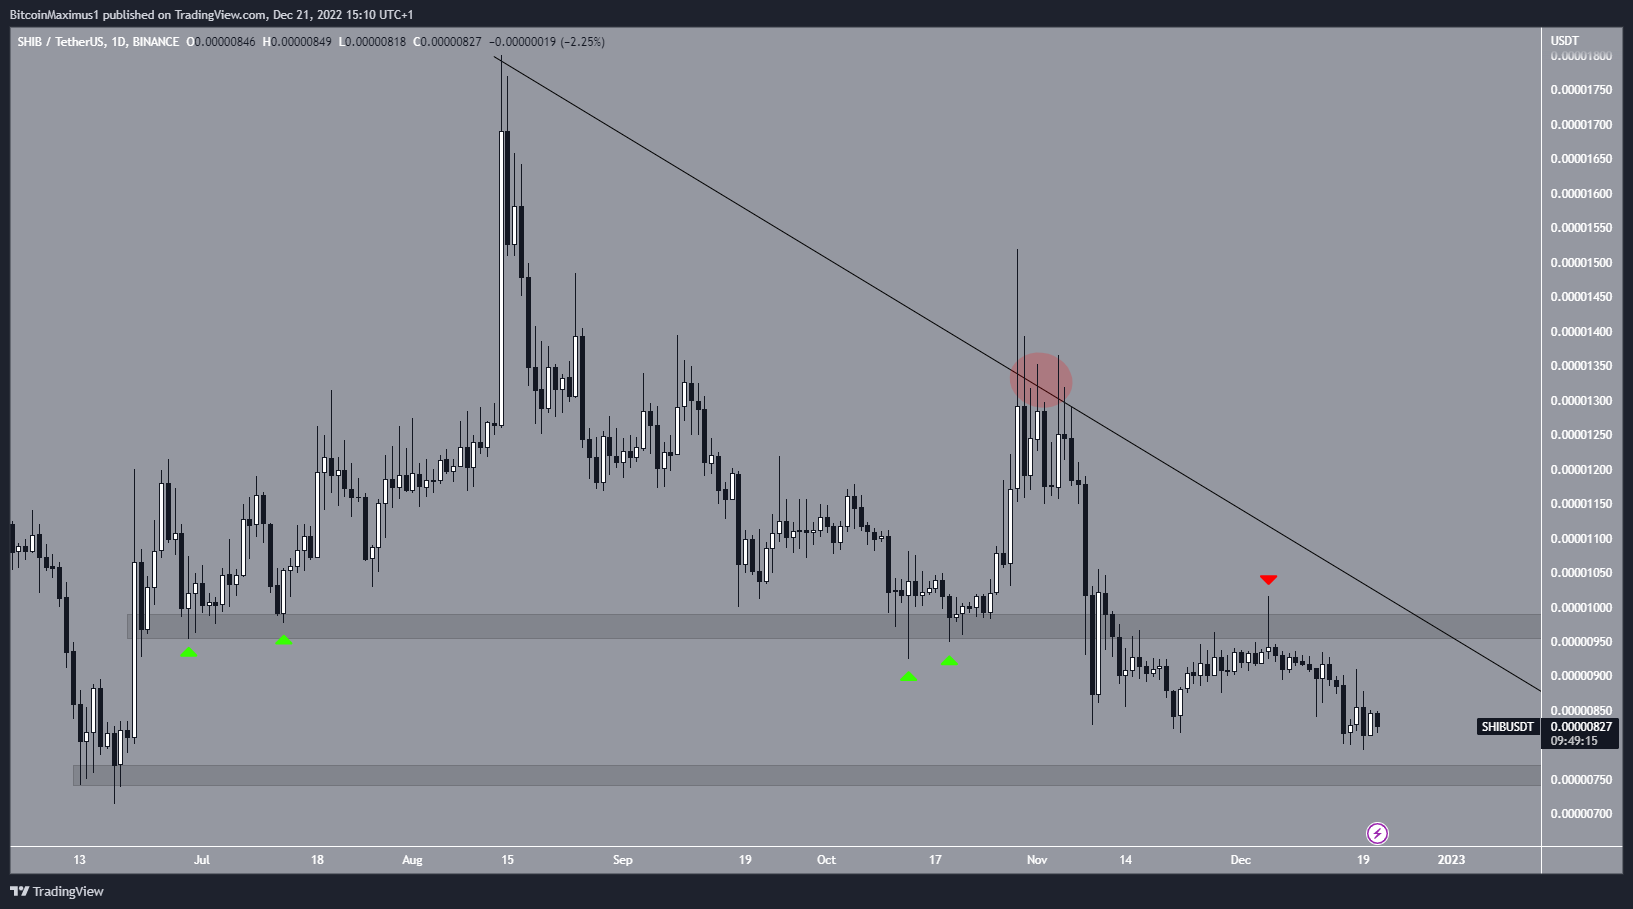
Similar to DOGE, the Shiba Inu price has also decreased below a descending resistance line since Aug. 14. The line caused numerous rejections between Oct. 29 – Nov. 5 (red circle). Afterward, the SHIB price broke down below the $0.0000097 horizontal area, which had acted as support since July.
After the breakdown, the area rejected the SHIB price on Dec. 4 (red icon) and fell over the next 24 hours. So far, it has reached a low of $0.0000079.
The yearly lows create the next closest support area at $0.0000076. The most likely scenario is a gradual drop toward it.
Breaking out from the resistance line and reclaiming the $0.0000097 area would mean that the trend is bullish instead.
To conclude, the DOGE and SHIB prices both show bearish signs, indicating that the downward movement is likely to continue. Breaking out from their respective resistance lines would mean that a bullish reversal has begun instead.
For BeInCrypto’s latest crypto market analysis, click here.


