


October was a very bullish month for cryptocurrencies. Bitcoin (BTC) increased by 32% and reached a new all-time high price on Oct 20 and six altcoins increased by triple digits, led by Shiba Inu (SHIB).
The ten altcoins that increased the most during the month of October were:
- Shiba Inu (SHIB): 1005%
- Secret (SCRT): 350%
- Frax Share Price (FRX): 224%
- Fantom (FTM): 190%
- Curve DAO Token (CRV): 120%
- Harmony (ONE): 100%
- 1Inch (1INCH): 97%
- Near Protocol (NEAR): 79%
- Thorchain (RUNE): 75%
- Axie Infinity (AXS): 67%
SHIB
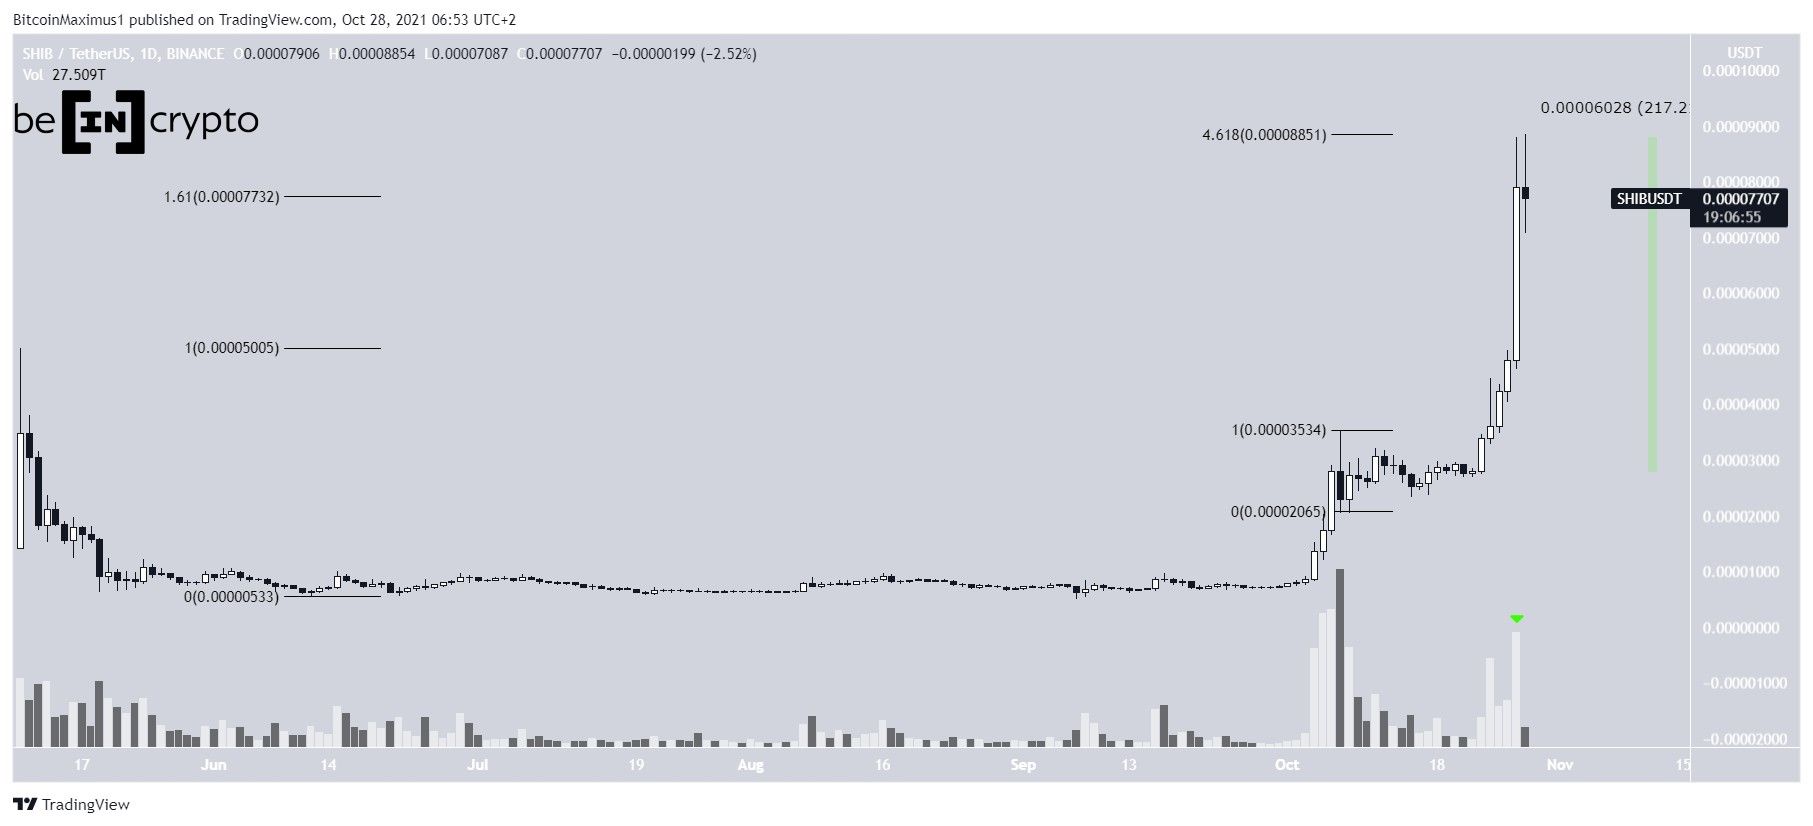
SHIB has been moving upwards since the beginning of October. It has massively accelerated since Oct 23. In a span of only four days, SHIB increased by 217%.
However, it was rejected by an important Fib resistance level near $0.000088. This is the 4.618 external Fib retracement level when measuring the most recent drop. It often acts as the local top during upward moves.
Furthermore, it coincides with the 1.61 external Fib retracement level of the previous drop resulting from the then all-time high in May.
Finally, volume has been decreasing (green icon) relative to the beginning of the pump, another sign that the upward move is weakening.
However, SHIB is trading inside a short-term continuation pattern, which could lead to another breakout.
SCRT
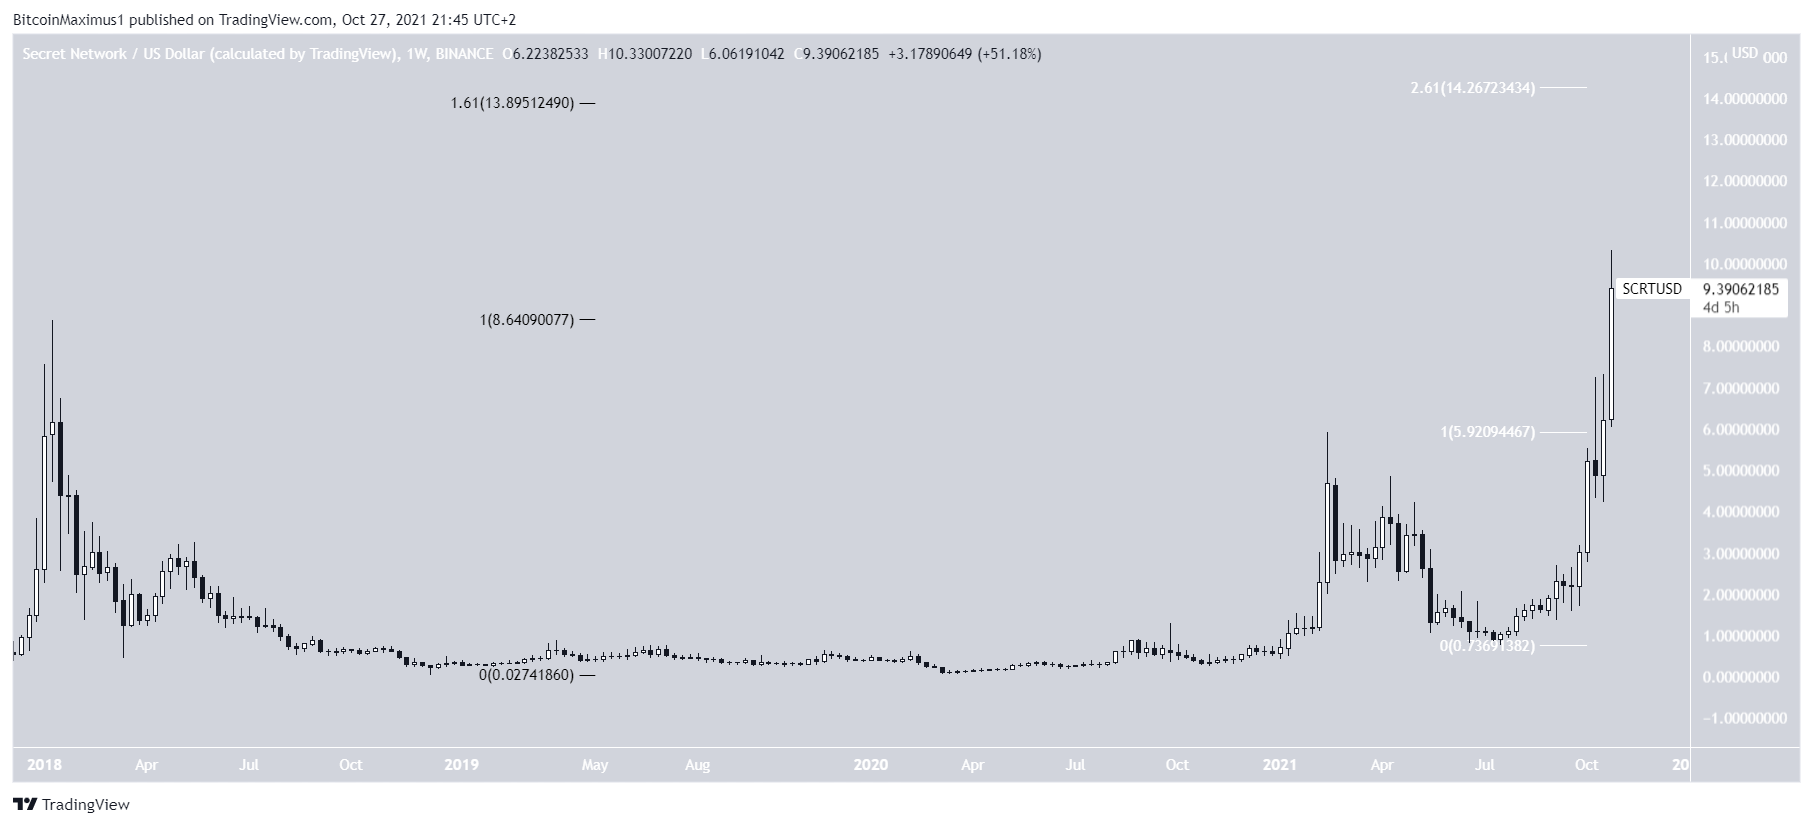
SCRT has been increasing parabolically over the past week. It managed to reach a new all-time high price on Oct 28, moving above the $10 level for the first time.
The next resistance area is found between $13.90 and $14.25. The area is created by using long-term (black) and short-term (white) external FIb retracement levels.
Due to both levels providing a similar target, the area is expected to act as strong resistance.
FXS
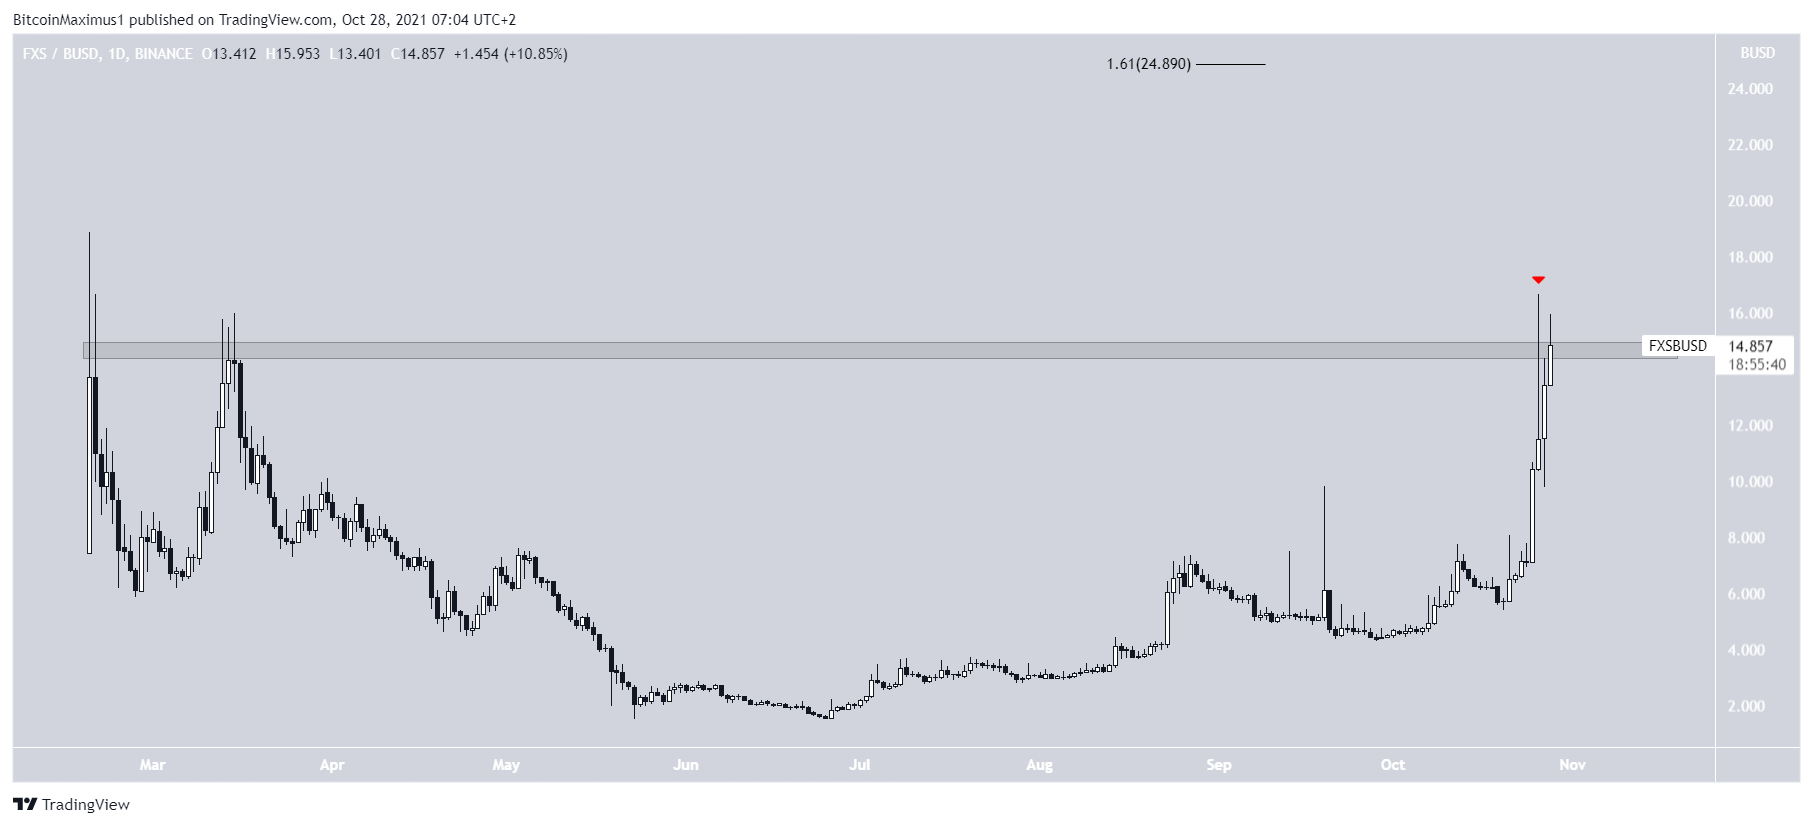
FXS has been increasing at an accelerated rate since Oct 20.
Currently, it’s trading at the final resistance area prior to an all-time high, found at $14.80.
FXS was initially rejected by this resistance area on Oct 26, creating a long upper wick in the process (red icon). However, it’s currently in the process of making yet another breakout attempt.
If the attempt is successful, the next resistance area would be found at $24.90. This is the 1.61 external Fib retracement resistance level when measuring the previous drop.
FTM
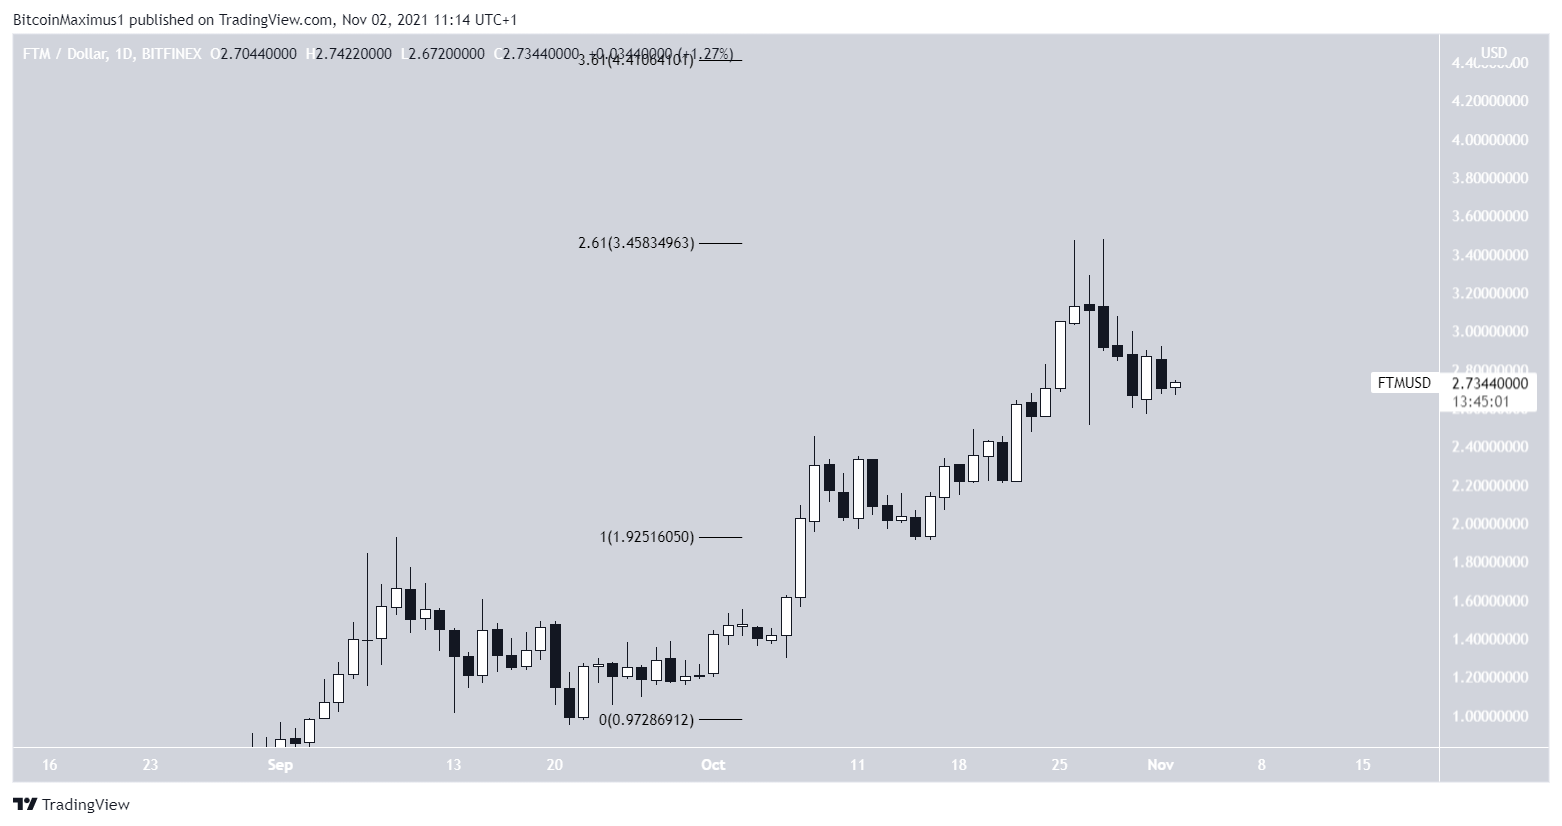
Similar to both SHIB and FXS, the FTM rally greatly accelerated on Oct 22. On Oct 26, FTM was rejected by the 2.61 external Fib retracement level at $3.45.
After regaining its footing, it made another breakout attempt, which was also unsuccessful.
If a breakout occurs, the next resistance would be found at $4.41. This is the 3.61 external Fib retracement resistance level when measuring the most recent drop.
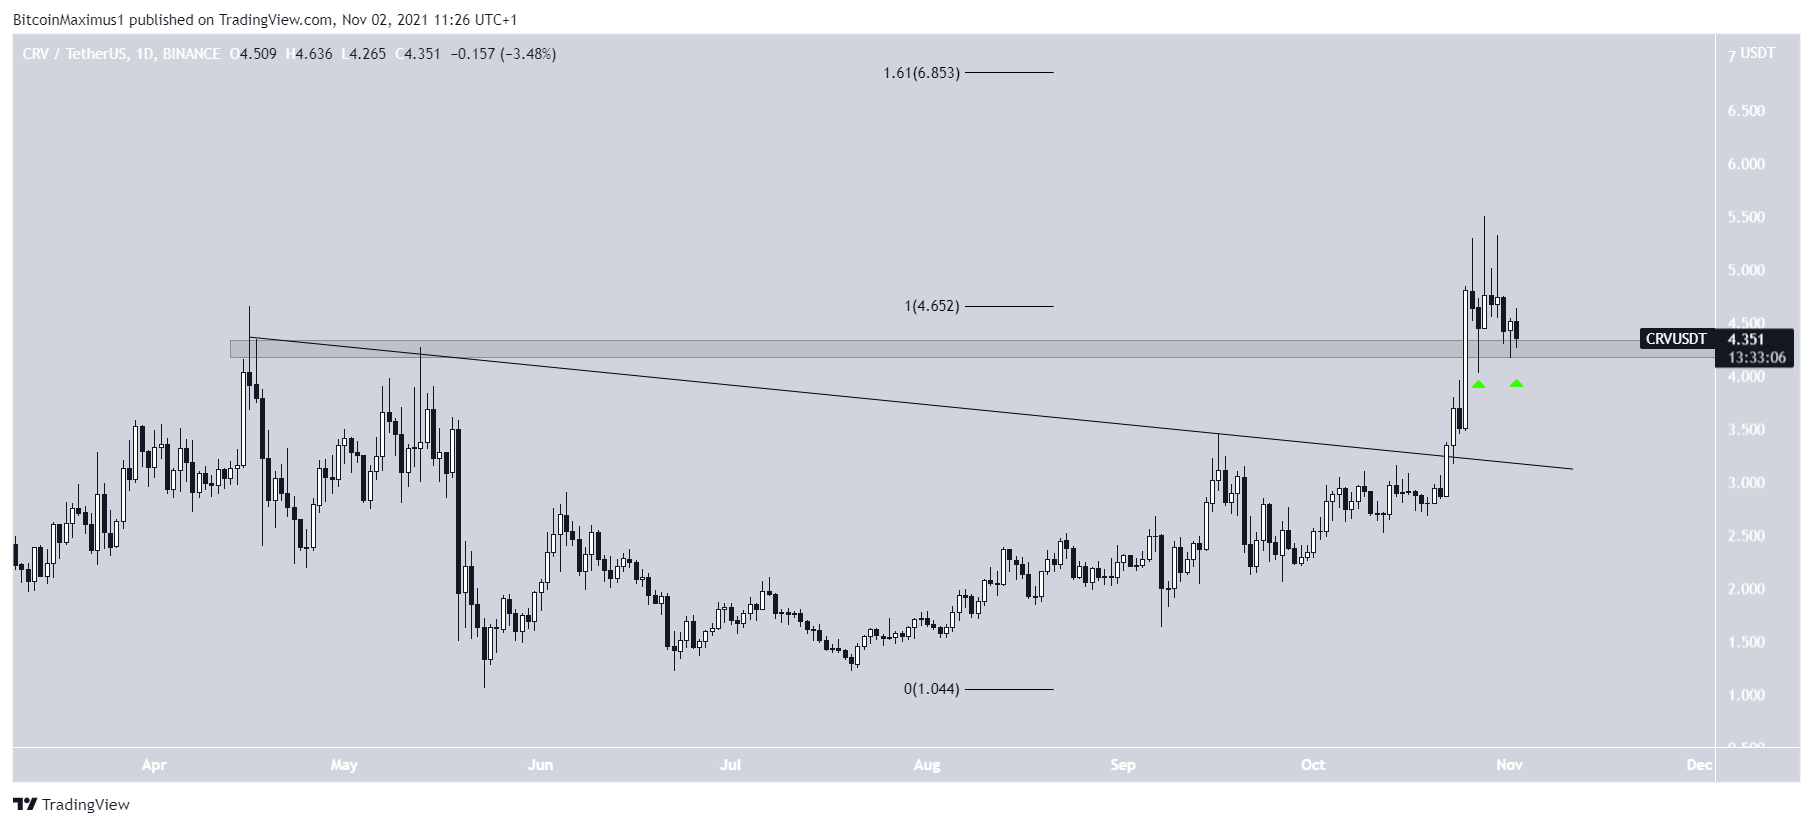
CRV
CRV has been increasing at an accelerated rate since breaking out from a descending resistance line on Oct 22. This indicated that the correction in place since the previous all-time high had come to an end.
After reaching a new all-time high, CRV validated the previous resistance at $4.20 as support (green icon) and continued its upward move. It reached yet another all-time high on Oct 28 but fell back to the support area after.
The next resistance area is found at $6.85. This is the 1.61 external Fib retracement level when measuring the previous drop.
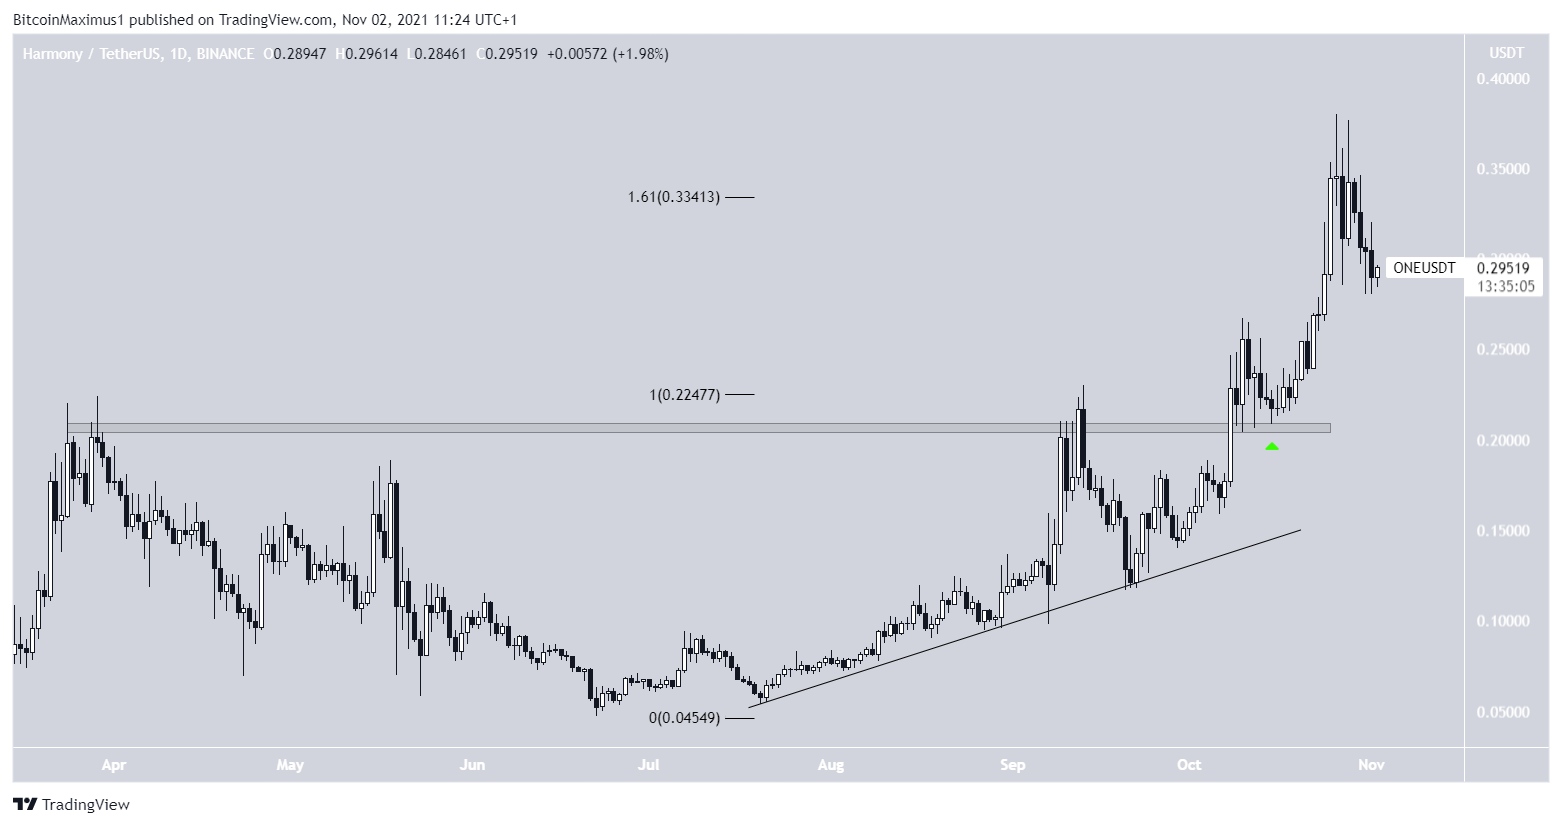
ONE
ONE has been increasing alongside an ascending support line since the beginning of July.
It accelerated on Aug 8 and ONE broke out from the $0.205 horizontal resistance area the same day. Two days later, it proceeded to reach a new all-time high of $0.266.
After validating the $0.205 area as support (green icon), ONE resumed its upward move and reached a new all-time high on Oct 26.
However, ONE was rejected by the 1.61 external Fib retracement resistance level and is in the process of decreasing.
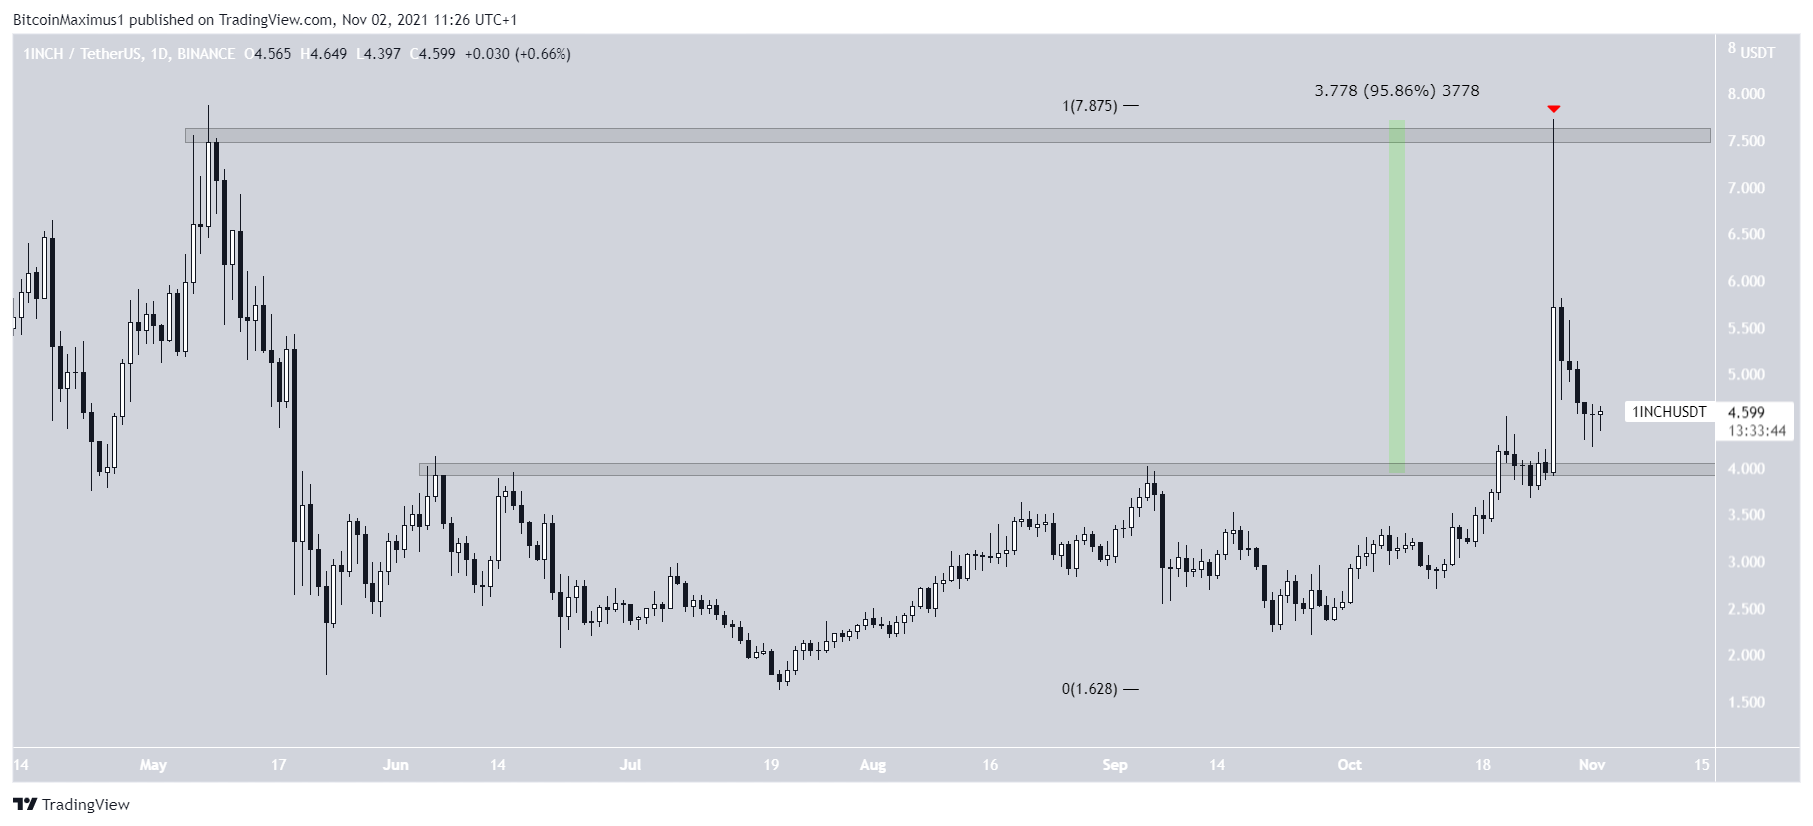
1INCH
1INCH made a huge move to the upside on Oct 27, at one point reaching a magnitude of 95%. This only barely failed to create a new all-time high price, falling short by $0.12.
It was rejected by the $7.60 resistance area and has been falling since. The same day, it created a long upper wick with a magnitude of 26% — a strong sign of selling pressure.
The closest support area is found at $4.
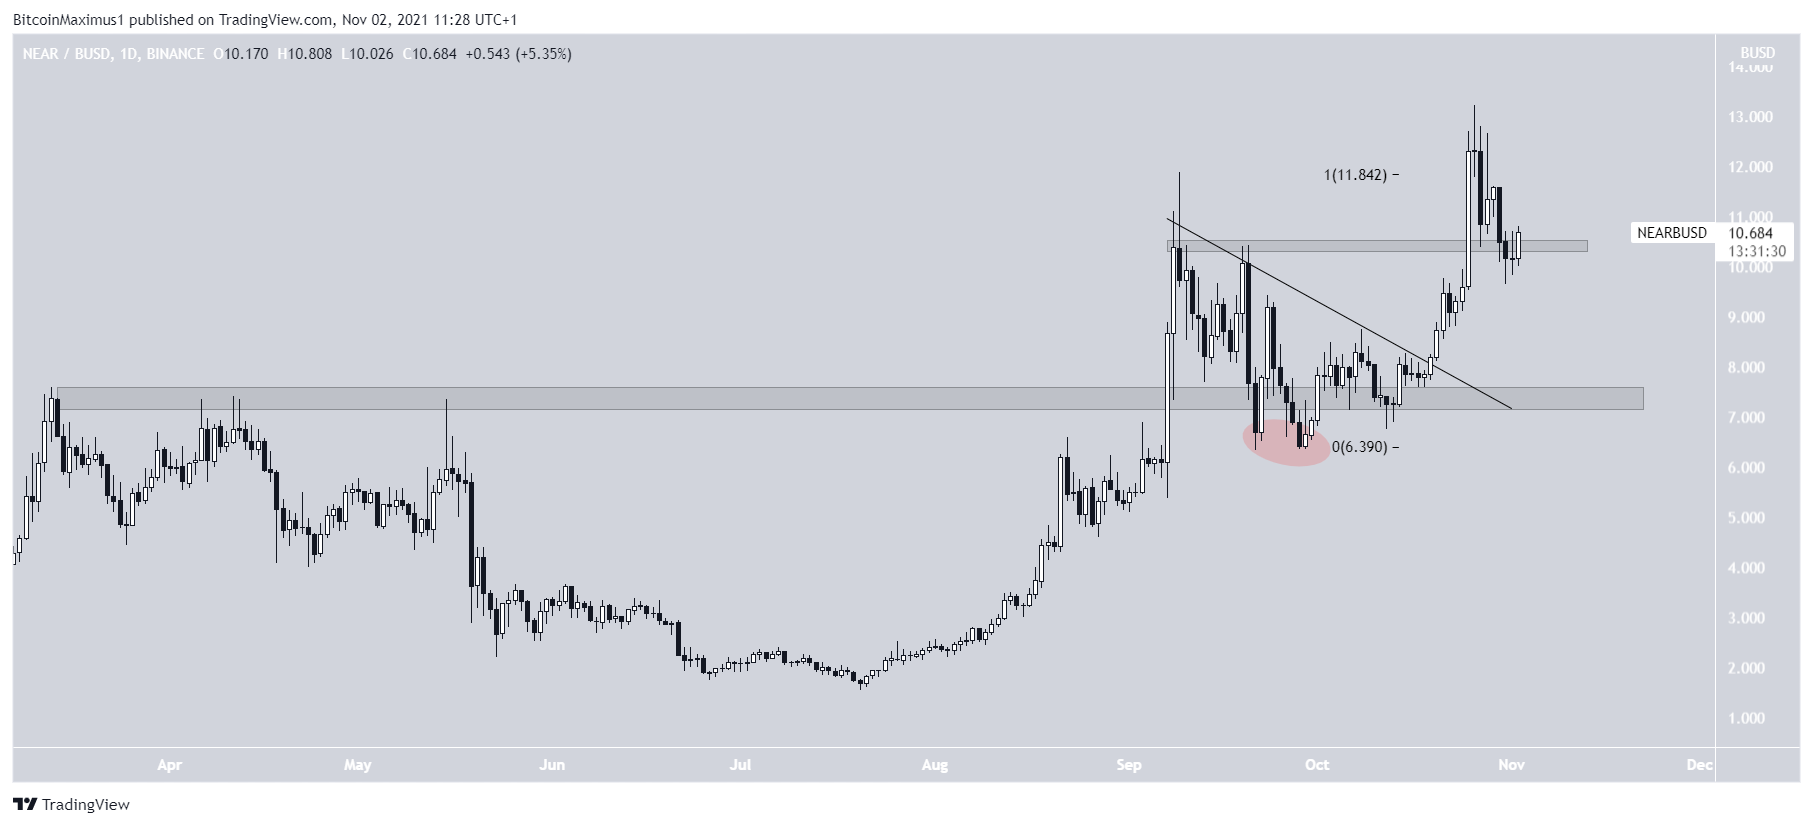
NEAR
On Sept 26, NEAR deviated below the previous all-time high resistance area of $7.40 and reclaimed it after.
On Oct 19, it broke out from a descending resistance line and has been increasing at an accelerated rate since.
NEAR reached a new all-time high price of $13.22 on Oct 26. The next day, it bounced at the $10.55 support area and initiated yet another upward move. However, it was unsuccessful and returned to the $10.55 area once again.
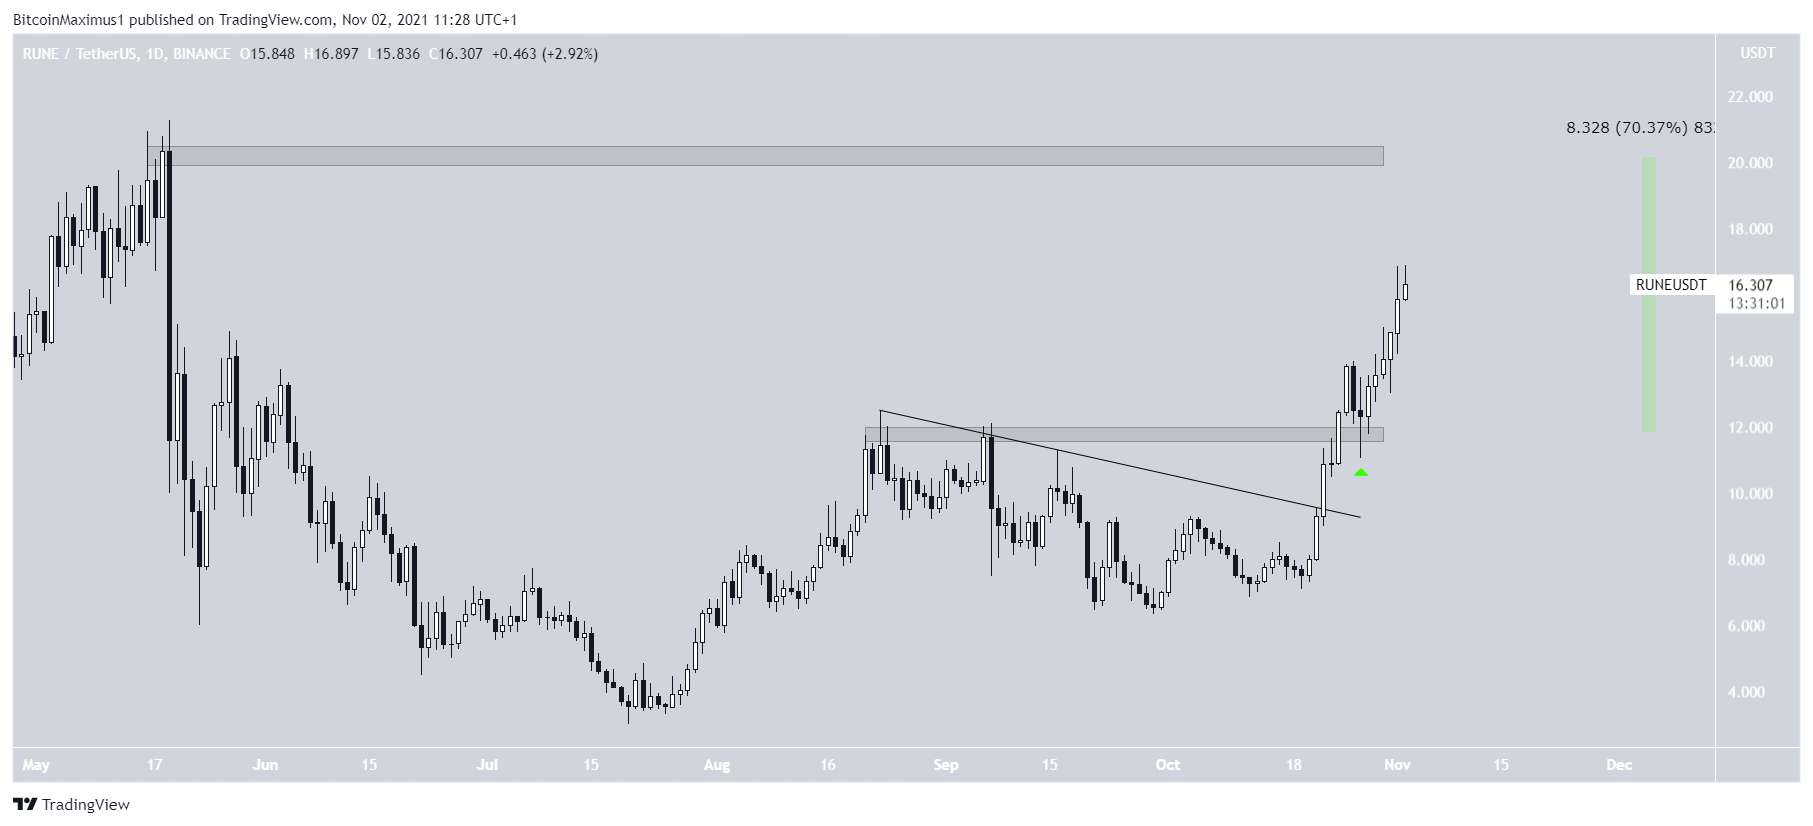
RUNE
RUNE has been increasing since breaking out from a descending resistance line on Oct 22. On Oct 24, it moved above its September highs of $12.20. It’s currently in the process of validating this area as support (green icon).
RUNE is rapidly approaching its all-time high, which is 70% above the $11.80 horizontal support area.
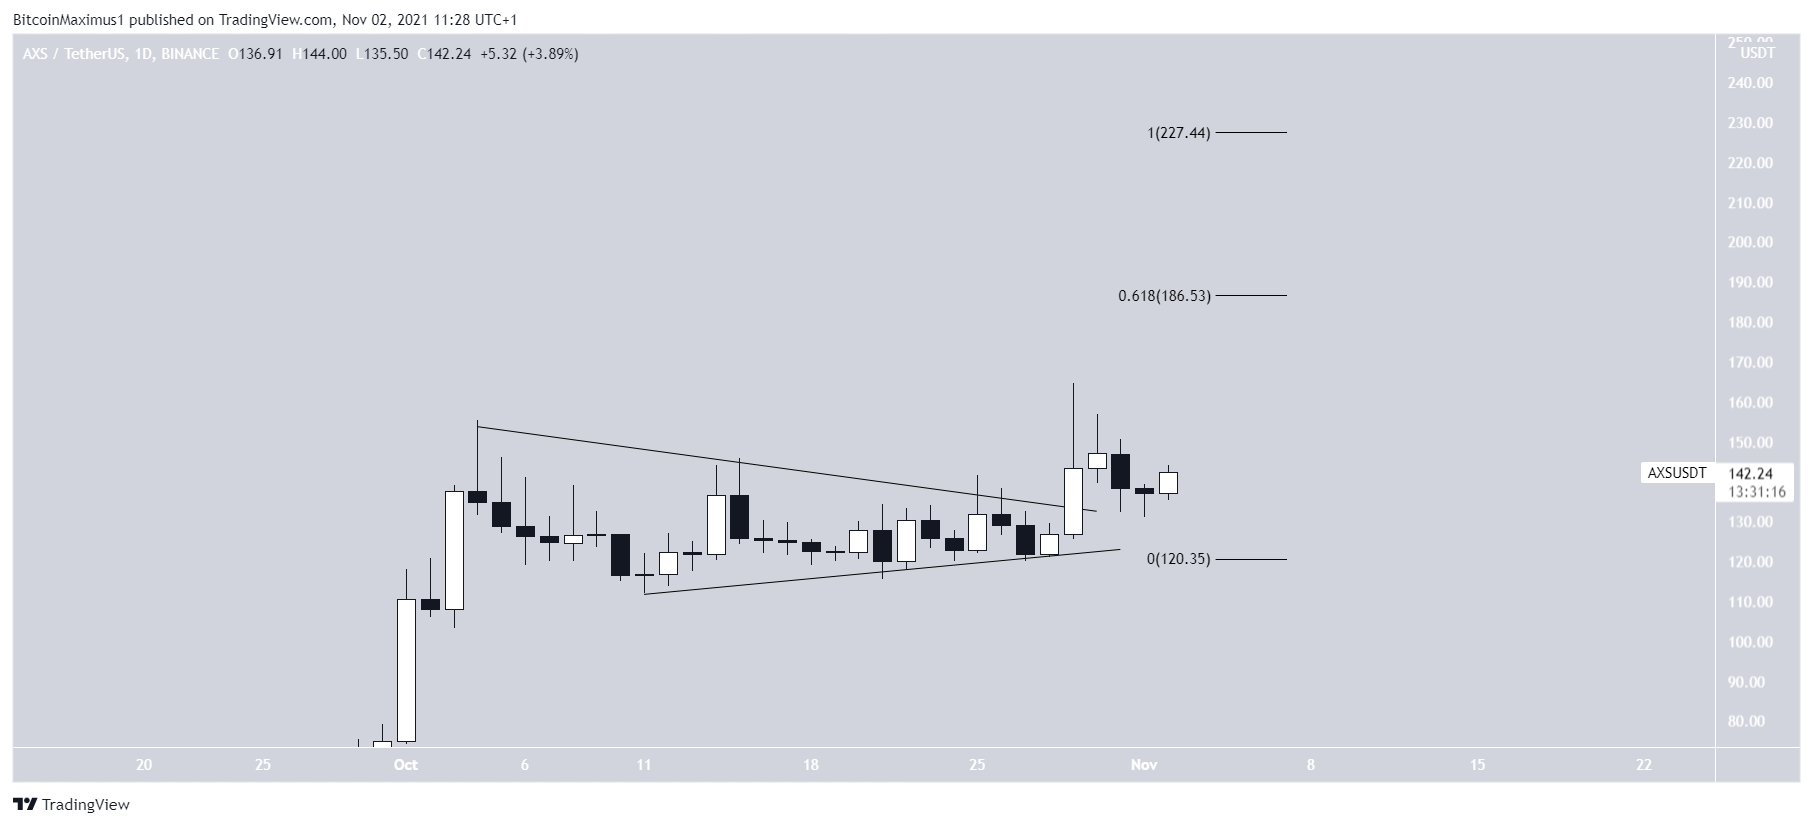
AXS
Since reaching an all-time high on Oct 4, AXS has been decreasing inside a symmetrical triangle. This is often considered a neutral pattern.
AXS managed to break out of this pattern on Oct 31. The next resistance levels would be found at $186.50 and $227.50. The first would give the current and previous upward moves a 0.618:1 ratio while the second would give them a 1:1 ratio.
For BeInCrypto’s previous Bitcoin (BTC) analysis, click here.


