


Serum (SRM) has shown critical bullish reversal signs since its bounce on Feb. 24. It has potentially completed a long-term correction.
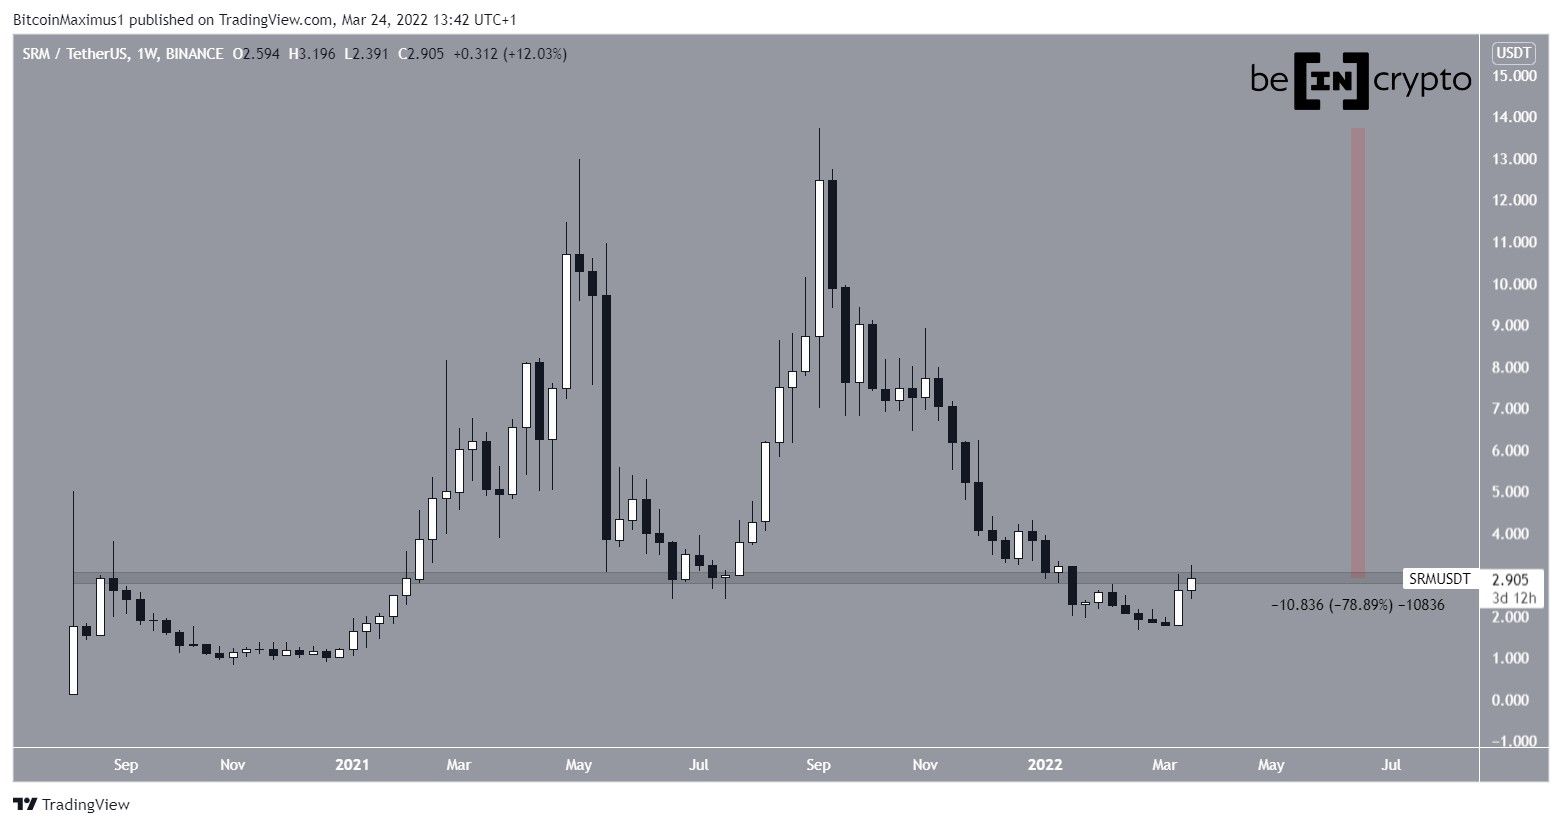
SRM has been falling since reaching an all-time high price of $13.73 on Sept. 10. So far, the downward movement has led to a low of $1.65 on Feb. 24. The price has bounced since.
However, it is still trading inside the main resistance level at $2.85. The level initially acted as resistance on Sept. 2020 before turning to support on July 2021. A weekly close above it would be considered an important bullish development.
SRM is currently 79% below its all-time high price.
Future movement
Cryptocurrency trader @Altcoinsherpa tweeted a chart of SRM, stating that the price could gradually increase towards $3.
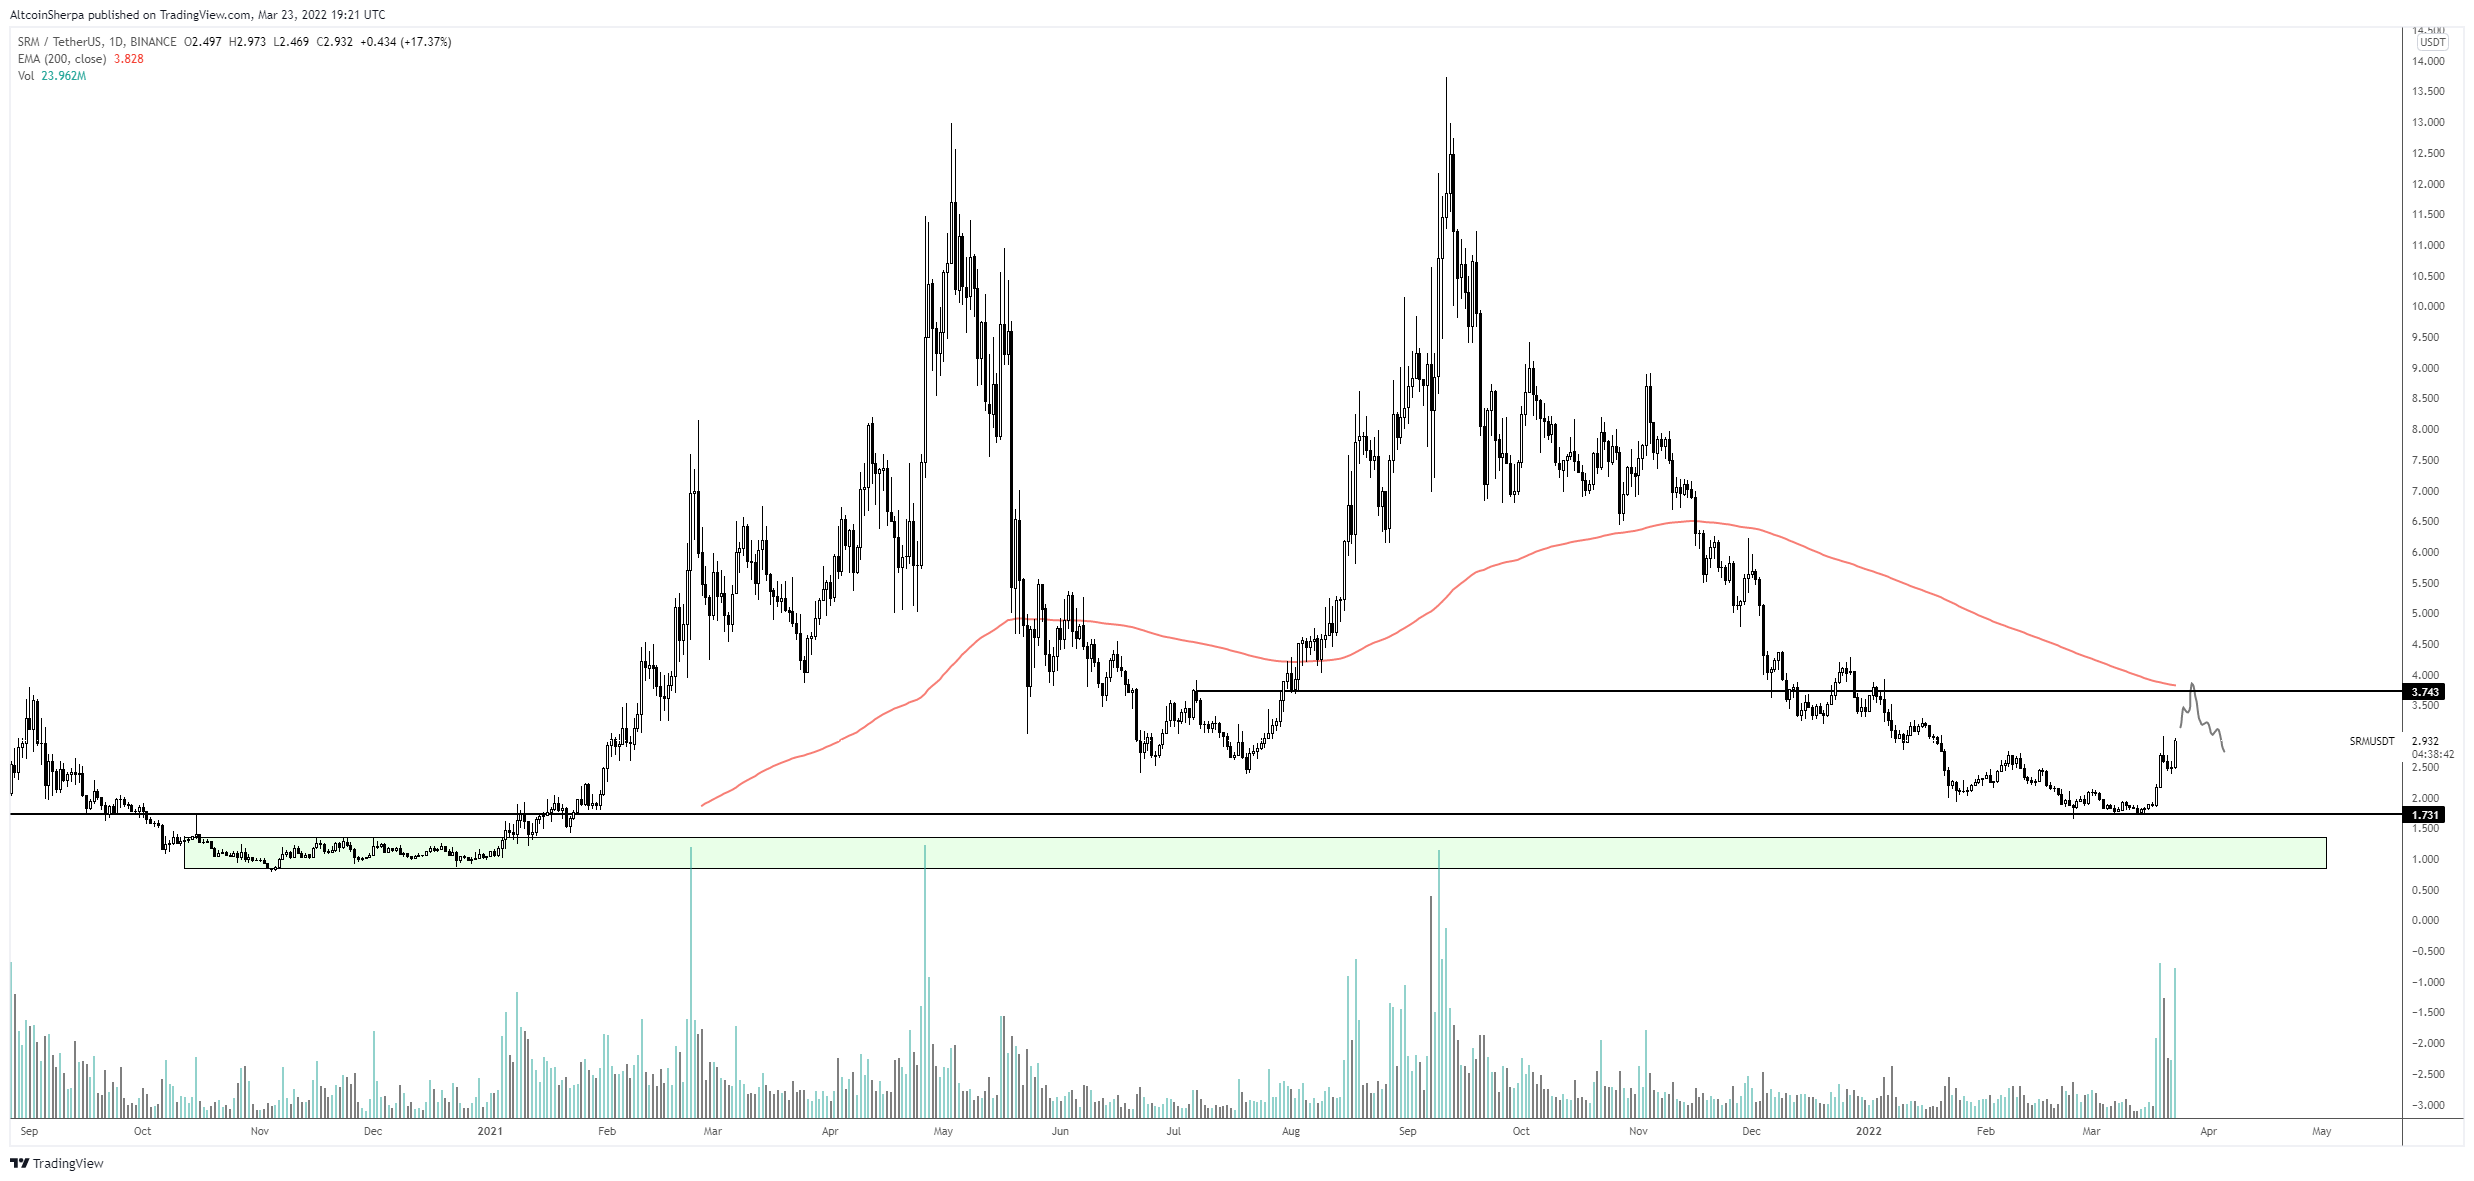
The daily chart supports the continuation of the upward movement.
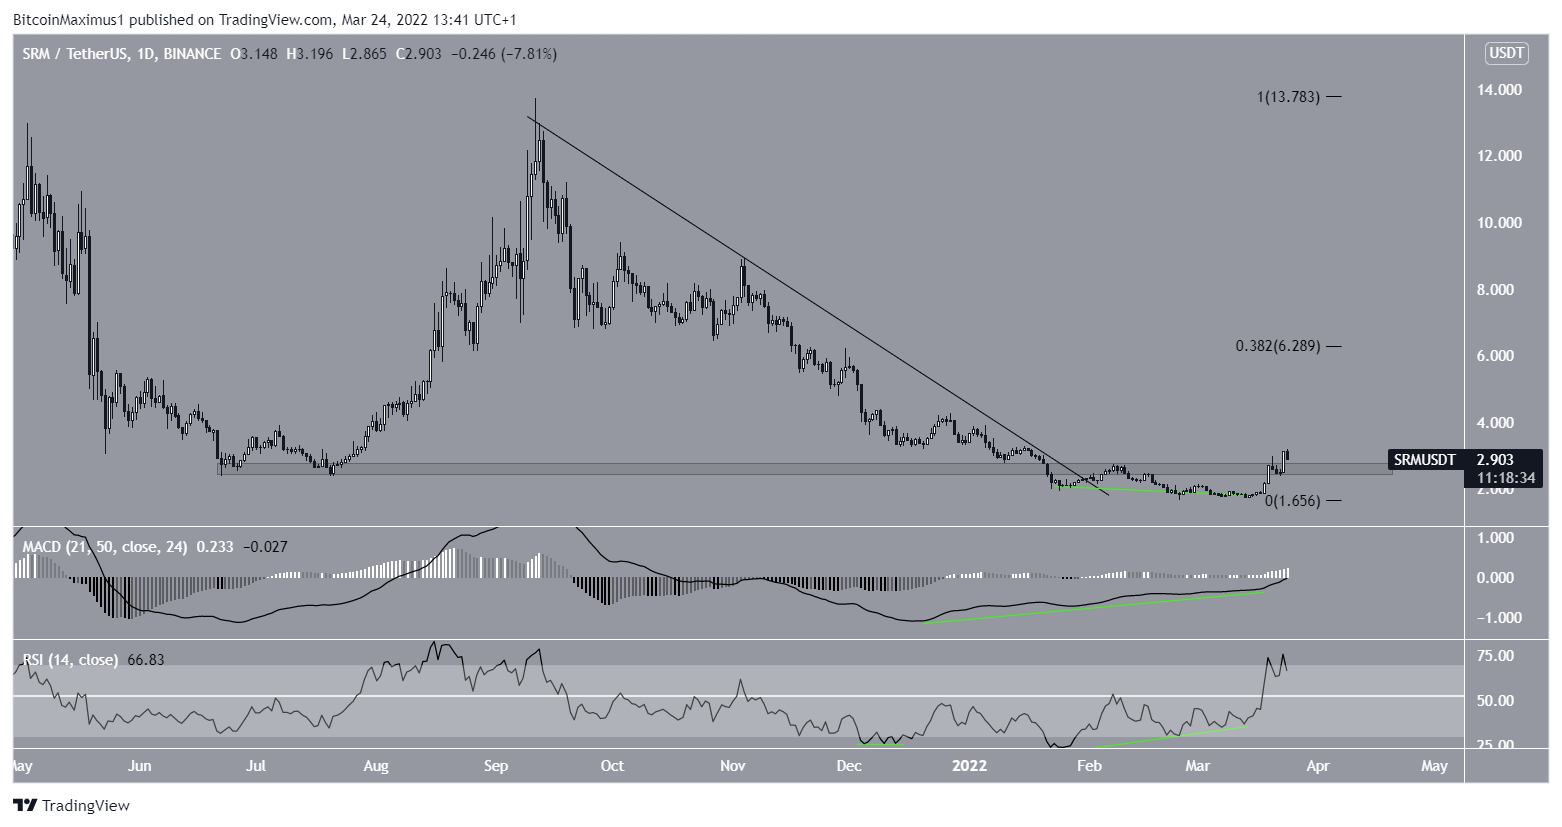
Firstly, the price has already broken out from a descending resistance line that was previously in place since the all-time high.
Secondly, both the RSI and MACD have generated bullish divergences (green lines), preceding the current upward movement. Since the divergence, the MACD has crossed into positive territory and the RSI has moved above 50. Both of these are considered signs of a bullish trend.
Furthermore, unlike the weekly time-frame, SRM has already reached a close above the $2.65 resistance area in the daily time-frame.
The closest resistance area is at $6.30. This is the 0.382 Fib retracement resistance level.
SRM wave count analysis
The wave count suggests that SRM has completed an A-B-C corrective structure (white) when measuring since the aforementioned all-time high price.
In it, waves A:C have had an exactly 1:1 ratio, which is common in such structures. The sub-wave count is given in black.
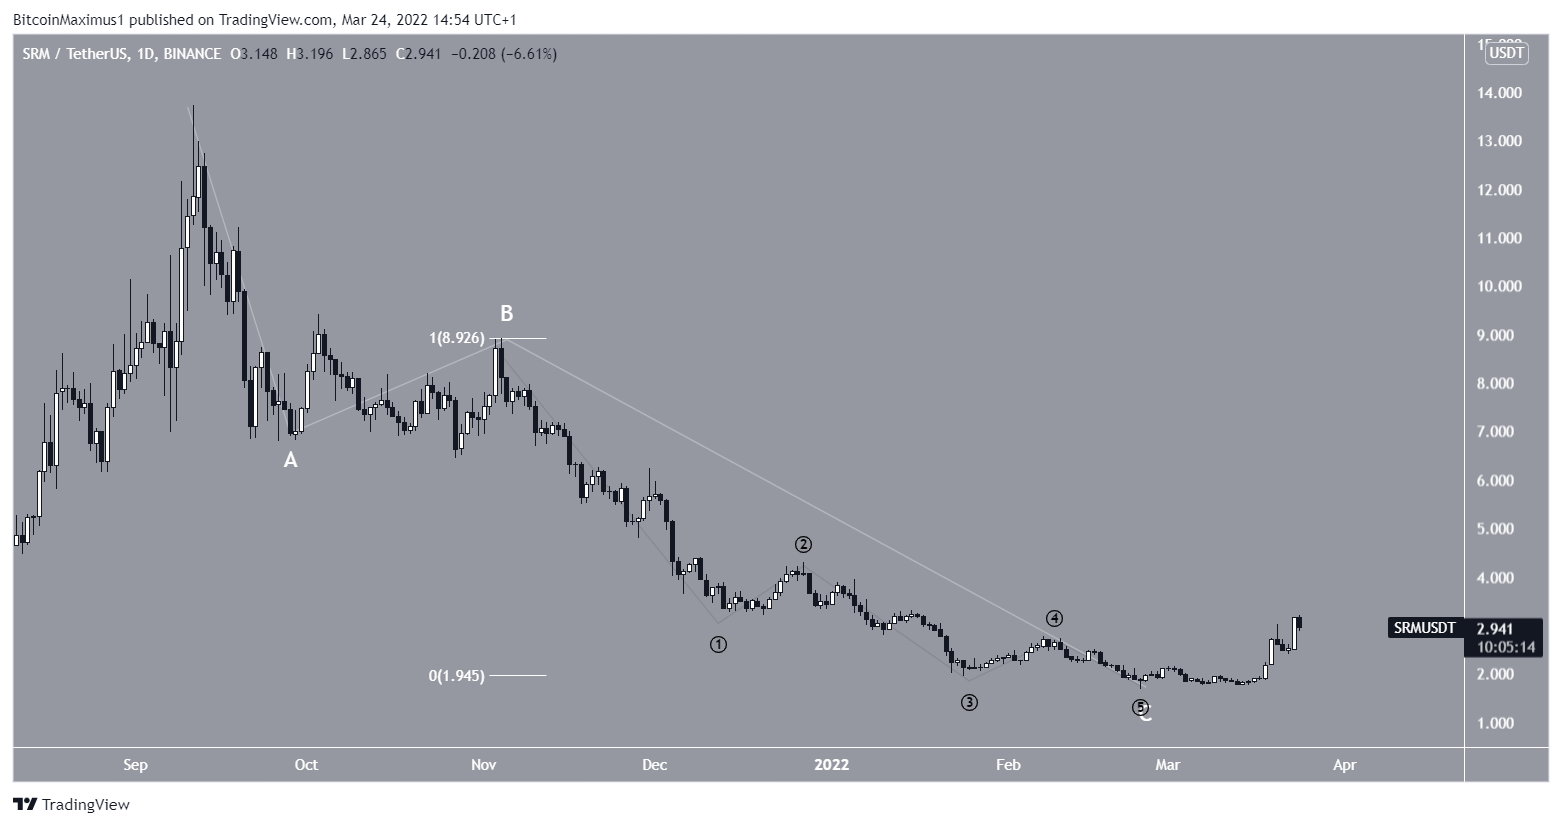
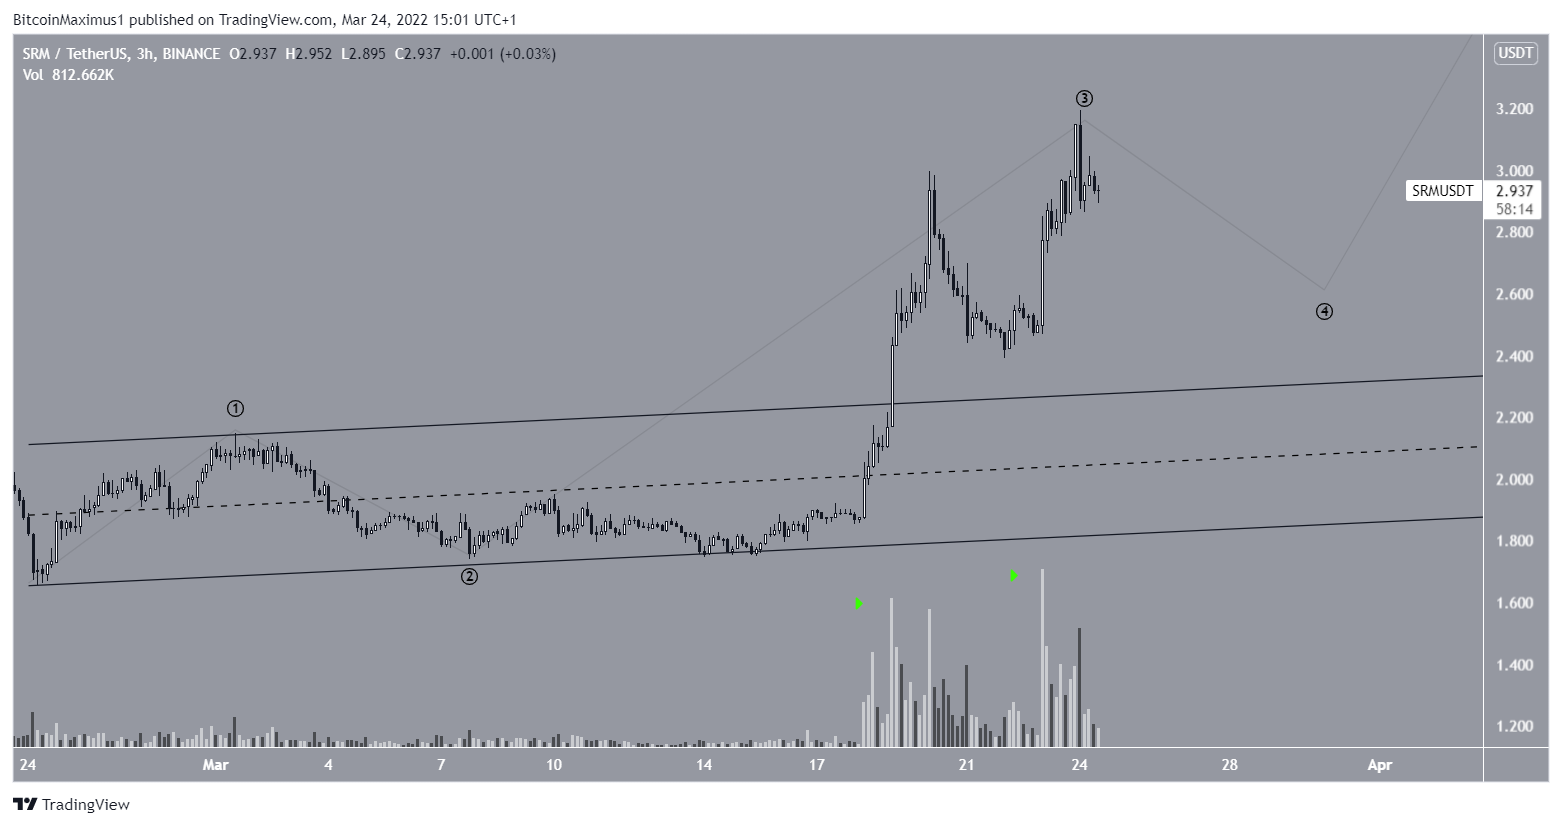
The two-hour chart shows that it is likely that SRM has begun a new bullish impulse. The reason for this is the massive volume (green icons) in the breakout from the ascending parallel channel. If so, it is currently in wave four of a five wave upward movement.
Therefore, after a short-term drop, another increase would be expected.
For BeInCrypto’s latest Bitcoin (BTC) analysis, click here.
What do you think about this subject? Write to us and tell us!


