


According to famous analyst Willy Woo, Bitcoin (BTC) has just begun a re-accumulation phase.
This means that the bottom of the cycle has most likely already been reached, and that an influx of “smart money” into the crypto market is to be expected.
Willy Woo recently tweeted a series of macro charts of Bitcoin, which show the current condition of the crypto market. They reveal how the BTC market is gaining momentum, leaving the region that has historically correlated with the end of a bear market. Interestingly, the relatively high stability of the BTC price over the past few weeks suggests that a move even to the $40,000 area may be in the cards.
Willy Woo Suggests the Beginning of Re-Accumulation
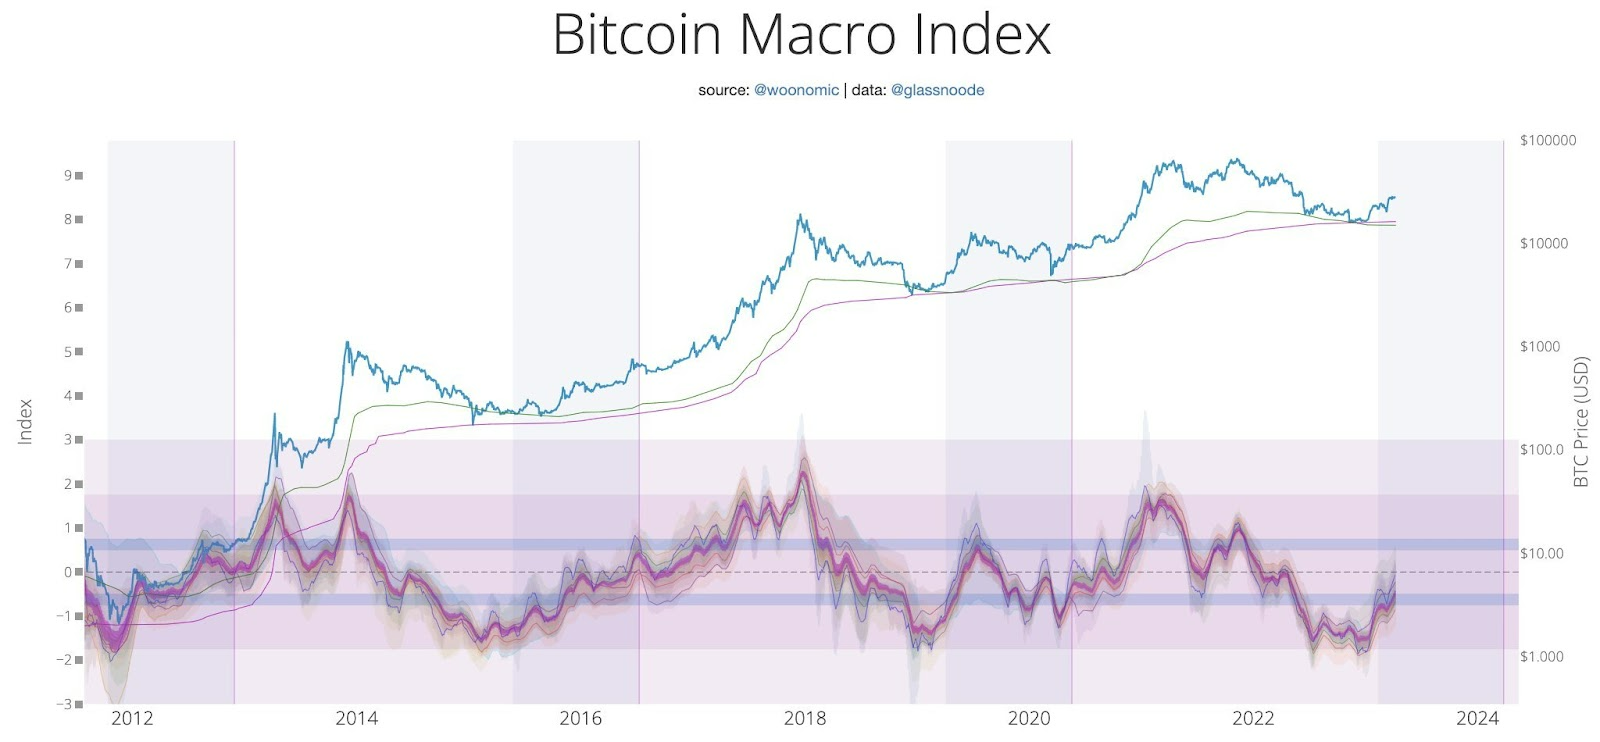
The main chart Willy Woo refers to is the so-called Bitcoin Macro Index. The value of this index has just broken out above the lower blue line. According to the pioneer of on-chain analysis in previous market cycles, this signaled the start of the re-accumulation phase.
This market phase is mainly characterized by a sideways / slightly bullish trend with numerous corrections still present. It usually lasts a little over a year and is a period when experienced investors (“smart money”) join the crypto market. What’s more, the BTC price does not generate more macro bottoms, and volatility stabilizes, laying the foundations for a future bull market.
Short-Term Holders Lose the Entry Point
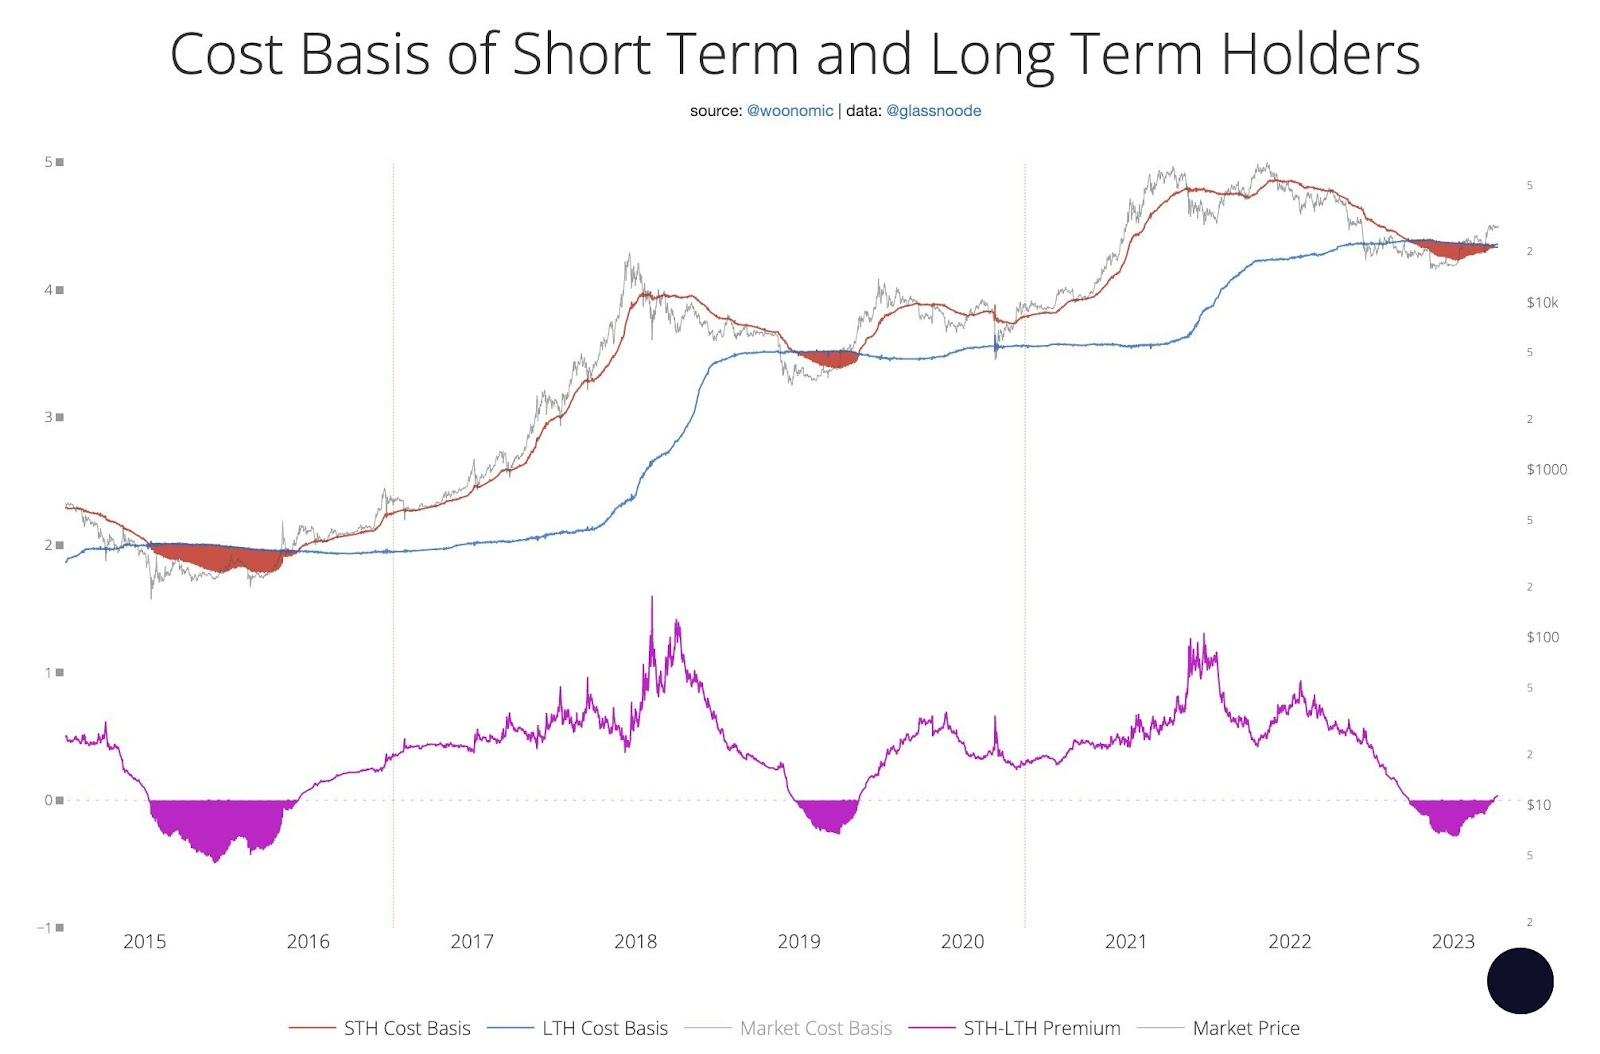
The second chart shows the ratio of the cost basis for short-term and long-term holders of Bitcoin. Willy Woo points out that “bottoms are signaled when short-term holders (recent buyers) got in cheaper than long-term holders.” In the chart below, this corresponds to the red and pink areas.
During these rare periods, the cost base of short-term holders (red line) falls below that of long-term holders (blue line). This means that the purchase price of BTC for new investors is lower than the price paid by long-term holders. Therefore, this is only possible after large declines in the long-term bear market.
It is worth mentioning that in the previous analysis of this indicator in September 2022, the cost base of short-term investors only fell below that of long-term investors. At the time, this foreshadowed that the bottom of the BTC price in this cycle had not yet been reached. This was also the case, as Bitcoin only reached a macro bottom in November at $15,476. However, now – with the opposite signal – Willy Woo notes that the buying window for short-term investors is over:
“We are now moving out of this regime.”
Short-Term Stability in the BTC Price May Lead to $40,000
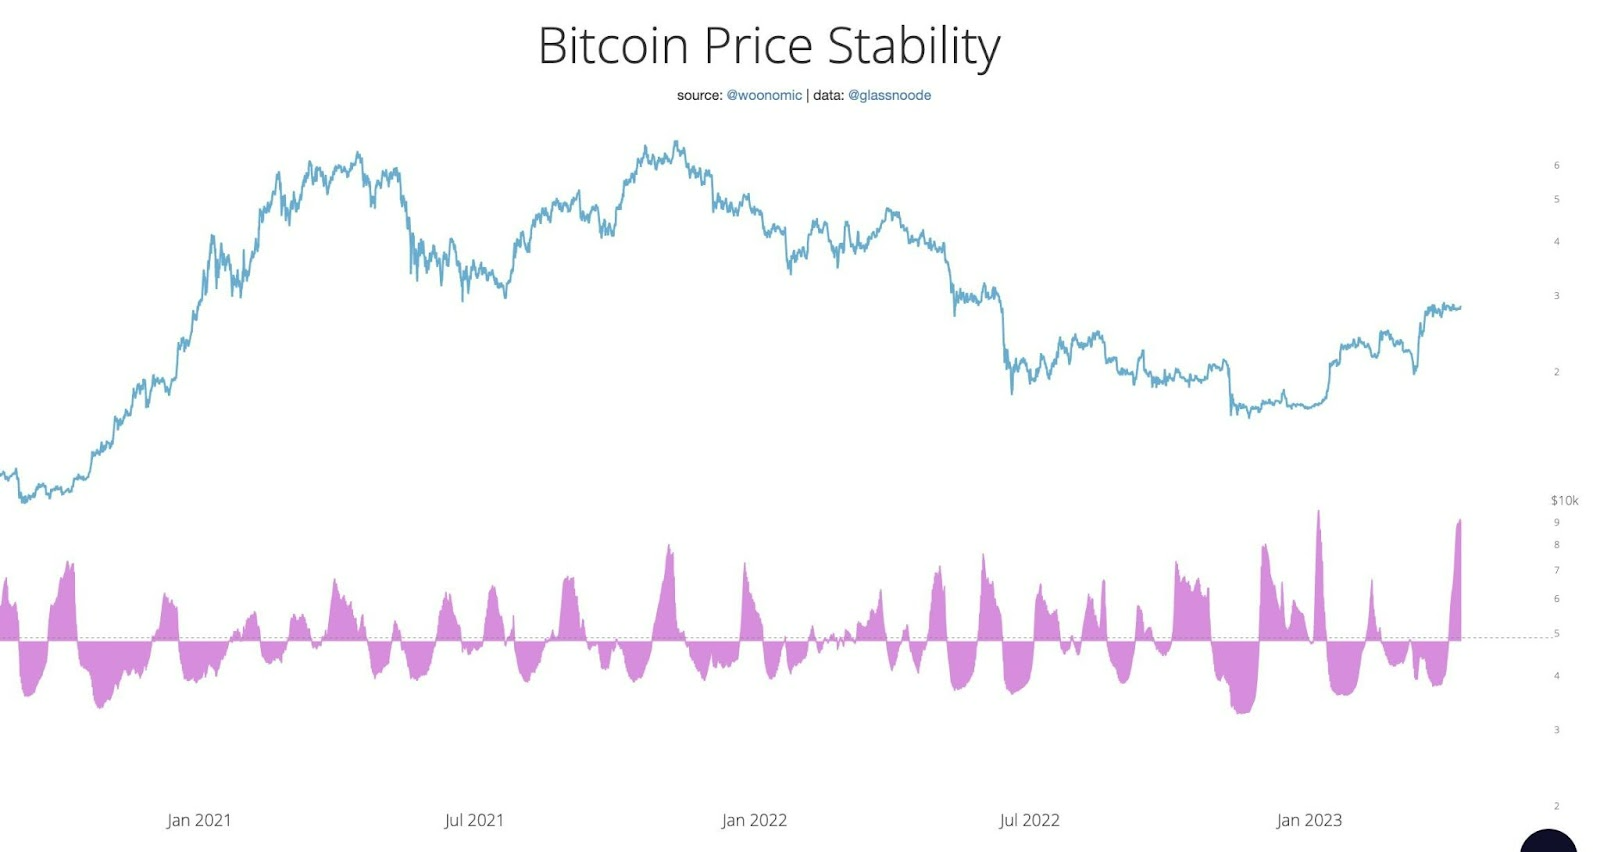
Finally, in his last argument, Willy Woo juxtaposes two charts. The first is the Bitcoin price stability and the second is orderbook liquidity. Both suggest that, as the analyst says, “volatility ramping up is a near certainty.”
Between March 18 and April 9, 2023, Bitcoin price was stuck in a narrow range between $26,500 and $29,000. The three-week sideways trend led to a sharp drop in volatility or otherwise increased stability of the BTC price.
This is illustrated by the chart below, which the on-chain analyst interprets as a “prelude to a big move.” We can see that the current peak of the pink chart is second only to the size of the late 2022 peak, which led to an increase of about 50%. If the scenario were to repeat itself, a similar rise from the $27,000 price would lead to a peak near $40,500.
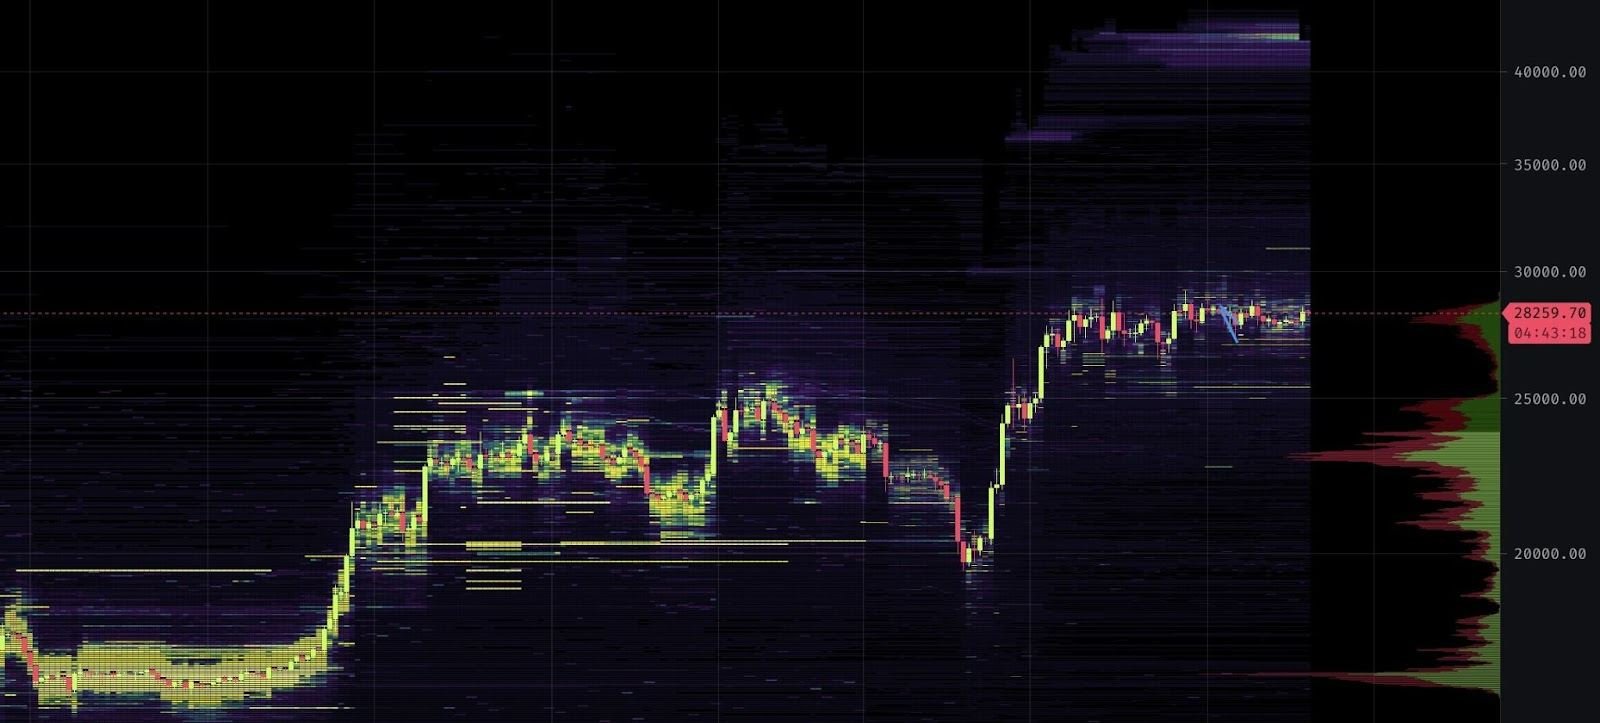
Interestingly, this target corresponds to a recent chart from Willy Woo, in which he illustrates the liquidity orderbook of BTC traders. It appears that there is a “liquidity gap” in the $30,000 – $40,000 range. Increased volatility could quickly lead to the filling of this gap and Bitcoin’s rapid movement toward the upper range.
The first step in this direction has already been taken when an increase in BTC volatility was linked to a recovery of the $30,000 level. If the trend continues, the April BTC price prediction in the $40,000 area is realistic.
For BeInCrypto’s previous Bitcoin (BTC) analysis, click here.


