


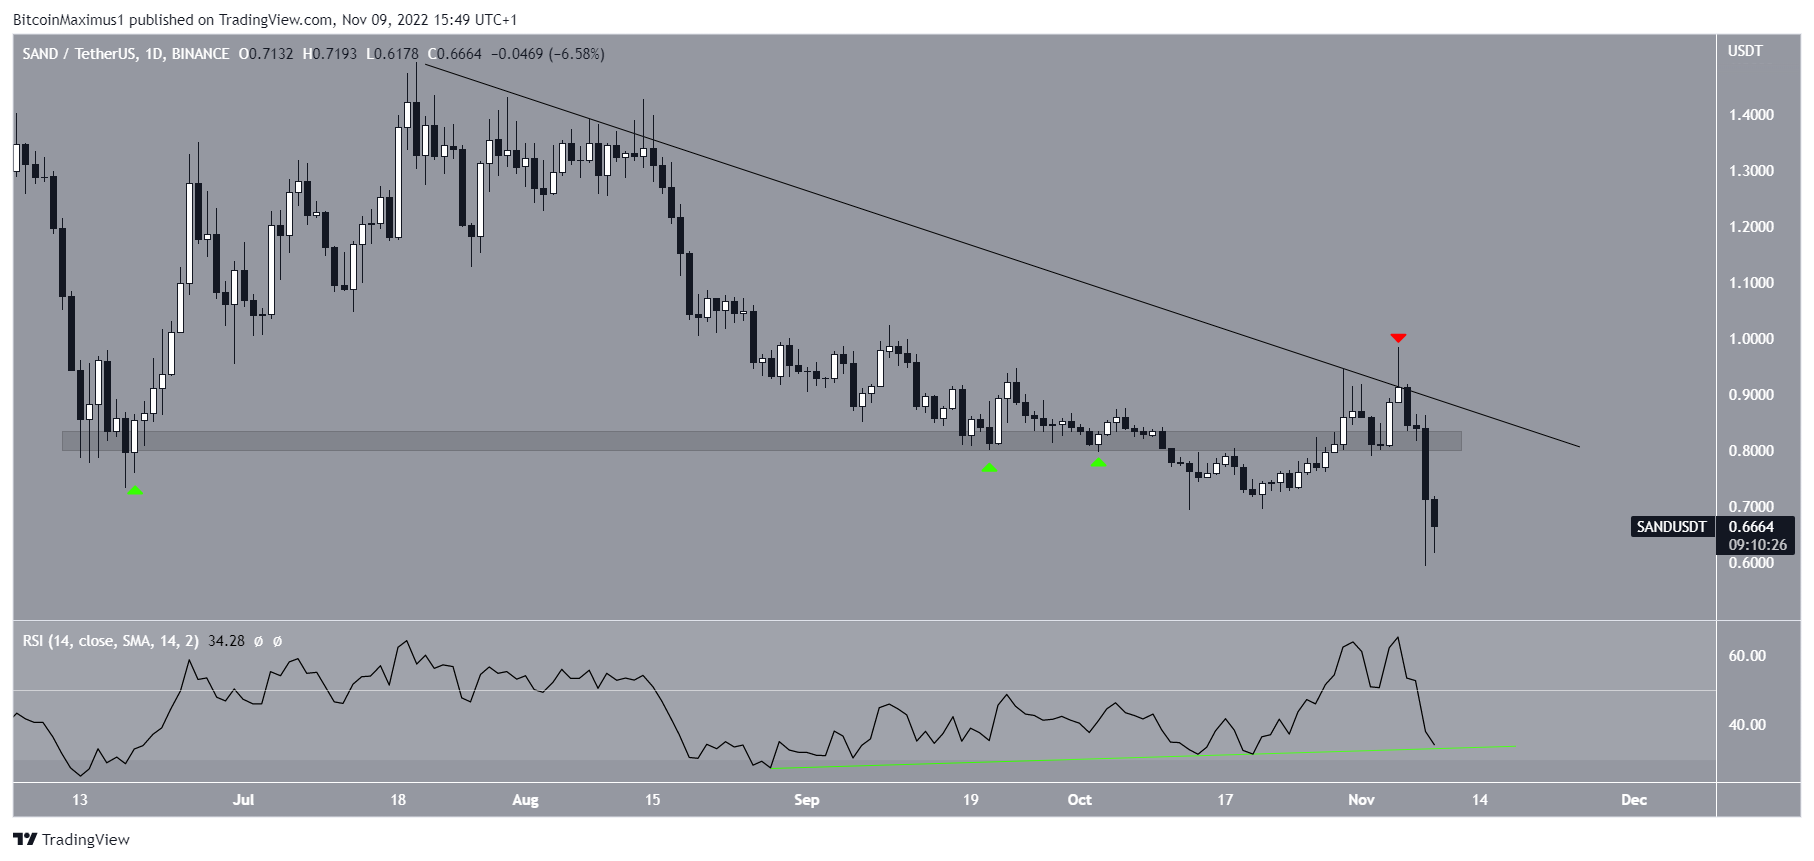
The Sandbox (SAND) price fell to a new yearly low on Nov. 8. It could continue decreasing towards the next long-term support area.
SAND is the utility token of the Sandbox metaverse. The Sandbox game is a play-to-earn game in which users can build and own pieces of land in a virtual world.
The SAND price has been decreasing underneath a descending resistance line Since July 20. More recently, the line caused a rejection (red icon) on Nov. 5. It led to a low of $0.59 three days later.
The downward movement also caused a breakdown from the $0.80 horizontal support area. The area had previously been in place since Jun 16 and caused three bounces (green icons).
An exciting development is that the bullish divergence trend line (green) from the daily RSI is still intact. However, there are no other bullish reversal signs in place beside this. Additionally, the daily RSI is still below 50, a bearish sign.
Therefore, the trend cannot be considered bullish unless the SAND price reclaims the $0.80 area. Doing so would also entail a breakout from the aforementioned descending resistance line.
The Sandbox Price Prediction: The Worst is Yet to Come
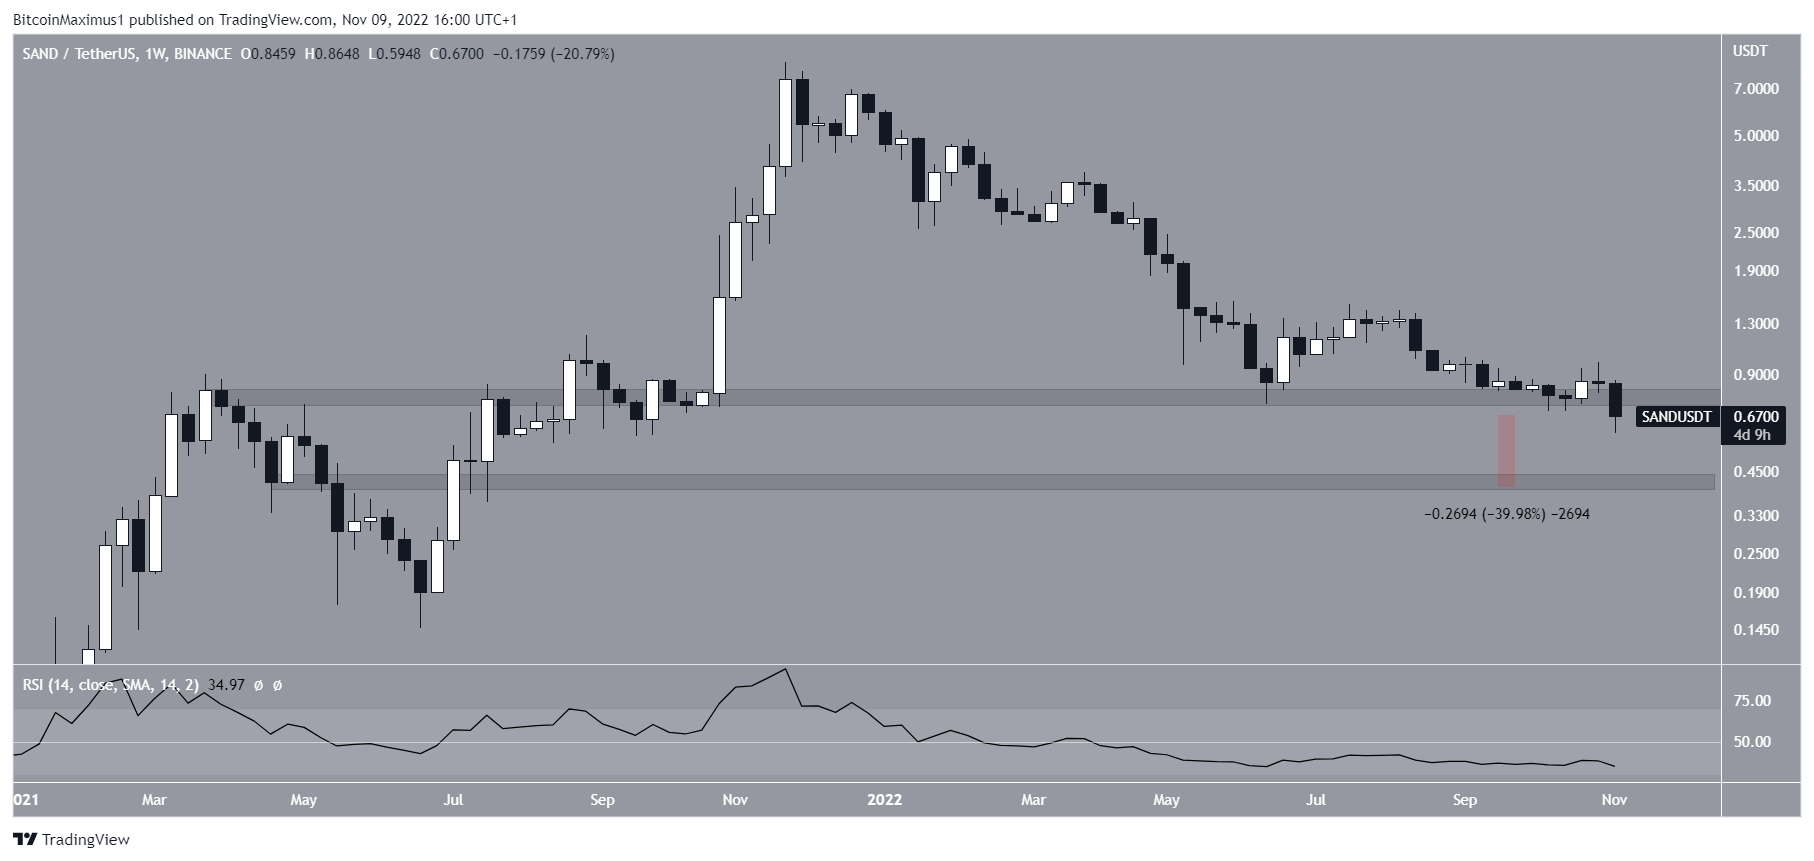
The technical analysis from the weekly time frame is bearish. It shows that the $0.080 horizontal area had actually been in place since Nov. 2021. Before, it acted as resistance since March 2021.
So, a breakdown from it can be considered a break of the bullish structure and can lead to new lows. If the downward movement continues, the closest support area would be at $0.42. The area has not been reached since July 2021. Measuring from the current price it would amount to a decrease of 40%.
As stated above, reclaiming the $0.80 area would invalidate this bullish price prediction. Due to the falling RSI and bearish price action, this seems unlikely.
For BeInCrypto’s latest Bitcoin (BTC) analysis, click here.
Disclaimer: BeInCrypto strives to provide accurate and up-to-date information, but it will not be responsible for any missing facts or inaccurate information. You comply and understand that you should use any of this information at your own risk. Cryptocurrencies are highly volatile financial assets, so research and make your own financial decisions.


